. 2022 Mar 24;12(1):5096.
doi: 10.1038/s41598-022-08940-4.

Supervised machine learning for automatic classification of in vivo scald and contact burn injuries using the terahertz Portable Handheld Spectral Reflection (PHASR) Scanner

Affiliations

Supervised machine learning for automatic classification of in vivo scald and contact burn injuries using the terahertz Portable Handheld Spectral Reflection (PHASR) Scanner

Mahmoud E Khani et al. Sci Rep. .

Abstract

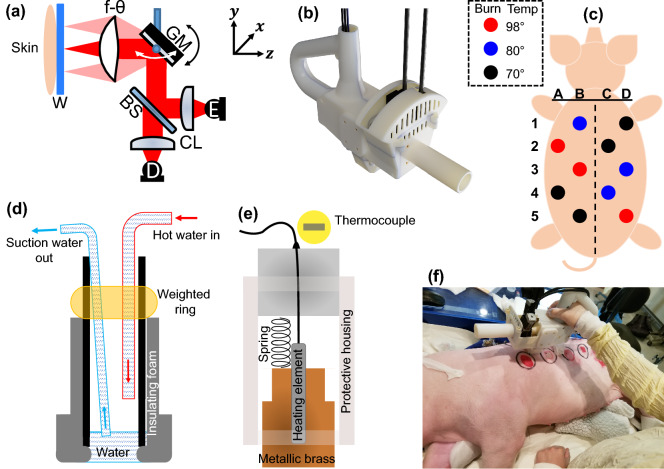
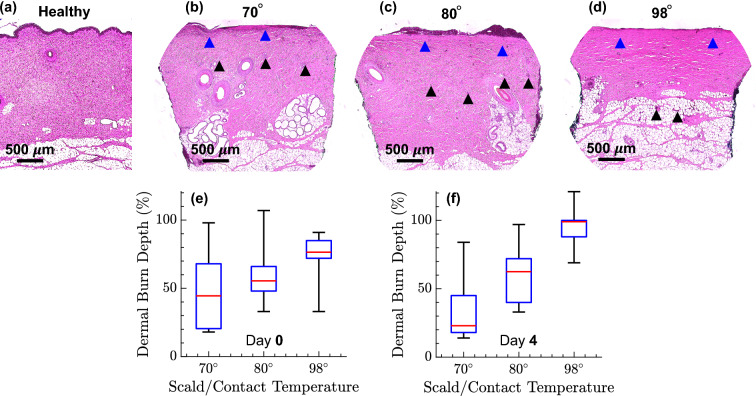
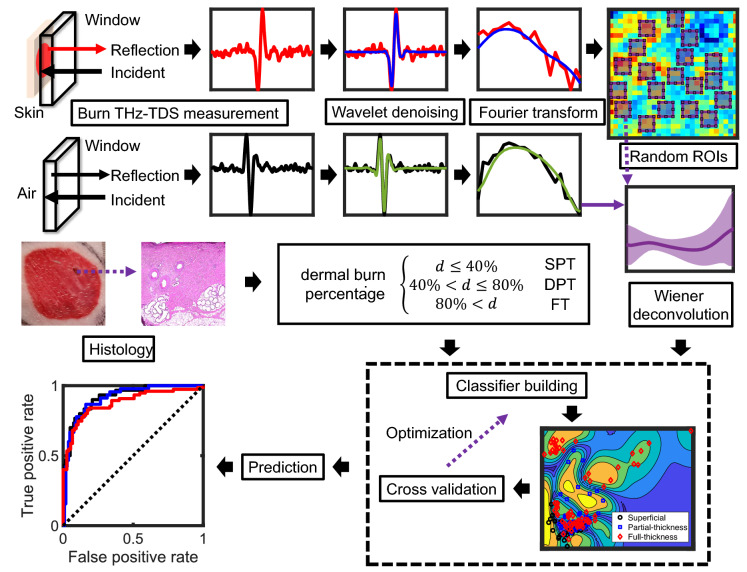
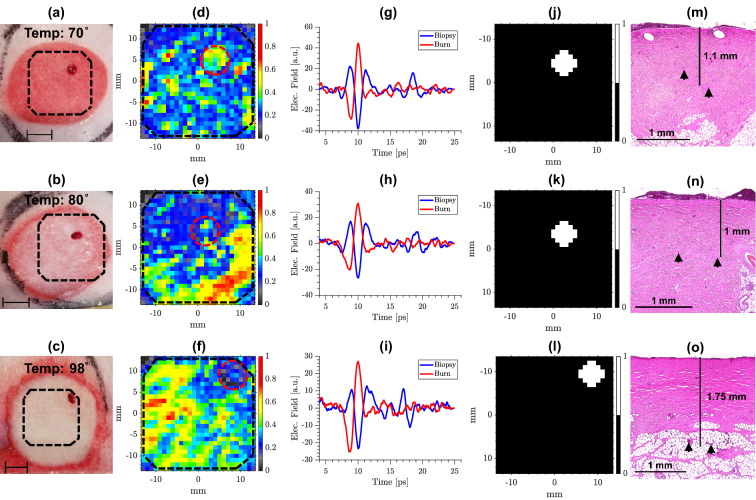
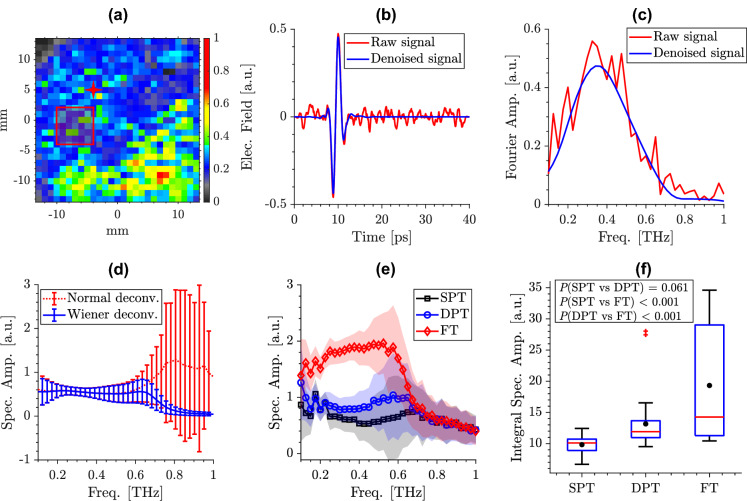
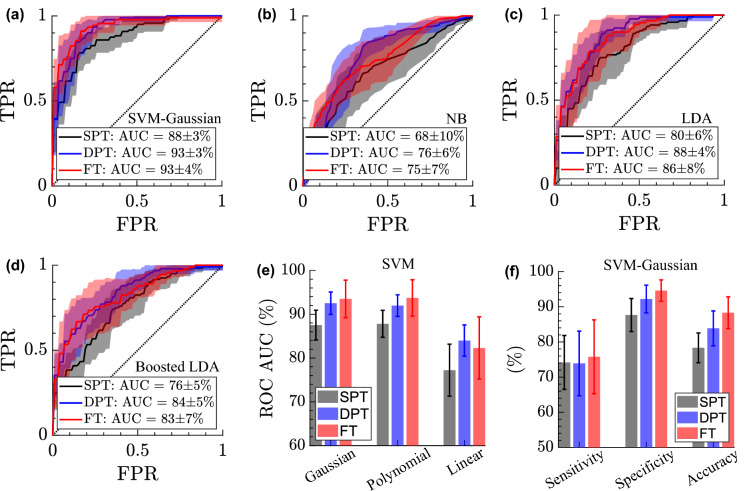
We present an automatic classification strategy for early and accurate assessment of burn injuries using terahertz (THz) time-domain spectroscopic imaging. Burn injuries of different severity grades, representing superficial partial-thickness (SPT), deep partial-thickness (DPT), and full-thickness (FT) wounds, were created by a standardized porcine scald model. THz spectroscopic imaging was performed using our new fiber-coupled Portable HAndheld Spectral Reflection Scanner, incorporating a telecentric beam steering configuration and an f-[Formula: see text] scanning lens. ASynchronous Optical Sampling in a dual-fiber-laser THz spectrometer with 100 MHz repetition rate enabled high-speed spectroscopic measurements. Given twenty-four different samples composed of ten scald and ten contact burns and four healthy samples, supervised machine learning algorithms using THz-TDS spectra achieved areas under the receiver operating characteristic curves of 0.88, 0.93, and 0.93 when differentiating between SPT, DPT, and FT burns, respectively, as determined by independent histological assessments. These results show the potential utility of our new broadband THz PHASR Scanner for early and accurate triage of burn injuries.


Conflict of interest statement

MHA discloses intellectual property owned by the University of Washington, US Patent No. US9295402B1. The rest of the authors have no conflict of interest.

Figures

Figure 1
Figure 1
(a) The optical components inside the handheld housing (W: imaging window, GM: gimbaled mirror, BS: beam splitter, CL: collimating and refocusing lenses, E: emitter PCA, D: detector PCA), the black and white arrows show the mirror movement in y and x directions, respectively, (b) the 3D-printed handheld housing (dimensions: 37.3 × 14 × 25.1 cm3), (c) the pattern of the distribution of the burn temperature on the dorsal side of the subject, (de) the side view schematics of the scald and contact devices designed for burn induction, respectively, (f) demonstration of in vivo THz spectroscopic imaging of burn injuries using the PHASR Scanner.
Figure 2
Figure 2
(ad) Microscopic images (5× magnification) of the H&E-stained biopsies from the healthy skin (control experiment) and three representative burns created using 70, 80, and 98 scald, respectively, the blue and black arrows indicate the areas of collagen denaturation and vascular occlusion, respectively, (e) the dermal burn percentage measured on the biopsies on Day 0, and (f) Day 4.
Figure 3
Figure 3
The workflow of training and testing the classifiers for diagnosing a burn injury’s severity into one of the SPT, DPT, and FT groups. After wavelet denoising and Wiener deconvolution of the measured THz pulses, an image was formed using the bandwidth-limited area under the reflection spectral amplitude curve. Fifteen 4 × 4-pixel regions of interest (ROI) were selected randomly over each image. The burn severity labels were assigned using the dermal burn percentage (d) in biopsies collected on Day 4 (SPT (d<40%), DPT (40%<d<80%), and FT (80%>d)). Each classifier’s specific hyper-parameters were optimized using Bayesian optimization during training. Additionally, to avoid over-fitting, each classifier was fivefold cross validated. The performance of various machine learning techniques (i.e., SVM, NB, LDA, and boosted LDA) was evaluated based on the area under the receiver operating characteristic (ROC) curves.
Figure 4
Figure 4
(ac) Digital images of the burns created using the scald device at 70, 80, and 98, respectively, the scale bars are 10 mm, and the dashed black lines show the field-of-view of the scanner, (df) THz images of the burns in (ac), respectively, formed using the area under the reflected spectral amplitude curves between 0.1 and 0.5 THz, the dashed red circles outline the biopsy locations, (gi) representative THz-TDS pulses measured from the burn (solid red line) and the biopsy (solid blue line) locations at each burn, (jl) determination of the pixels associated with the punch biopsies identified using the phase of the Fabry–Perot reflections in the THz-TDS pulses, (mo) microscopic images (5× magnification) of the H&E-stained biopsies of the burns shown in (ac), respectively, the vertical solid black lines show the average depth of the deepest point of injury (black triangles).
Figure 5
Figure 5
(a) A representative THz image of a burn created with 70 C scald device over a 27 by 27 mm2 field-of-view. The color axis shows the normalized area under the reflection spectral amplitude curves between 0.1 and 0.5 THz. (b) the wavelet denoising outcome in an example THz-TDS pulse selected from a pixel marked by the red star in (a), and (c) the Fourier amplitude of the signals shown in (b), (d) comparison between normal and Wiener deconvolution in a 4 × 4-pixel ROI shown using the red box in (a), where Wiener deconvolution effectively avoids the high-frequency spikes originated from an ill-posed deconvolution implementation, (e) the average spectral amplitude of reflectivity obtained after the Wiener deconvolution, along the standard deviation over the pixels of three ROIs, each selected randomly from a different burn grade example, i.e., SPT (black line, square markers), DPT (blue line, circle markers), FT (red line, diamond markers), (f) box plots comparing the area under the spectral amplitude curves in all burns (composed of thirty 4 × 4-pixel ROIs randomly selected from the burns in each group) over 0.1–0.5 THz, using a one-way ANOVA, the difference between SPT and FT groups (p < .001), and DPT and FT groups (p < .001) is statistically significant, while the p(SPT vs DPT) = 0.061.
Figure 6
Figure 6
(ad) The ROC curves obtained using the Gaussian Support Vector Machine (SVM), Naive Bayes (NB), Linear Discriminant Analysis (LDA), and AdaBoosted LDA classifiers for identification of SPT (black lines), DPT (blue lines), and FT burns (red lines), (e) comparison of the area under the ROC curves obtained using the SVM classifiers with Gaussian, polynomial (quadratic, cubic, and the fourth power), and linear kernel functions, (f) the sensitivity, specificity, and accuracy rates in classification of each burn group obtained using the Gaussian SVM, the error bars in the ROC curves and the bar plots show the standard deviation over the 10 iterations of each classifier with different random ROIs selected during each iteration.

Similar articles

Cited by

References

    1. Cairns, C., Kang, K. & Santo, L. National Hospital Ambulatory Medical Care Survey: 2018 Emergency Department Summary Tables. https://www.cdc.gov/nchs/data/nhamcs/web_tables/2018-ed-web-tables-508.pdf (2018).
    1. Mertens DM, Jenkins ME, Warden GD. Outpatient burn management. Nurs. Clin. N. Am. 1997;32:343. - PubMed
    1. Baxter CR. Management of burn wounds. Dermatol. Clin. 1993;11:709–714. - PubMed
    1. Hettiaratchy S, Papini R. Initial management of a major burn: II—Assessment and resuscitation. BMJ. 2004;329:101–103. - PMC - PubMed
    1. Papini R. Management of burn injuries of various depths. BMJ. 2004;329:158–160. - PMC - PubMed

Publication types