. 2022 Apr;24(4):565-578.
doi: 10.1038/s41556-022-00866-3. Epub 2022 Mar 24.

A single-cell atlas of non-haematopoietic cells in human lymph nodes and lymphoma reveals a landscape of stromal remodelling

Affiliations

A single-cell atlas of non-haematopoietic cells in human lymph nodes and lymphoma reveals a landscape of stromal remodelling

Yoshiaki Abe et al. Nat Cell Biol. 2022 Apr.

Abstract

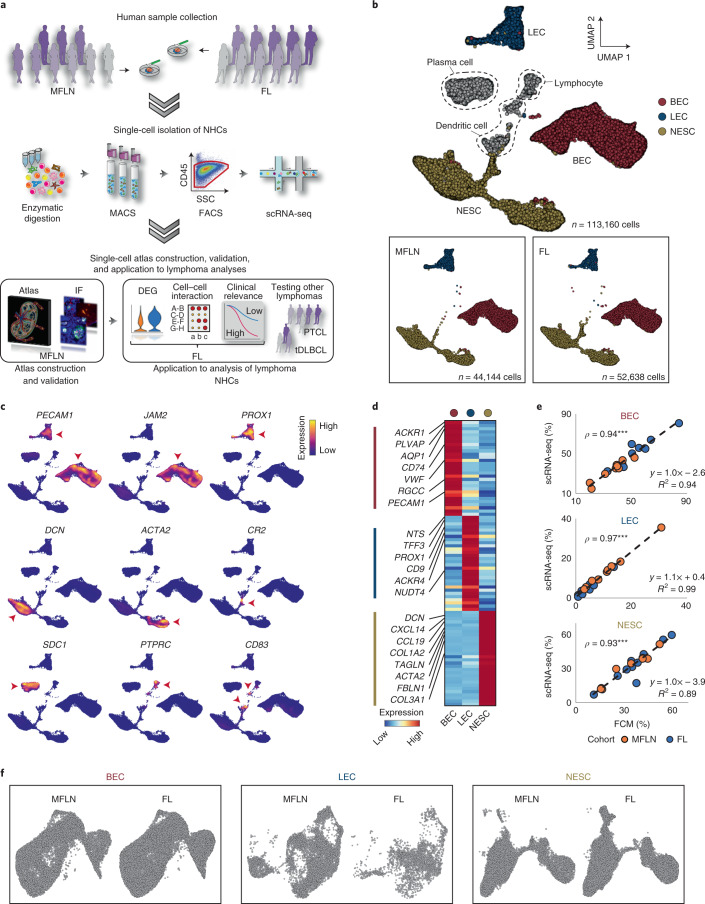
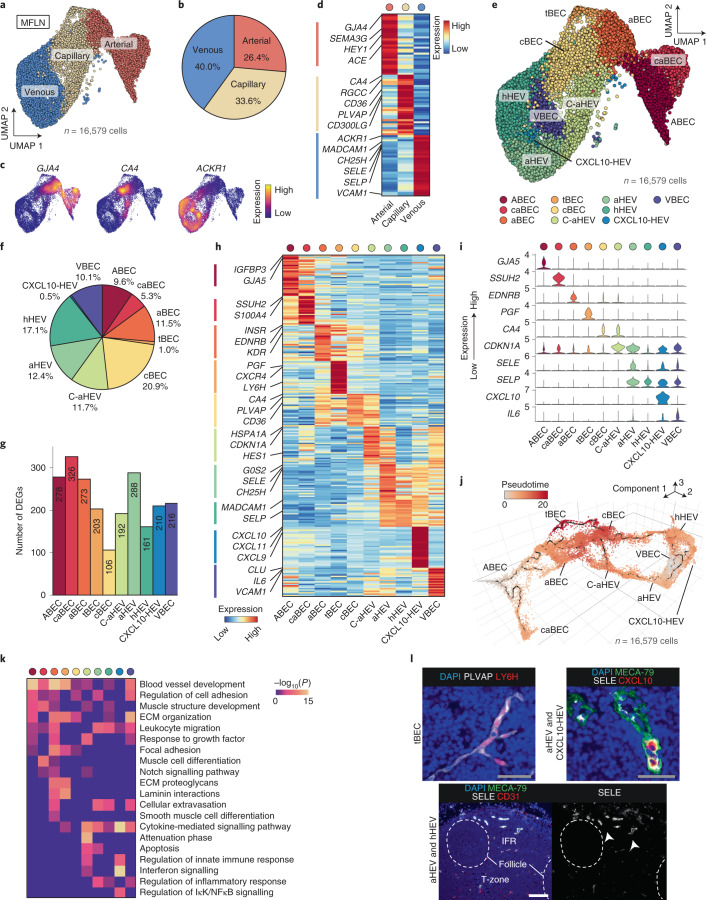
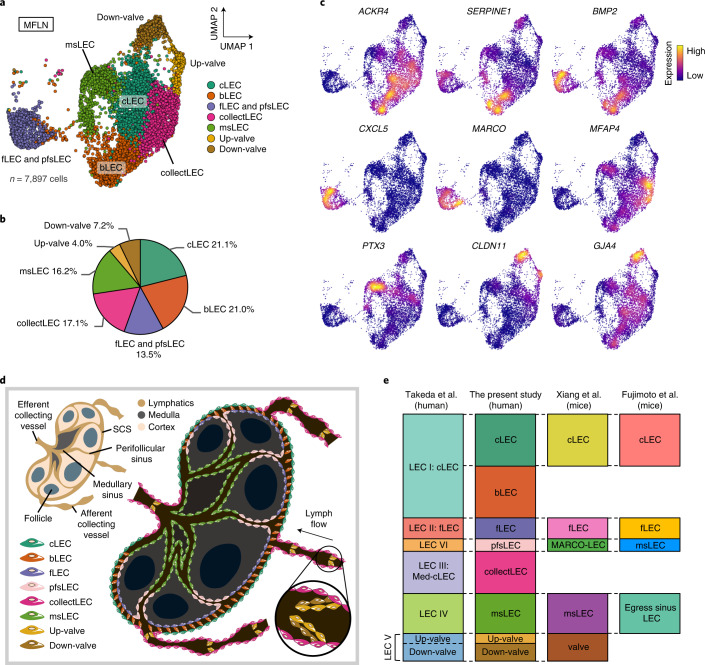
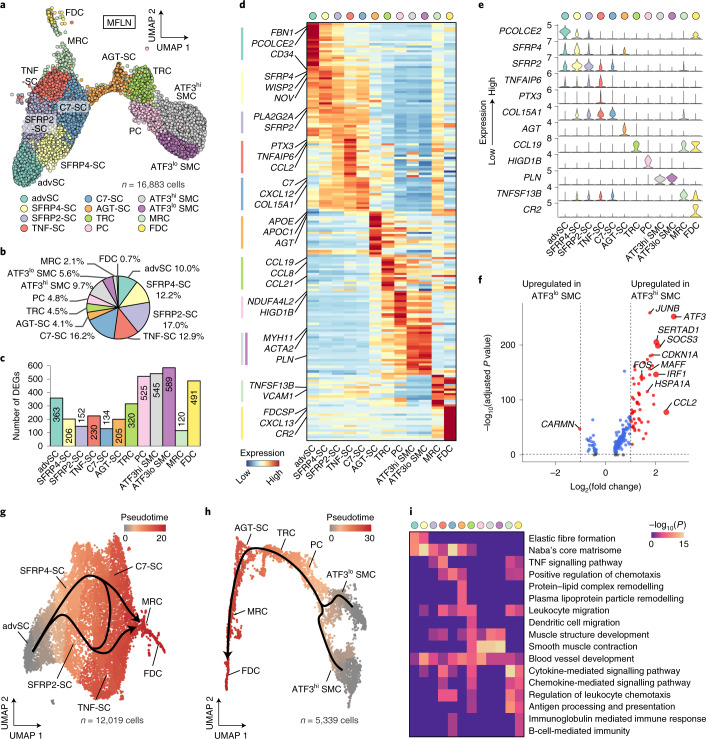
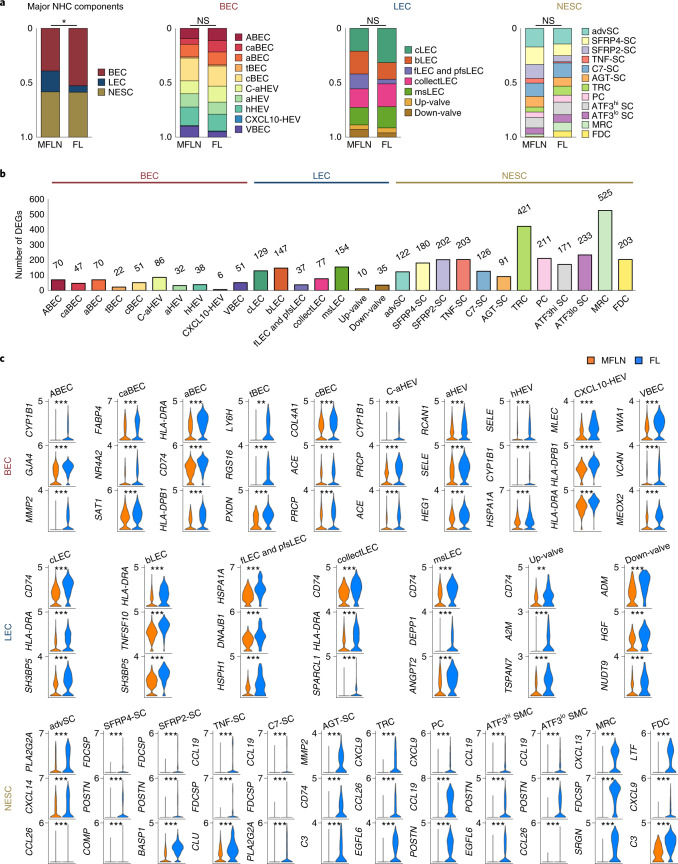
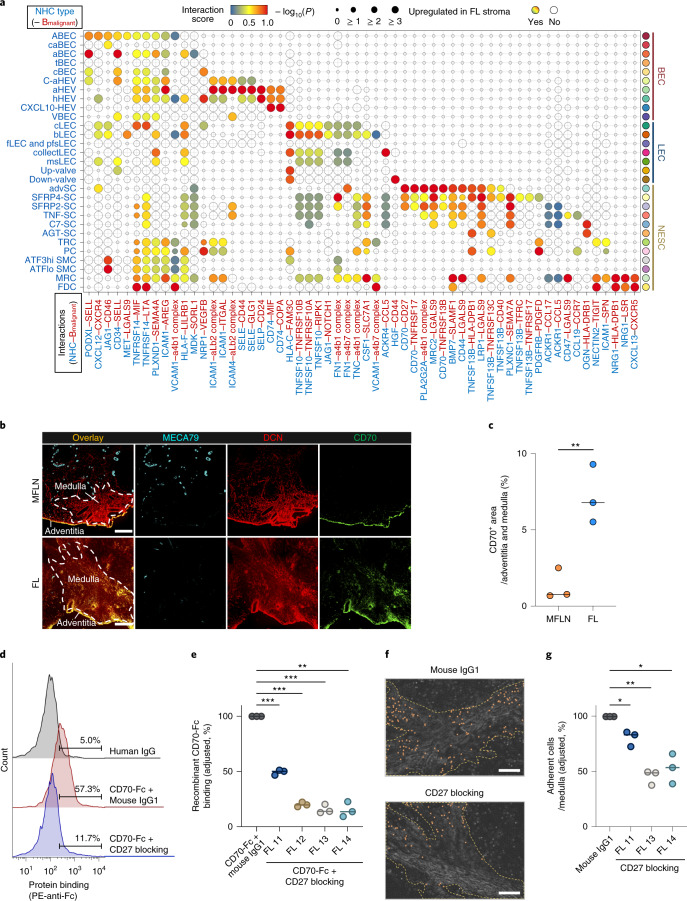
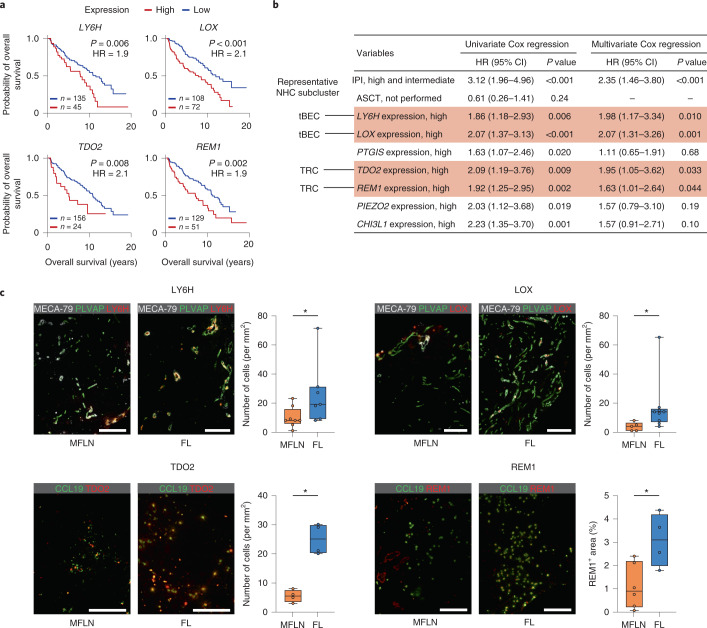
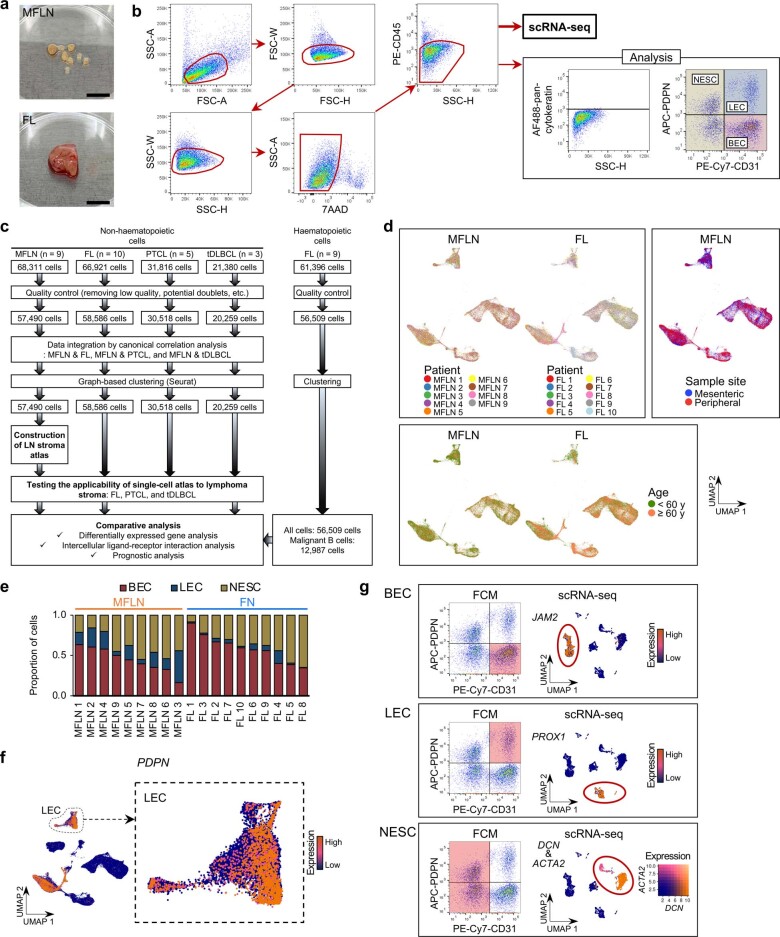
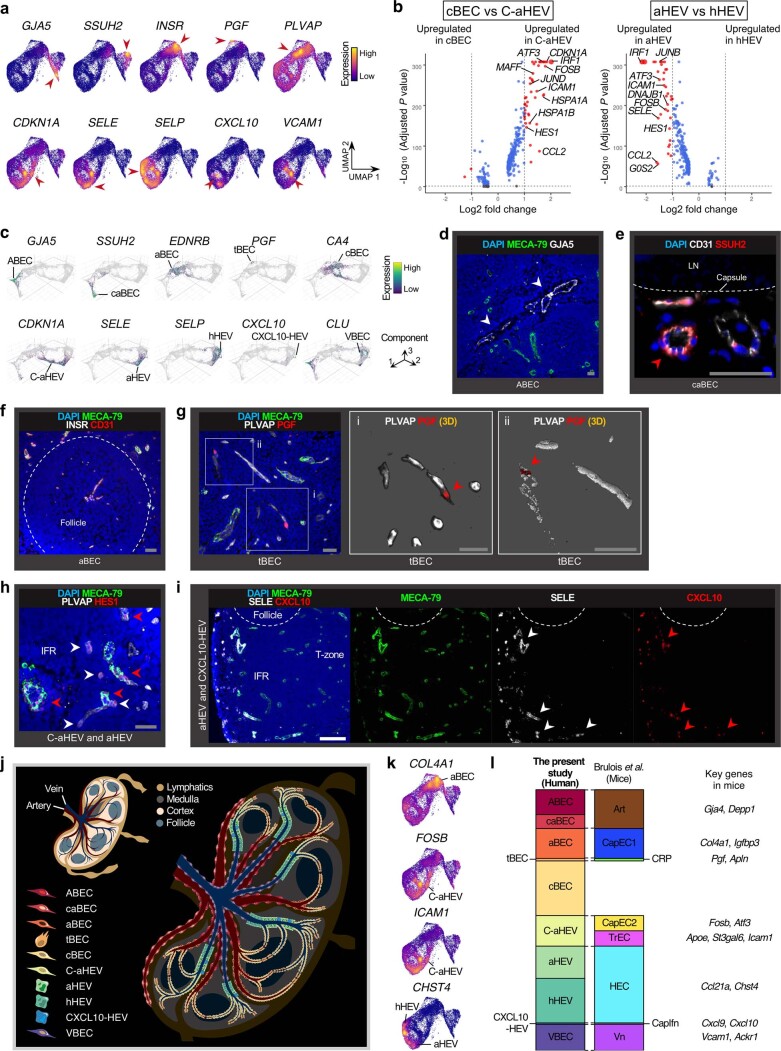
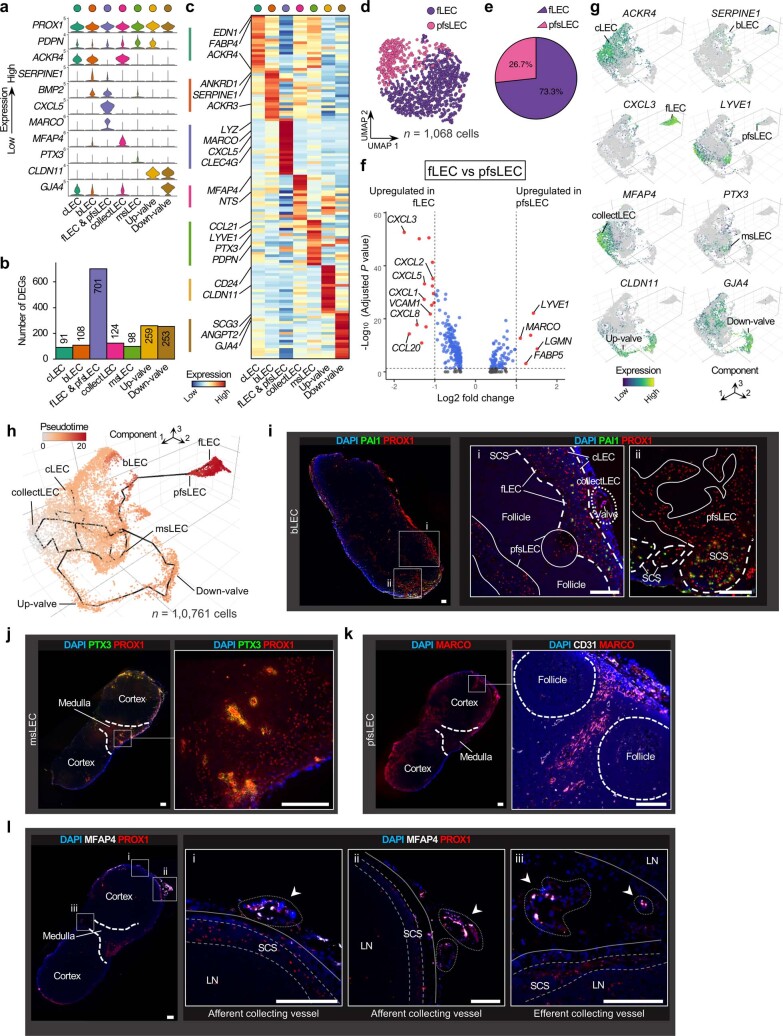
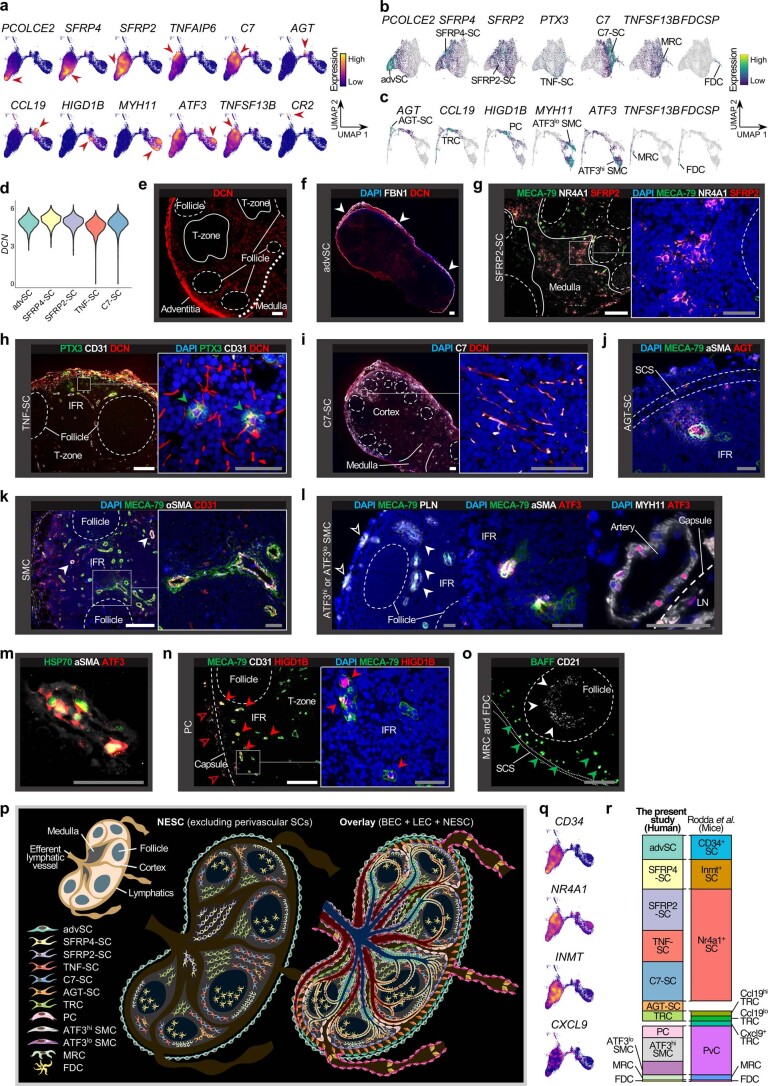
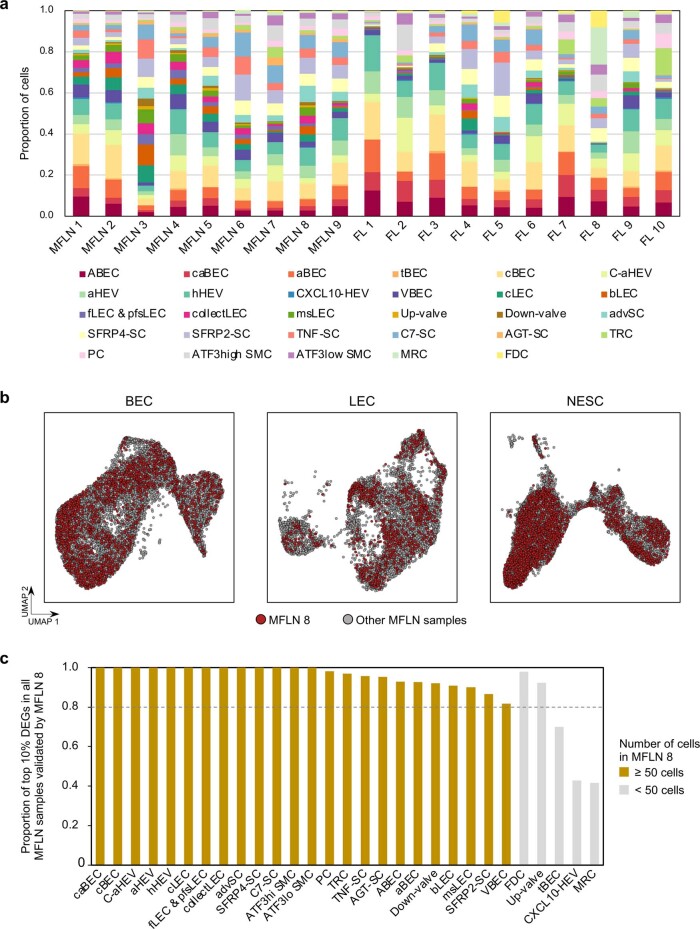
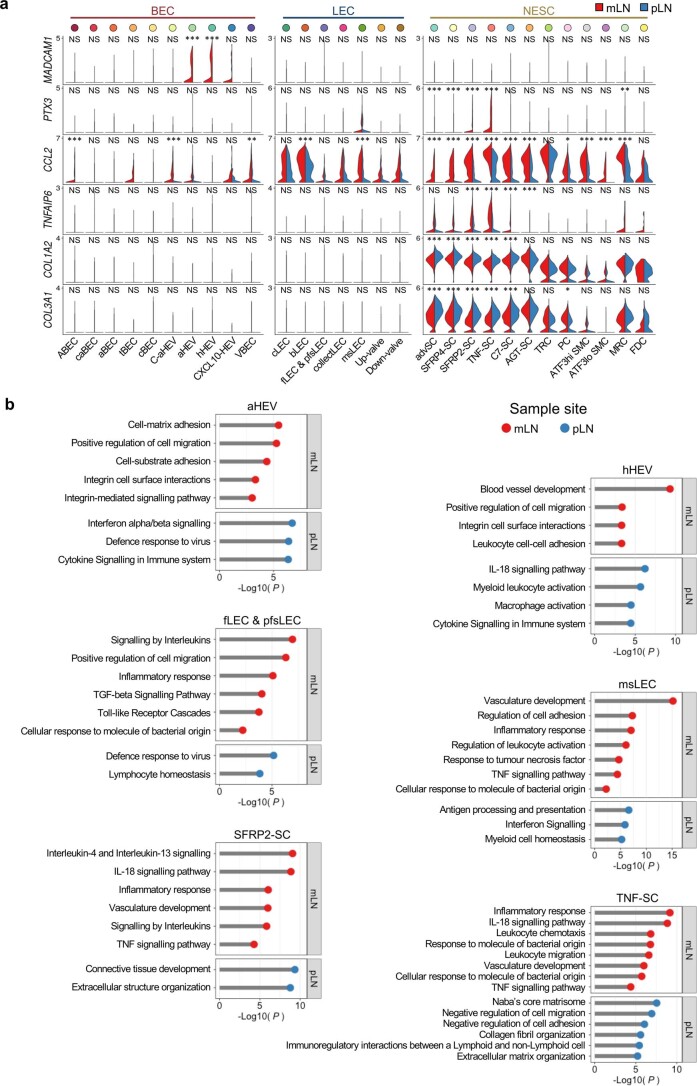
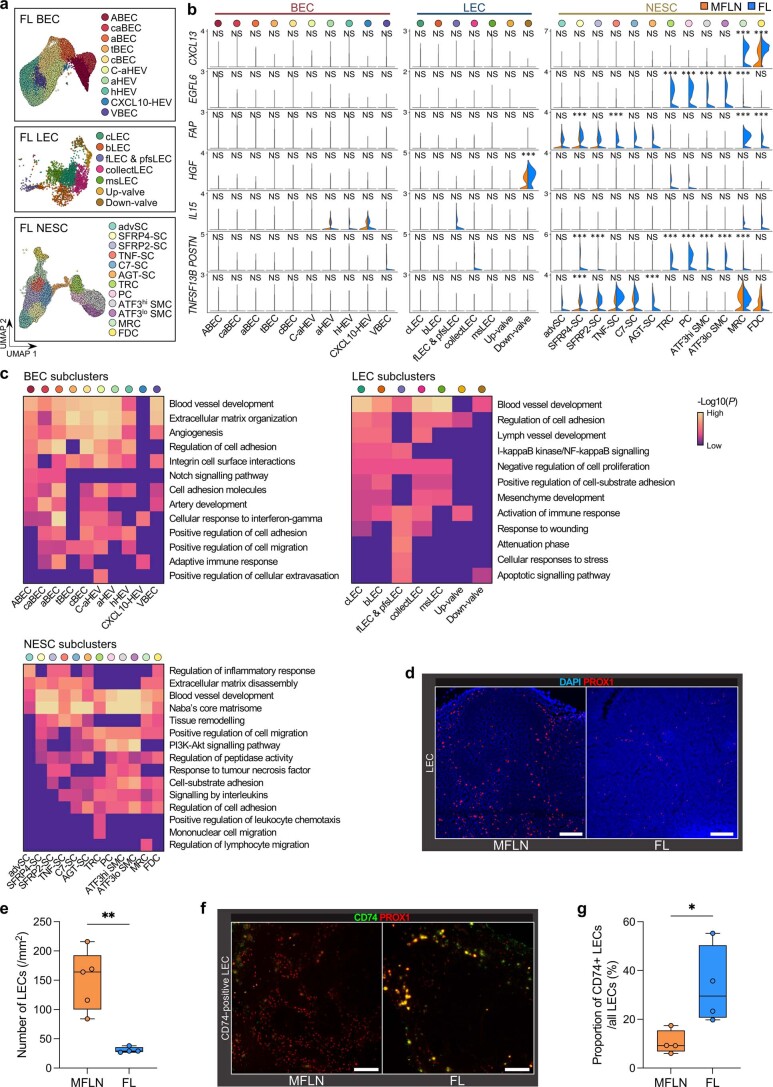
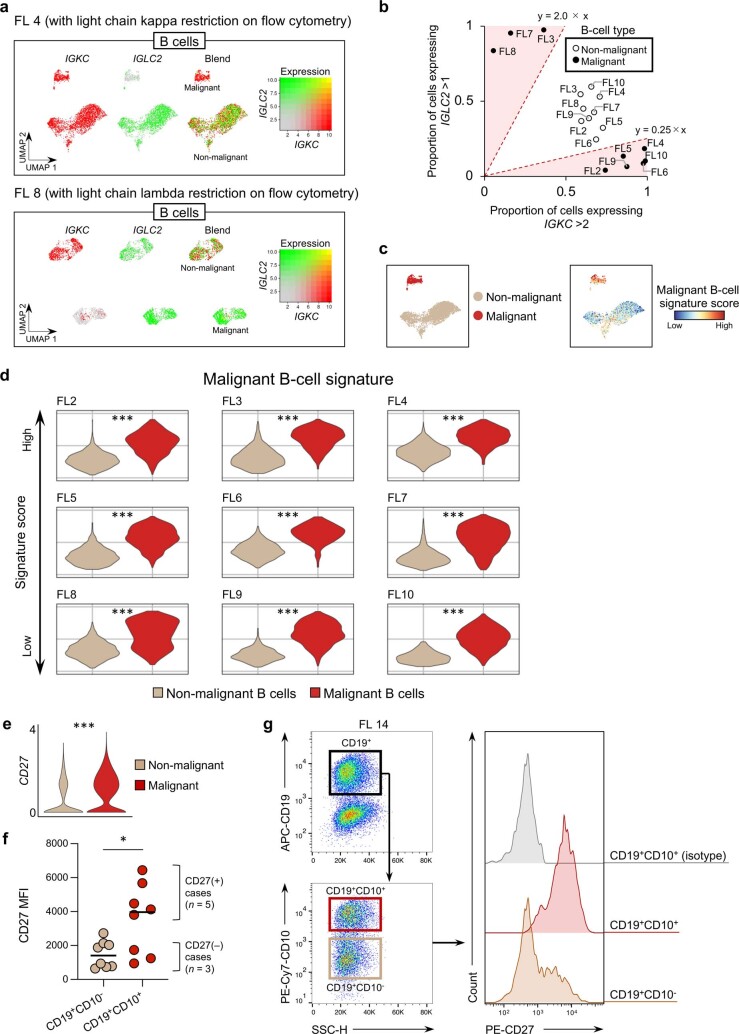
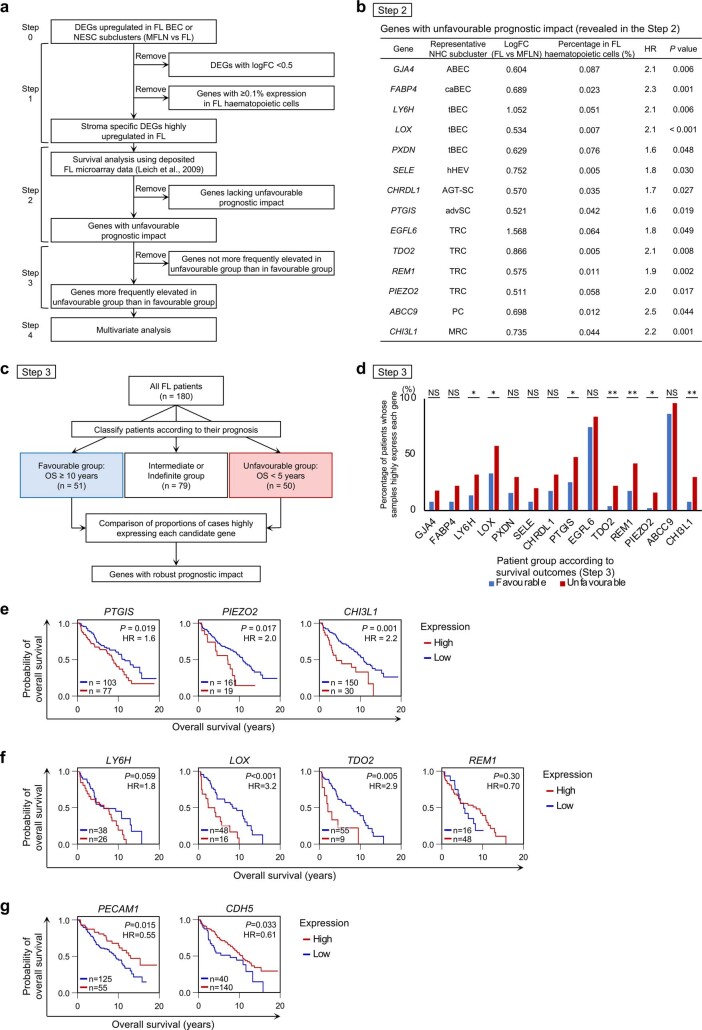
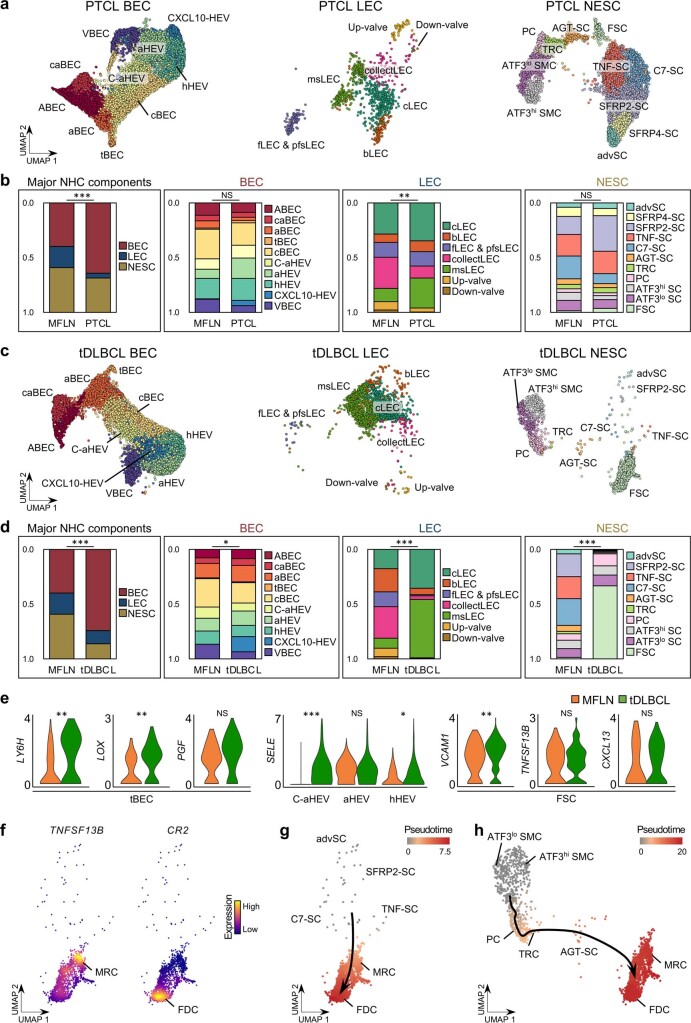
The activities of non-haematopoietic cells (NHCs), including mesenchymal stromal cells and endothelial cells, in lymphomas are reported to underlie lymphomagenesis. However, our understanding of lymphoma NHCs has been hampered by unexplained NHC heterogeneity, even in normal human lymph nodes (LNs). Here we constructed a single-cell transcriptome atlas of more than 100,000 NHCs collected from 27 human samples, including LNs and various nodal lymphomas, and it revealed 30 distinct subclusters, including some that were previously unrecognized. Notably, this atlas was useful for comparative analyses with lymphoma NHCs, which revealed an unanticipated landscape of subcluster-specific changes in gene expression and interaction with malignant cells in follicular lymphoma NHCs. This facilitates our understanding of stromal remodelling in lymphoma and highlights potential clinical biomarkers. Our study largely updates NHC taxonomy in human LNs and analysis of disease status, and provides a rich resource and deeper insights into LN and lymphoma biology to advance lymphoma management and therapy.


Conflict of interest statement

The authors declare no competing interests.

Figures

Fig. 1
Fig. 1. Single-cell survey of NHC components in LNs and FL.
a, Study overview of the experimental and analytical workflows. FACS, fluorescence-activated cell sorting; MACS, magnetic-activated cell sorting; SSC, side scatter. b, UMAP plots of stroma-enriched cells from nine human MFLN samples and ten FL samples, coloured by cell type (top). Major NHC components from MFLN samples and FL samples are shown separately (bottom left and bottom right, respectively). c, Expression levels of marker genes used to identify cell types. Red arrowheads show cells expressing the indicated marker genes. d, Heatmap showing the expression of top-ranking marker genes for each major NHC component. Key genes are indicated on the left. e, Correlation of the proportions of BECs, LECs and NESCs among stroma-enriched cells, as evaluated using flow cytometry (FCM) analysis and scRNA-seq, coloured according to patient cohort. Circles indicate biologically independent samples (n = 9 MFLN, n = 10 FL). ρ denotes Spearman’s rank correlation coefficient. ***P = 4.0 × 10−6 (BEC), ***P = 8.0 × 10−6 (LEC), ***P = 2.5 × 10−6 (NESC) (two-sided Spearman’s rank correlation test). f, UMAP plots of LN BECs, LECs and NESCs after re-clustering analysis shown according to patient cohort. Statistical source data are provided. Source data
Fig. 2
Fig. 2. A single-cell atlas of human LN BECs.
a, UMAP plot of MFLN BECs coloured according to classification of arterial, capillary and venous BECs. b, The proportions of arterial, capillary and venous BECs in MFLN samples. c, Expression levels of arterial, capillary and venous BEC marker genes. d, Heatmap showing the expression of top-ranking marker genes of arterial, capillary and venous BECs. Key genes are indicated on the left. e, UMAP plot of ten MFLN BEC subclusters identified by unsupervised clustering. f, Prevalence of each BEC subcluster in MFLN samples. g, Number of DEGs per BEC subcluster. h, Heatmap showing the expression of top-ranking marker genes for each BEC subcluster. Key genes are indicated on the left. i, Violin plots representing the expression of top marker genes for each BEC subcluster. j, Single-cell BECs ordered according to pseudotime developmental stages. Dark winding lines in the cell object indicate putative developmental trajectories. Cell regions are assigned to BEC subclusters based on subcluster-defining gene expression levels. k, GO enrichment analysis of DEGs for each BEC subcluster. l, IF staining of PLVAP (white) and LY6H (red) (top left) to identify tBECs; MECA-79 (green), SELE (white) and CXCL10 (red) (top right) to identify aHEVs and CXCL10-HEVs; and MECA-79 (green), SELE (white) and CD31 (red) (bottom) to discriminate aHEVs (arrowheads) from hHEVs. Dashed lines indicate follicles. Scale bars, 50 μm (grey) or 200 μm (white). Representative images from one of three independent experiments are shown.
Fig. 3
Fig. 3. A single-cell atlas of human LN LECs.
a, UMAP plot of MFLN LEC subclusters identified by unsupervised clustering. b, The prevalence of each LEC subcluster in MFLN samples. c, Expression levels of marker genes for each LEC subcluster. d, Schematic showing the topological localization of eight LEC subclusters in the LN. e, Comparison of subclusters identified here with those previously characterized (Takeda et al., Xiang et al. and Fujimoto et al.). Bar heights of the previous studies are adjusted to cell numbers (belonging to each subcluster) identified in this study.
Fig. 4
Fig. 4. A single-cell atlas of human LN NESCs.
a, UMAP plot of MFLN NESC subclusters identified by unsupervised clustering. b, The prevalence of each NESC subcluster in MFLN samples. c, Number of DEGs per NESC subcluster. d, Heatmap showing the expression of top-ranking marker genes for each NESC subcluster. Key genes are indicated on the left. e, Violin plots representing top marker genes for each NESC subcluster. f, Volcano plot of upregulated or downregulated genes between ATF3hi and ATF3lo SMCs. Significance was determined as an adjusted P < 0.05 (two-sided Wilcoxon rank-sum test with Bonferroni correction) (blue dots) and log2 fold-change of ≥1 (red dots). Larger dots indicate log2 fold-change of ≥2. Key genes are labelled. g,h, Pseudotime developmental stages of single cells in advSCs, SFRP4-SCs, SFRP2-SCs, TNF-SCs, C7-SCs, MRCs and FDCs (g) or in SMC subclusters, PCs, TRCs, AGT-SCs, MRCs and FDCs (h). Dark winding lines in the cell objects indicate putative developmental trajectories. Cell regions are assigned to each subcluster based on subcluster-defining gene expressions. i, GO enrichment analysis of DEGs for each NESC subcluster.
Fig. 5
Fig. 5. Compositional and transcriptional changes in FL stroma.
a, Differences between MFLN and FL NHC compositions based on major NHC components, and BEC, LEC and NESC subclusters. *P = 0.010 (two-sided Chi-squared test). NS, not significant. b, Number of DEGs upregulated in FL NHC subclusters compared to MFLN counterparts. c, Violin plots of the top three DEGs upregulated in FL NHC subclusters compared to MFLN counterparts. **P < 0.01, ***P < 0.001 (two-sided Wilcoxon rank-sum test with Bonferroni correction). Exact P values are provided in Supplementary Tables 15–17. Statistical source data are provided. Source data
Fig. 6
Fig. 6. Dissection of stroma–malignant B-cell interactions in FL.
a, Enhanced interactions across FL NHC subclusters and malignant B cells (Bmalignant). Circle size indicates the negative log10 of adjusted P values (Methods). Circles are coloured when a stroma-derived factor is upregulated in relevant FL subclusters. b, IF staining for MECA-79 (cyan), DCN (red) and CD70 (green) in MFLN and FL samples. Scale bars, 200 μm. Representative images from one of three independent experiments are shown. c, Proportions of CD70+ area in medullary and adventitia regions of MFLN (n = 3) and FL (n = 3) samples. Circles represent biologically independent samples. Bars indicate the median. **P = 0.0095 (two-sided unpaired t-test). d, Binding of FL CD19+CD10+ cells to CD70-Fc protein with an anti-CD27 blocking antibody or isotype human IgG. The histograms represent three independent experiments (FL 13) with the count in arbitrary units. e, Blocking of FL CD19+CD10+ cell binding to CD70-Fc protein after treating cells with an anti-CD27 blocking antibody (n = 3) or isotype mouse IgG1 (n = 3) in CD27+ FL samples (FL 11–FL 14). Proportions of cells bound to CD70-Fc protein were adjusted by subtracting nonspecific binding observed with human IgG. CD70-Fc protein binding to cells treated with isotype mouse IgG1 was set to 100% in each experiment. Circles represent independent experiments. Bars indicate the median. **P = 0.0022, ***P = 7.3 × 10−4 (FL 11), ***P = 2.2 × 10−4 (FL 12), ***P = 7.6 × 10−4 (FL 13) (two-sided paired t-test). f, Representative malignant B-enriched cell (FL 14) adhesion to medullary regions of FL in the presence of an isotype mouse IgG1 or anti-CD27 antibody. Orange dots indicate adherent cells. Yellow dashed lines indicate medullary regions. Scale bars, 200 μm. g, Blocking of malignant B-enriched cell (FL 11, FL 13 and FL 14) adhesion to FL medullary regions (per mm2) after treating cells with an anti-CD27 blocking antibody (n = 3) or isotype mouse IgG1 (n = 3). Adhesion of cells treated with isotype mouse IgG1 was set to 100% in each experiment. Circles represent independent experiments. Bars indicate the median. *P = 0.041 (FL 11), *P = 0.027 (FL 14), **P = 0.0050 (two-sided paired t-test). Statistical source data are provided. Source data
Fig. 7
Fig. 7. Identification of stroma-derived prognostic markers in FL.
a, Kaplan–Meier curves showing the overall survival of patients newly diagnosed with FL (n = 180) based on the expression level of LY6H, LOX, TDO2 and REM1. Statistical analysis was performed using the two-sided log-rank test. HR, hazard ratio. b, Univariate and multivariate Cox regression analyses predicting overall survival (n = 180). Statistical analysis was performed using two-sided Cox proportional-hazards analysis. Significant gene expression in multivariate analysis is indicated by text shaded in red. Representative NHC subcluster denotes subclusters in which indicated gene expression is most greatly upregulated in FL. CI, confidence interval. c, Left: images of IF staining for LY6H, LOX, TDO2 and REM1 in representative MFLN and FL samples. Scale bars, 200 μm. Right: the box plots show the interquartile range (box limits), median (centre line), minimum to maximum values (whiskers), and biologically independent samples (circles) for quantification of cell number (for LY6H, LOX and TDO2) or area (for REM1) positive for each protein in MFLN and FL samples (MFLN, n = 8, 5, 4 and 6; FL, n = 7, 9, 4 and 4 for LY6H, LOX, TDO2 and REM1, respectively). *P = 0.029 (LY6H), *P = 0.010 (LOX), *P = 0.029 (TDO2), *P = 0.038 (REM1) (two-sided Mann–Whitney U-test). Statistical source data are provided. Source data
Extended Data Fig. 1
Extended Data Fig. 1. Single-cell analysis of LN and lymphoma NHCs.
a, Macroscopy of representative human metastasis-free lymph node (MFLN) (top) and follicular lymphoma (FL) (bottom) samples. Scale bars, 1 cm. b, Gating strategy for the isolation and analysis of non-haematopoietic cells (NHCs) in human LN and lymphoma in flow cytometry (see ‘Single-cell isolation of LNNHCs’ in the Methods section). BEC, blood endothelial cell; LEC, lymphatic endothelial cell; NESC, non-endothelial stromal cell; scRNA-seq, single-cell RNA sequencing. c, Overview of scRNA-seq analysis conducted in the present study. PTCL, peripheral T-cell lymphoma; tDLBCL, diffuse large B-cell lymphoma transformed from FL. d, UMAP plots of NHCs, colour coded by patients (top left), sites of sample collection (top right), and patient age (bottom), according to patient cohorts. e, Proportion of each major NHC component between MFLN (left) and FL (right) cohorts. f, PDPN expression in stroma-enriched cells from MFLN samples. High magnification image indicates heterogeneous PDPN expression levels among LECs. g, Strategy used to detect BECs (top), LECs (middle), and NESCs (bottom) using flow cytometry (FCM, red-coloured) or scRNA-seq (red circles) analysis in a representative case (MFLN 8).
Extended Data Fig. 2
Extended Data Fig. 2. Dissection of human LN BECs at single-cell resolution.
a, Expression of marker genes for each BEC subcluster. Red arrowheads show cells expressing indicated marker genes. b, Volcano plots of up- or down-regulated genes between cBECs and C-aHEVs (left) or between aHEVs and hHEVs (right). Significance was determined as an adjusted P value of <0.05 (two-sided Wilcoxon Rank-Sum test with Bonferroni correction) (blue-coloured dots) and log2 fold-change of ≥1 (red-coloured dots). Larger dots indicate log2 fold-change of ≥2. Key genes are labelled. c, Expression of marker genes for each BEC subcluster in a single-cell BEC object, generated by Monocle 3. d–i, IF staining of MECA-79 (green) and GJA5 (white) shows large arterial BECs (ABECs) (d, white arrowheads); CD31 (white) and SSUH2 (red) identify arteries surrounding LN capsule (caBECs) (e, red arrowhead); MECA-79 (green), INSR (white), and CD31 (red) identify arterioles (aBECs) (f); MECA-79 (green), PLVAP (white), and PGF (red). High magnification images (i and ii) are presented in 3D identifying tip cells (tBECs) (g, red arrowhead); MECA-79 (green), PLVAP (white), and HES1 (red) show activated HEVs (aHEVs) (red arrowheads) and transitional BECs between capillary BECs and aHEVs (C-aHEVs) (white arrowheads) (h); MECA-79 (green), SELE (white), and CXCL10 (red) to identify aHEVs and CXCL10-HEVs. Arrowheads show cells positive for indicated proteins (i). IFR, interfollicular region. Scale bars, 50 μm (grey), 200 μm (white). Representative images from one of three independent experiments are shown. i, LN schematic depicting topological localization of 10 BEC subclusters. j, Expression of marker genes for key mouse LN BEC subclusters (proposed by Brulois et al) in our human data. k, Comparison of BEC subclusters identified here with those characterized in mice. Bar heights of the mouse study are adjusted to the cell numbers (belonging to each subcluster) identified in this study. Key markers for mouse BEC subclusters are listed on right.
Extended Data Fig. 3
Extended Data Fig. 3. Dissection of human LN LECs at single-cell resolution.
a, Violin plots showing expression of top marker genes for each LEC subcluster. b, Number of DEGs per LEC subcluster. c, Heatmap showing expression of top-ranking marker genes for each LEC subcluster. Key genes are indicated on the left. d, UMAP plot of fLECs and pfsLECs discriminated by unsupervised sub-clustering of a single ‘fLEC and pfsLEC’ subcluster. e, Composition of fLECs and pfsLECs in the ‘fLEC and pfsLEC’ subcluster. f, Volcano plot of up- or down-regulated genes in fLECs and pfsLECs. Significance was determined as an adjusted P value of <0.05 (two-sided Wilcoxon Rank-Sum test with Bonferroni correction) (blue-coloured dots) and log2 fold-change of ≥1 (red-coloured dots). Key genes are labelled. g, Expression of marker genes for each LEC subcluster in a single-cell LEC object, generated by Monocle 3. h, Single-cell LECs, ordered according to pseudo-time developmental stages. Dark winding lines indicate putative developmental trajectories. Cell regions are assigned to LEC subclusters based on marker gene expression. i–l, IF staining of PAI1 (green) and PROX1 (red) to identify bridge LECs (bLECs). Bold dashed lines in magnified images (i and ii) indicate subcapsular sinuses (SCSs). Solid lines indicate perifollicular sinuses. Scale bars, 500 μm (left panel), 200 μm (magnification panels) (i); PTX3 (green) and PROX1 (red) to identify medullary sinus LECs (msLECs). Dashed lines indicate boundaries between the LN cortex and medullary regions. High magnification image at right corresponds to boxed area at left. Scale bars, 200 μm (j); MARCO (red) for identification of perifollicular sinus LECs (pfsLECs). High magnification image at right shows staining of CD31 (white) and MARCO (red). Dashed lines indicate boundaries between the LN cortex and medullary regions (left) or follicles (right). Scale bars, 200 μm (k); MFAP4 (white) and PROX1 (red) to identify collecting vessel LECs (arrowheads). High magnification images show afferent (i and ii) or efferent (iii) collecting vessels. Bold dashed lines in left panel indicate boundaries between the LN cortex and medullary regions. Scale bars, 200 μm (l). Representative images from one of three independent experiments are shown.
Extended Data Fig. 4
Extended Data Fig. 4. Dissection of human LN NESCs at single-cell resolution.
a, Expression of marker genes for each NESC subcluster. Red arrowheads show cells expressing indicated marker genes. b,c, Marker gene expressions in a NESC object shown in Fig. 4g (b) or Fig. 4h (c). d, DCN expression in MFLN advSCs, SFRP4-SCs, SFRP2-SCs, TNF-SCs, and C7-SCs. e–o, IF staining of DCN showing DCN-positive fibroblasts (e); FBN1 (white) and DCN (red) to identify SCs in the capsule adventitia (advSC) (arrowheads) (f); MECA-79 (green), NR4A1 (a marker of LN fibroblastic reticular cells; white), and SFRP2 (red) to identify SFRP2-SCs (g); PTX3 (green), CD31 (white), and DCN (red) to identify TNF-SCs (green arrowheads) (h); C7 (white) and DCN (red) to identify C7-SCs (i); MECA-79 (green), α-smooth muscle actin (αSMA, white), and AGT (red) to identify AGT-SCs (j); MECA-79 (green), αSMA (white), and CD31 (red) to identify SMCs. White arrowheads indicate SMCs around arteries (k); MECA-79 (green) and PLN (white) identifying SMCs around HEVs (filled arrowheads) and arteries (empty arrowheads) (left); MECA-79 (green), αSMA (white), and ATF3 (red) identifying ATF3hi SMCs around HEVs (middle); and MYH11 (white) and ATF3 (red) showing ATF3hi and ATF3lo SMCs around arteries (l); HSP70 (green), αSMA (white), and ATF3 (red) on SMCs (m); MECA-79 (green), CD31 (white), and HIGD1B (red) identifying PCs around arteries (empty arrowheads) and HEVs (filled arrowheads) (n); BAFF (green) and CD21 (white) identifying MRCs (green arrowheads) and FDCs (white arrowheads), respectively (o). IFR, interfollicular region; LN, lymph node; SCS, subcapsular sinus. Scale bars, 50 μm (grey),200 μm (white). Representative images from one of three independent experiments are shown. p, LN schematic depicting NESC subclusters excluding perivascular SCs (left) and an overlay image of all BEC, LEC, and NESC subclusters (right). q, Expression of marker genes for key mouse LN NESC subclusters in our human data. r, Comparison of NESC subclusters identified here with those characterized in mice.
Extended Data Fig. 5
Extended Data Fig. 5. Overview of LNNHC atlas.
a, Proportion of each NHC subcluster based on patients in the MFLN and FL cohorts. b, UMAP plot of major NHC components from MFLN samples, highlighting NHCs from a patient with a benign tumour (MFLN 8) (red dots). c, Proportions of top DEGs detected using all MFLN data and validated by DEGs in MFLN 8 according to NHC subclusters. Top DEGs were defined as the top 10% of DEGs of each NHC subcluster, calculated using all MFLN data (listed in Supplementary Table 3,8,10). Bars of subclusters with >50 cells in MFLN 8 were highlighted by ochre colouring. Dashed line indicates 80% validation.
Extended Data Fig. 6
Extended Data Fig. 6. Comparative analyses between mesenteric and peripheral LNs.
a, Violin plots comparing expressions of key genes between mLN (red) and pLN (blue) samples according to NHC subclusters. *P < 0.05, **P < 0.01, ***P < 0.001 (two-sided Wilcoxon Rank-Sum test with Bonferroni correction). NS, not significant. The exact P values are provided in Supplementary Table 13. b, Key gene ontologies of DEGs upregulated in mLN (red) or pLN (blue) compared with the other LN type according to representative NHC subclusters.
Extended Data Fig. 7
Extended Data Fig. 7. Alterations of gene expression profiles in FL stroma.
a, UMAP plots of FL BEC (top), LEC (middle), and NESC (bottom) subclusters. b, Violin plots comparing expressions of key genes between MFLN (orange) and FL (blue) samples, according to NHC subclusters. ***P < 0.001 (two-sided Wilcoxon Rank-Sum test with Bonferroni correction). NS, not significant. The exact P values are provided in Supplementary Table 15–17. c, Gene ontology changes in FL NHC subclusters. GO enrichment analysis of DEGs upregulated in FL BEC (top left), LEC (top right), or NESC (bottom left) subclusters relative to MFLN counterpart subclusters. d, IF staining of PROX1 (red) showing LEC distribution in representative MFLN (left) and FL (right) samples. Scale bars, 200 μm. e, Number of PROX1-positive LECs per mm2, detected by IF staining in biologically independent MFLN (n = 5) and FL (n = 4) samples. The box plots show the interquartile range (box limits), median (centre line), minimum to max values (whiskers), and samples (circles). **P = 0.0025 (two-sided unpaired t-test). f, IF staining of CD74 (green) and PROX1 (red) showing CD74-positive LECs in representative MFLN (left) and FL (right) samples. Scale bars, 200 μm. g, Proportions of CD74-positive LECs among PROX1-positive LECs (%) detected by IF staining in biologically independent MFLN (n = 4) and FL (n = 4) samples. The box plots show the interquartile range (box limits), median (centre line), minimum to max values (whiskers), and samples (circles). *P = 0.033 (two-sided unpaired t-test). The statistical source data are provided. Source data
Extended Data Fig. 8
Extended Data Fig. 8. Interactome analysis across FL stroma and malignant B cells.
a, Strategies used to identify malignant B-cell components in FL samples in silico. Shown are representative cases with light chain kappa (FL 4; top) or lambda (FL 8; bottom) restrictions confirmed by flow cytometry analysis (data not shown). After identifying B-cell components by detecting CD79A expression, we assessed expression of IGKC (for light chain kappa) and IGLC2 (for light chain lambda). Clusters with cells expressing IGKC and those expressing IGLC2 were considered non-malignant B cells, while clusters with cells expressing only one of these genes were considered malignant B cells. b, Scatter plot showing clear discrimination of malignant (filled circles) from non-malignant (empty circles) B-cell clusters in each FL sample, based on the ratio of cells expressing IGLC2 (expression level >1; y-axis) to those expressing IGKC (expression level >2; x-axis,). Red-shaded areas indicate regions in which the ratio was >2.0 or <0.25. c, Representative UMAP plots showing B cells from FL 4 according to B-cell types (beige; non-malignant, red; malignant) (left panel) or malignant B-cell signature score (right panel). d, Violin plots showing malignant B-cell signature score in extracted non-malignant and malignant B cells, according to different FL samples (FL 2–10). ***P = 1.1 × 10−204 (FL 2), ***P = 0 (FL 3), ***P = 3.3 × 10−176 (FL 4), ***P = 0 (FL 5), ***P = 4.2 × 10−122 (FL 6), ***P = 0 (FL 7), ***P = 4.2 × 10−161 (FL 8), ***P = 3.7 × 10−256 (FL 9), ***P = 2.5 × 10−81 (FL 10) (two-sided Wilcoxon Rank-Sum test with Bonferroni correction). e, Violin plots showing the expression of CD27 in non-malignant and malignant B cells. ***P = 0 (two-sided Wilcoxon Rank-Sum test with Bonferroni correction). f, Comparison of CD27 mean fluorescence intensity (MFI) between FL CD19+CD10 (non-malignant B-cell fraction) and CD19+CD10+ (malignant B-cell fraction) cells. Circles represent biologically independent samples (n = 8; FL 11–18). *P = 0.039 (two-sided Wilcoxon matched-pairs signed rank test). g, Flow cytometry analysis of CD27 expression on CD19+CD10 and CD19+CD10+ cells of a representative FL sample (FL 14). The statistical source data are provided. Source data
Extended Data Fig. 9
Extended Data Fig. 9. Exploring stroma-derived prognostic markers in FL.
a, Scheme of stepwise survival analysis using public data from FL patients to identify stroma-derived prognostic markers. b, Genes with unfavourable prognostic impact, as revealed by survival analysis using Kaplan–Meier methods with the two-sided log-rank test (Step 2). Representative NHC subcluster denotes subclusters in which indicated gene expression is most greatly upregulated. FC, fold-change; HR, hazard ratio. c, Strategies used to confirm prognostic impact of candidate genes identified in Step 2 (Step 3). OS, overall survival. d, Results of analysis performed in Step 3. Shown is the proportion of patients whose samples highly expressed indicated genes in favourable or unfavourable prognostic groups. *P = 0.034 (LY6H), *P = 0.017 (LOX), *P = 0.024 (PTGIS), *P = 0.014 (PIEZO2), *P = 0.027 (CHI3L1), **P = 0.0077 (TDO2), **P = 0.0092 (REM1) (two-sided Fisher’s exact test). NS, not significant. e, Kaplan–Meier curves showing overall survival of newly diagnosed FL patients (n = 180) based on expression of PTGIS, PIEZO2, and CHI3L1. Statistical analysis was performed using the two-sided log-rank test. f, Estimation of overall survival based on expression of LY6H, LOX, TDO2, and REM1 in the FL patients of the intermediate prognosis group (n = 64, two-sided log-rank test). g, Estimation of overall survival based on expression of PECAM1 and CDH5 (n = 180, two-sided log-rank test). The statistical source data are provided. Source data
Extended Data Fig. 10
Extended Data Fig. 10. Applicability of the LNNHC atlas to PTCL and tDLBCL stroma.
a, UMAP plots of PTCL BEC (left), LEC (middle), and NESC (right) subclusters. b, Compositional differences between PTCL and MFLN NHCs based on major NHC components, BEC subclusters, LEC subclusters, and NESC subclusters (from left to right). **P = 0.0076, ***P = 2.7 × 10−4 (two-sided chi-squared test). NS, not significant. c, UMAP plots of tDLBCL BEC (left), LEC (middle), and NESC (right) subclusters. d, Compositional differences between tDLBCL and MFLN NHCs based on major NHC components, BEC subclusters, LEC subclusters, and NESC subclusters (from left to right). *P = 0.030, ***P = 3.4 × 10−6 (Major NHC components), ***P = 6.3 × 10−16 (LEC), ***P = 1.1 × 10−23 (NESC) (two-sided chi-squared test). e, Violin plots comparing expressions of key genes between MFLN (orange) and tDLBCL (green) samples according to selected NHC subclusters. *P = 0.015, **P = 0.0039 (LY6H), **P = 0.0090 (LOX), **P = 0.0075 (VCAM1), ***P = 8.0 × 10−111 (two-sided Wilcoxon Rank-Sum test with Bonferroni correction). NS, not significant. f, Expression of TNFSF13B (left) and CR2 (right) in tDLBCL follicular stromal cells identifying MRCs and FDCs, respectively. g,h, Pseudo-time developmental stages in tDLBCL advSCs, SFRP2-SCs, TNF-SCs, C7-SCs, MRCs, and FDCs (g) or in tDLBCL SMC subclusters, PCs, TRCs, AGT-SCs, MRCs, and FDCs (h). Dark winding lines in the cell objects indicate putative developmental trajectories. The statistical source data are provided. Source data

References

    1. Swerdlow, S. et al. WHO Classification of Tumours of Haematopoietic and Lymphoid Tissues 4th edn (WHO Press, 2017).
    1. Scott DW, Gascoyne RD. The tumour microenvironment in B cell lymphomas. Nat. Rev. Cancer. 2014;14:517–534. doi: 10.1038/nrc3774. - DOI - PubMed
    1. Höpken UE, Rehm A. Targeting the tumor microenvironment of leukemia and lymphoma. Trends Cancer. 2019;5:351–364. doi: 10.1016/j.trecan.2019.05.001. - DOI - PubMed
    1. De Palma M, Biziato D, Petrova TV. Microenvironmental regulation of tumour angiogenesis. Nat. Rev. Cancer. 2017;17:457–474. doi: 10.1038/nrc.2017.51. - DOI - PubMed
    1. Sahai E, et al. A framework for advancing our understanding of cancer-associated fibroblasts. Nat. Rev. Cancer. 2020;20:174–186. doi: 10.1038/s41568-019-0238-1. - DOI - PMC - PubMed

Publication types