. 2022 May;605(7910):551-560.
doi: 10.1038/s41586-022-04654-9. Epub 2022 Mar 24.

Design of protein-binding proteins from the target structure alone

Affiliations

Design of protein-binding proteins from the target structure alone

Longxing Cao et al. Nature. 2022 May.

Abstract

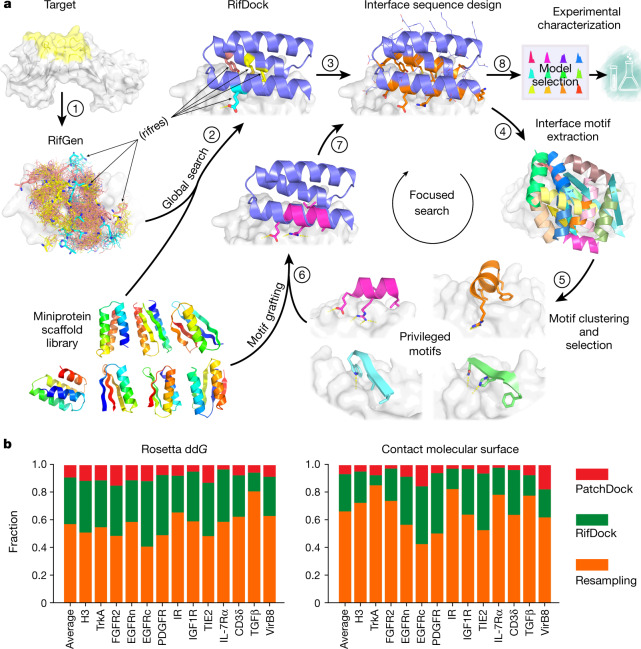
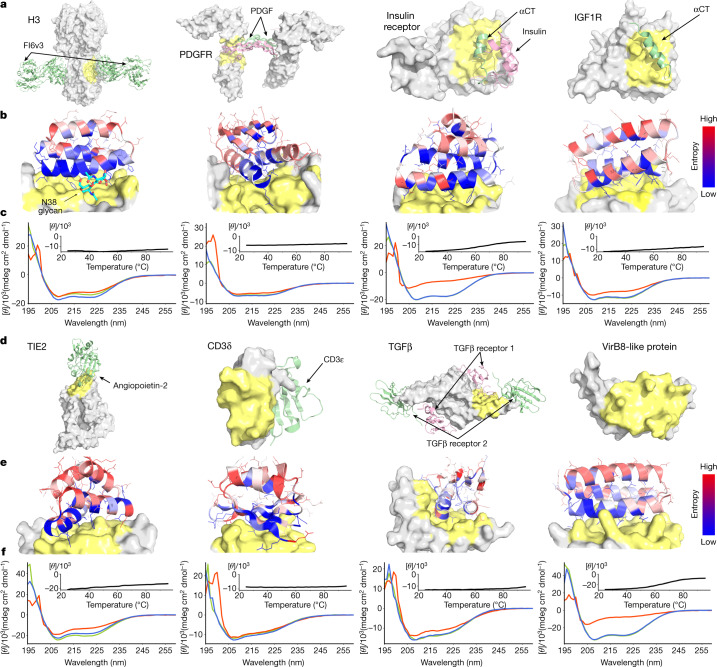
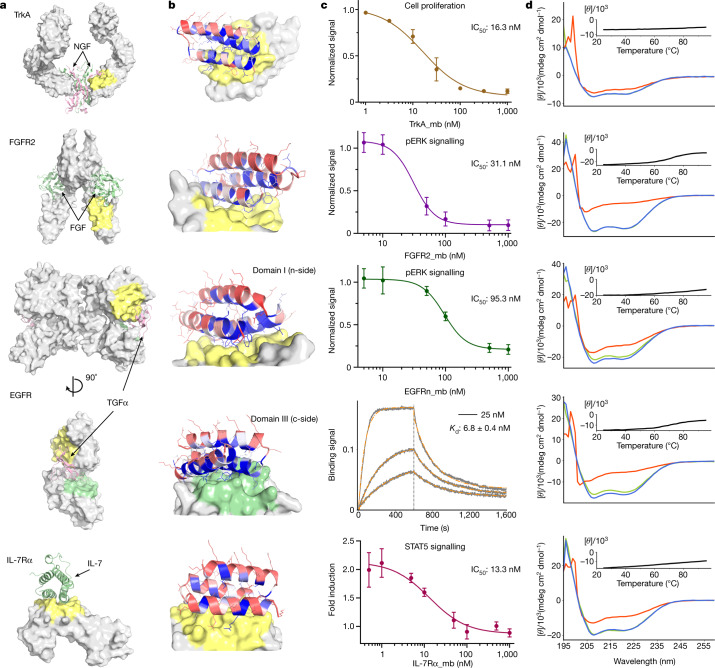
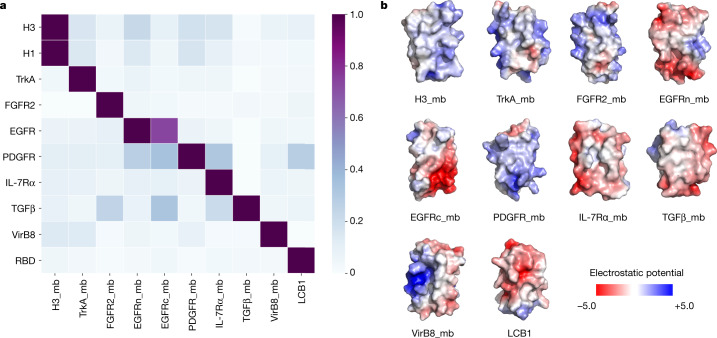
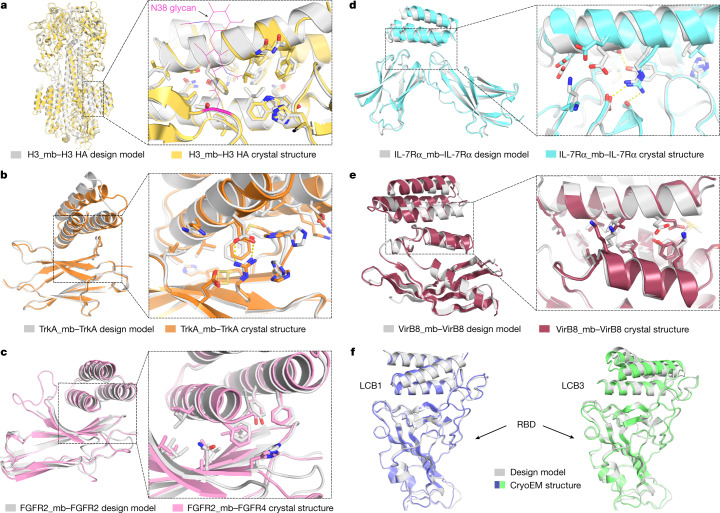
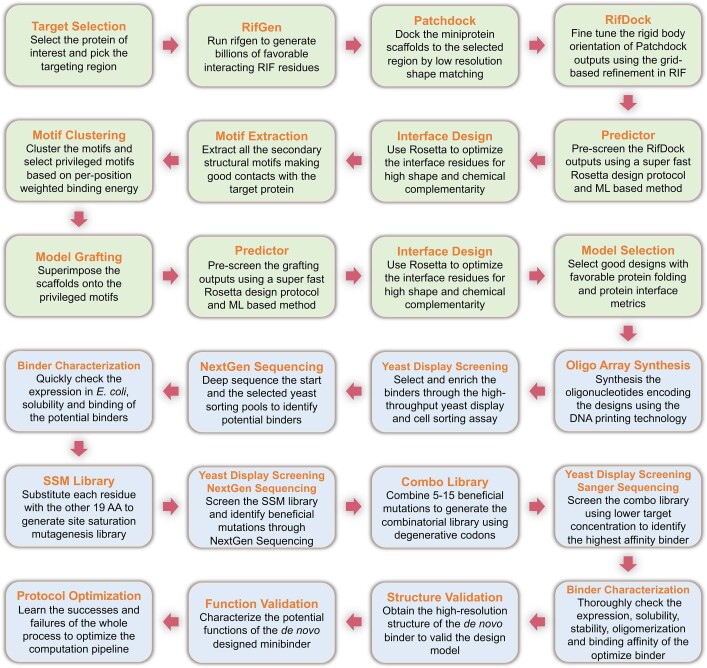
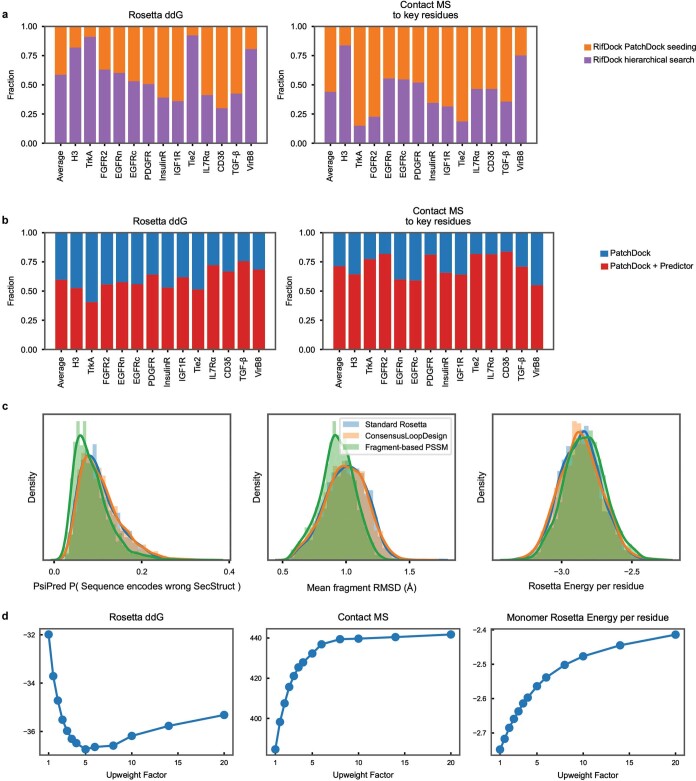
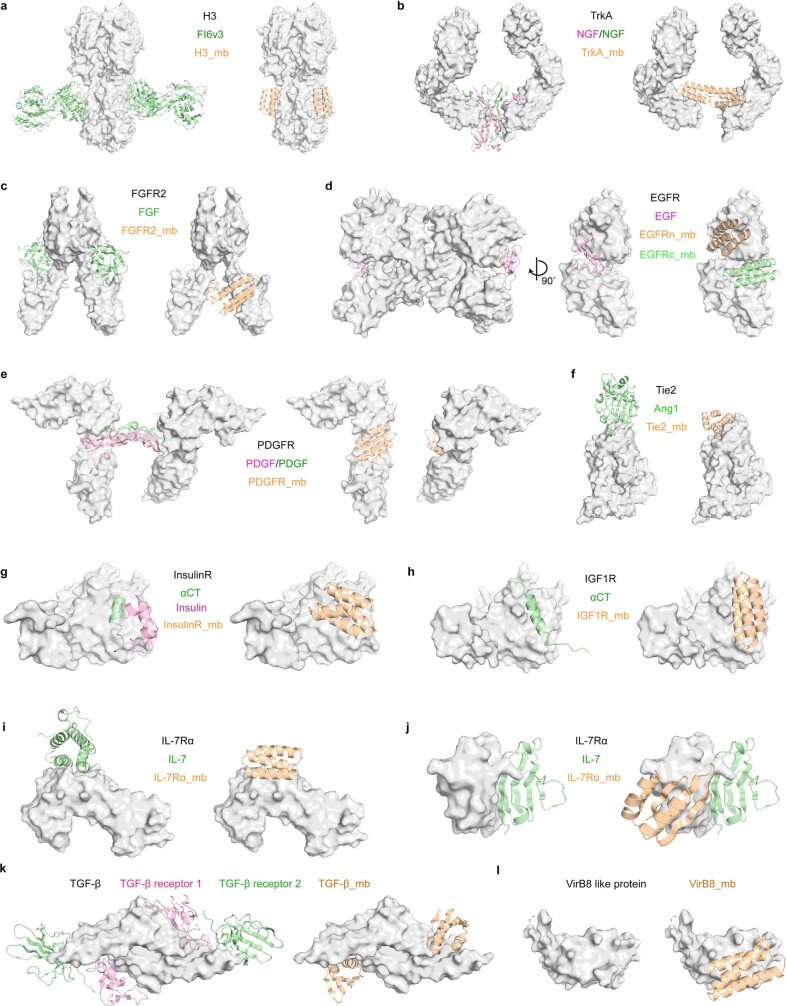
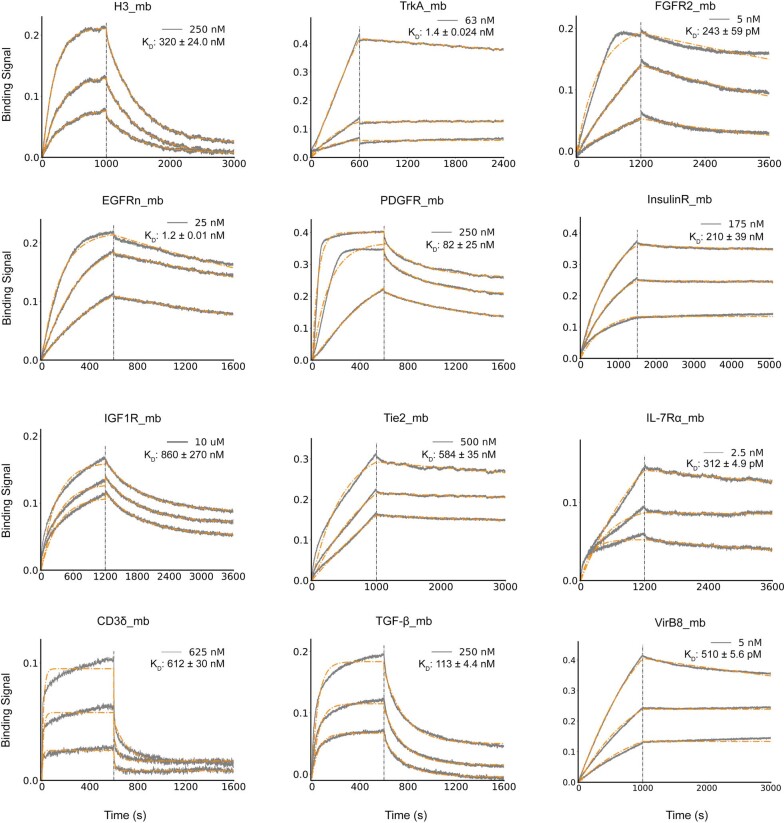
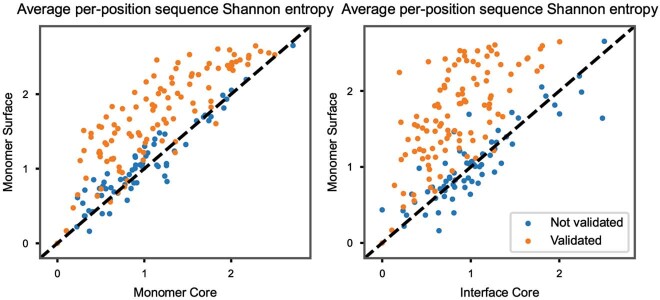
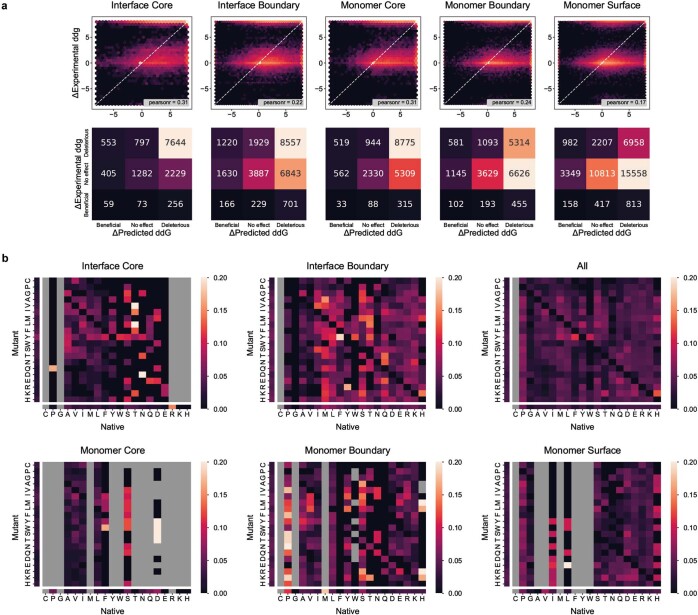
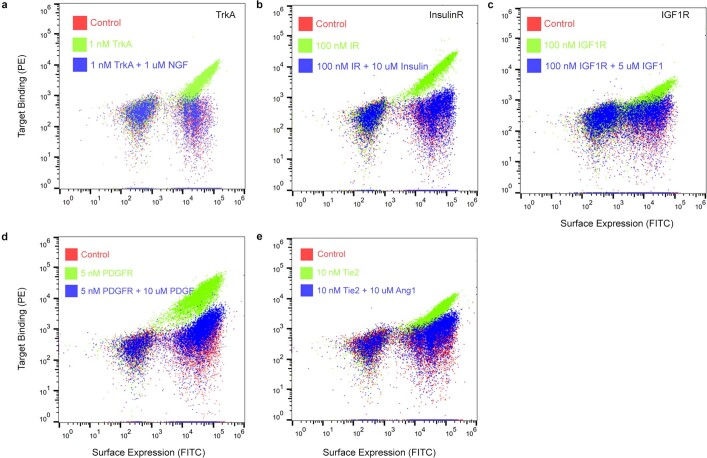
The design of proteins that bind to a specific site on the surface of a target protein using no information other than the three-dimensional structure of the target remains a challenge1-5. Here we describe a general solution to this problem that starts with a broad exploration of the vast space of possible binding modes to a selected region of a protein surface, and then intensifies the search in the vicinity of the most promising binding modes. We demonstrate the broad applicability of this approach through the de novo design of binding proteins to 12 diverse protein targets with different shapes and surface properties. Biophysical characterization shows that the binders, which are all smaller than 65 amino acids, are hyperstable and, following experimental optimization, bind their targets with nanomolar to picomolar affinities. We succeeded in solving crystal structures of five of the binder-target complexes, and all five closely match the corresponding computational design models. Experimental data on nearly half a million computational designs and hundreds of thousands of point mutants provide detailed feedback on the strengths and limitations of the method and of our current understanding of protein-protein interactions, and should guide improvements of both. Our approach enables the targeted design of binders to sites of interest on a wide variety of proteins for therapeutic and diagnostic applications.


Conflict of interest statement

L.C., B.C., I.G., B.H., N.B., E.-M.S., L.S. and D.B. are co-inventors on a provisional patent application (21-0753-US-PRO) that incorporates discoveries described in this manuscript.

Figures

Fig. 1
Fig. 1. Overview of the de novo protein binder design pipeline.
a, Schematic of our two-stage binder design approach. In the global search stage, billions of disembodied amino acids are docked onto the selected region of the target protein surface using RifGen, the favourable interacting amino acids are stored as rifres (step 1), and miniprotein scaffolds are then docked on the target guided by these favourable side-chain interactions (step 2). The interface sequences are then designed to maximize interactions with the target (step 3). In the focused search stage, interface structural motifs are extracted and clustered (steps 4 and 5). These privileged motifs are then used to guide another round of docking and design (steps 6 and 7). Designs are then selected for experimental characterization based on computational metrics (step 8). See Extended Data Fig. 1 for a more detailed flow chart of the de novo binder design pipeline. b, Comparison of the sampling efficiency of PatchDock, RifDock and resampling protocols. Bar graph shows the distribution over the three approaches of the top 1% of binders based on Rosetta ddG and contact molecular surface values after pooling equal-CPU-time dock-and-design trajectories for each of the 13 target sites and averaging per-target distributions (Methods).
Fig. 2
Fig. 2. De novo design and characterization of miniprotein binders.
a, d, Naturally occurring target protein structures shown in surface representation, with known interacting partners in cartoons where available. Regions targeted for binder design are coloured in pale yellow or green; the remainder of the target surface is in grey. See Extended Data Fig. 3 for side-by-side comparisons of the native binding partners and the computational design models. The PDB identifiers are 3ZTJ (H3), 3MJG (PDGFR), 4OGA (IR), 5U8R (IGF1R), 2GY7 (TIE2), 1XIW (CD3δ), 3KFD (TGFβ) and 4O3V (VirB8). αCT, α-chain C-terminal helix. b, e, Computational models of designed complexes coloured by site saturation mutagenesis results. Designed binding proteins (cartoons) are coloured by positional Shannon entropy, with blue indicating positions of low entropy (conserved) and red those of high entropy (not conserved); the target surface is in grey and yellow. The core residues and binding interface residues are more conserved than the non-interface surface positions, consistent with the computational models. Full SSM maps over all positions of all the de novo designs are provided in the Supplementary Information. c, f, Circular dichroism spectra at different temperatures (green, 25 °C; red, 95 °C; blue, 95 °C followed by 25 °C), and circular dichroism signals at 222-nm wavelength as a function of temperature for the optimized designs (insets). See Extended Data Fig. 4 for the biolayer interferometry characterization results of the optimized designs.
Fig. 3
Fig. 3. De novo design and inhibition of native signalling pathways by designed miniproteins.
See the panel descriptions in Fig. 2 legend for a, b, d. The PDB identifiers are 2IFG (TrkA), 1DJS (FGFR2), 1MOX (EGFR) and 3DI3 (IL-7Rα) for a. c, For TrkA, the dose-dependent reduction in cell proliferation after 48 h of TF-1 cells with increasing TrkA minibinder (TrkA_mb) concentration is shown. (8.0 ng ml–1 human β-NGF was used for competition). Titration curves at different concentrations of NGF and the effects of the miniprotein binders on cell viability are presented in Extended Data Fig. 8. For FGFR2, the dose-dependent reduction pERK signalling elicited by 0.75 nM β-FGF in human umbilical vein endothelial cells (HUVECs) with increasing FGFR2 minibinder (FGFR2_mb) concentration is shown. For the EGFRn-side binder, the dose-dependent reduction in pERK signalling elicited by 1 nM EGF in HUVECs with increasing EGFRn-side minibinder (EGFRn_mb) concentration is shown. See Extended Data Fig. 9 and Methods for experimental details. For the EGFRc-side binder, biolayer interferometry results are shown. See Extended Data Fig. 4 for the biolayer interferometry characterization results of the other optimized designs. For IL-7R, the reduction in STAT5 activity induced by 50 pM of IL-7 in HEK293T cells in the presence of increasing IL-7Rα minibinder (IL-7Rα_mb) concentrations is shown. The mean values were calculated from triplicates for the cell signalling inhibition assays measured in parallel, and error bars represent standard deviations. IC50 was calculated using a four-parameter-logistic equation in GraphPad Prism 9 software.
Fig. 4
Fig. 4. Designed binders have high target specificity.
To assess the cross-reactivity of each miniprotein binder (mb) with each target protein, biotinylated target proteins were loaded onto biolayer interferometry streptavidin sensors, allowed to equilibrate and the baseline signal set to zero. The biolayer interferometry tips were then placed into 100 nM binder solution for 5 min, washed with buffer, and dissociation was monitored for an additional 10 min. The heat map shows the maximum response signal for each binder–target pair normalized by the maximum response signal of the cognate designed binder–target pair. The raw biolayer interferometry traces are shown in the Supplementary Data 1. b, Surface shape and electrostatic potential (generated with the APBS Electrostatics plugin in PyMOL; red positive, blue, negative) of the designed binding interfaces.
Fig. 5
Fig. 5. High-resolution structures of miniprotein binders in complex with target proteins closely match the computational design models.
ae, Left, superimposition of the computational design model (silver) on the experimentally determined crystal structure. Right, zoom-in view of the designed interface, with interacting side chains as sticks. a, H3 HA. b, TrkA. c, FGFR2. d, IL-7Rα. e, VirB8. f, Superimposition of the computational design model and refined cryo-EM structures of LCB1 (left) and LCB3 (right) bound to the receptor-binding domain (RBD) of the SARS-CoV-2 spike protein.
Extended Data Fig. 1
Extended Data Fig. 1. Detailed flow chart of the de novo miniprotein binder design pipeline.
The computational design steps are colored as light green and experimental characterization and optimization steps are colored as light blue.
Extended Data Fig. 2
Extended Data Fig. 2. Analysis of the critical steps of the de novo binder design pipeline.
a, Comparison of the two docking approaches based on Rosetta ddG and contact molecular surface. Average and per-target distribution of the top 1% of binders in two key metrics after pooling equal-CPU-time dock-and-design trajectories. RifDock seeded with PatchDock outputs generated 300 outputs per scaffold that were trimmed to a total of 19,500 docks with “The Predictor” and designed using combinatorial side-chain optimization (orange). RifDock using the Hierarchical docking search generated 300 outputs per scaffold that were trimmed to a total of 19,500 docks with “The Predictor” and subsequently designed (purple). Rosetta ddG refers to the predicted binding energy as calculated by Rosetta and Contact MS to key residues refers to the Contact Molecular Surface value (a distance weighted interfacial area calculation) to the key hydrophobic residues on the target that define this binding site. b, The rapid pre-screening method enriches docks with better Rosetta ddG and contact molecular surface. Average and per-target distribution of the top 1% of binders in two key metrics after pooling equal-CPU-time dock-and-design trajectories. The top 30 PatchDock outputs for the 1,000 helical scaffolds tested were designed using the RosettaScripts protocol (blue). The top 300 PatchDock outputs for the 1,000 helical scaffolds tested were trimmed to 21,000 with “The Predictor” and subsequently designed (red). c, The improved sequence design protocol yielded amino acid sequences more strongly predicted to fold to the monomer structure. The effect on fragment quality and Rosetta Score with different fragment-quality-guidance approaches. Rosetta using FastDesign with the standard LayerDesign settings was used to design 1,000 3-helical and 1,000 4-helical mini-protein scaffolds (blue). The same protocol was supplanted with the ConsensusLoopDesign TaskOperation (orange). The structure-based PSSM was used as an energy term in addition to the Standard Rosetta protocol (green). Two predictors of sequence-structure correspondence were found to improve without negatively affecting the computed Rosetta score of the binders. The probability that the designed sequence encoded for the wrong secondary structure was computed using PsiPred4 (left), and for each 9aa fragment of the designed scaffold, the closest match to a fragment in the Protein Data Bank with the same sequence was computed and averaged over the entire structure (center). Details can be found in the Supplemental Information. d, The improved sequence design protocol yielded amino acid sequences more strongly bound to the target. 10,000 scaffolds docked against the N-terminal domain of EGFR were designed with the RosettaScripts protocol while varying only the weight of the ProteinProteinInterfaceUpweighter. This TaskOperation multiplies all energies across the interface by the listed value during packing-design calculations.
Extended Data Fig. 3
Extended Data Fig. 3. Comparison of the native binding partners and the computational design models.
Side-by-side comparison of the native binding partners of the selected targets and the binding configurations of the computational designed models.
Extended Data Fig. 4
Extended Data Fig. 4. Biolayer interferometry characterization of binding of optimized designs to the corresponding targets.
Two-fold serial dilutions were tested for each binder and the highest concentration is labeled. For H3, TrkA, FGFR2, EGFR, PDGFR, IL-7Rα, CD3δ, TGF-β and VirB8, the biotinylated target proteins were loaded onto the Streptavidin (SA) biosensors, and incubated with miniprotein binders in solution to measure association and dissociation. For IGF1R and Tie2, MBP- (maltose binding protein) tagged miniprotein binders were used as the analytes. For InsulinR, the miniprotein binder was immobilized onto the Amine Reactive Second-Generation (AR2G) Biosensors and the insulin receptor was used as the analyte. The gray color represents experimental data and orange color represents fit curves. The fitting curves are poor at high binder concentrations due to the self- association of the binders through the interface hydrophobic residues, so we only kept the traces and fits at low binder concentrations.
Extended Data Fig. 5
Extended Data Fig. 5. Average SSM sequence entropy for different regions of binders.
The sequence entropy of a single position was calculated by looking at the counts from the sort with the concentration closest to 10-fold lower than the estimated parent SC50 and performing a simple Shannon entropy calculation on all amino acids observed at that position. Each plotted point is the average entropy of all positions within each of the three zones respectively. Validated vs Not Validated refers to the SSM Validation procedure with a cutoff of 0.005 (see Methods and Extended Data Figure 15). Since one would expect the core residues of the monomer and core residues of the interface to be conserved while the surface residues should not matter, the validated binders trend above the line. Points on the line do not show a difference between their surfaces and cores, potentially indicating unfolded or misfolded proteins. Points below the line may be misfolded or binding with alternate residues.
Extended Data Fig. 6
Extended Data Fig. 6. Computational analysis of the experimental SSM results.
a, Ability of Rosetta to predict mutational effects. This graph shows the observed experimental effect of each mutation versus Rosetta’s expected effect. For each plotted point, the delta refers to the effect versus the parent SSM design; therefore a “Beneficial” mutation is one that would improve affinity relative to the original designed protein the SSM was based on. The ΔExperimental ddg is derived from FACS data using the SC50 values (see Methods). Confidence intervals were collapsed to their center point to make this graph and “No effect” refers to mutations with less than a 1 kcal/mol change. Binder region definitions: Interface Core: residue contacts target protein and has no SASA (Solvent Accessible Surface Area) in bound state; Interface Boundary: residue contacts target protein, but does have SASA; Monomer Core: residue has no SASA and does not contact target; Monomer Boundary: residue has intermediate SASA and does not contact target; Monomer Surface: residue has full SASA and does not contact target. see Methods SSM Validation for further explanation. b, Mutations observed in SSM experiments that improved affinity bind at least 1kcal/mol graphed by relative frequency. Plotted is the #_times_Native_to_Mutant_improved_affinity / #_times_Native_to_Mutant_tested_in SSMs. A value of 0.10 with x-axis F and y-axis W could therefore represent that for 2 of 20 times W was substituted for Y, the affinity improved. Separated bars on each axis represent pooled data for the entire row/column. Grey boxes indicate mutations that occurred fewer than 5 times. Only SSM designs with a validation score of 0.005 or better were considered. While some cells are clipped, none extended beyond 0.25. Binder region definitions: Interface Core: residue contacts target protein and has no SASA in bound state; Interface Boundary: residue contacts target protein, but does have SASA; Monomer Core: residue has no SASA and does not contact target; Monomer Boundary: residue has intermediate SASA and does not contact target; Monomer Surface: residue has full SASA and does not contact target.
Extended Data Fig. 7
Extended Data Fig. 7. Competition experiments indicated the miniprotein binders bound to the targeted region.
Yeast cells displaying the TrkA binder (a), InsulinR binder (b), IGF1R binder (c), PDGFR binder (d) and Tie2 binder (e) were incubated with the target protein in the presence or absence of the native ligand as the competitor, and target protein binding to cells (y axis) was monitored with flow cytometry.
Extended Data Fig. 8
Extended Data Fig. 8. Inhibition of the TrkA miniprotein binder on the native TrkA-NGF signaling pathway.
a, Titration curves of nerve growth factor (NGF) on TrkA signaling in the presence of different concentrations of the TrkA miniprotein binder. The TrkA miniprotein binder shifted the IC50 values of the TrkA response to NGF. b, The TrkA miniprotein binder showed no effects on the cell viability. TF-1 cells were treated with different concentrations of the TrkA miniprotein binder and the cell viability was quantified at both 24 and 48 hr. The mean values were calculated from duplicates for the pERK and pAKT signaling data, and triplicates for the cell proliferation and cell toxicity data. The error bars for the cell proliferation and cell cell toxicity data represent standard deviations.
Extended Data Fig. 9
Extended Data Fig. 9. Experimental characterization of the effects of the FGFR2 minibinder and the EGFR n-side minibinder on their native signaling.
a, FGFR2 mini binder (FGFR2_mb) inhibits FGF-induced ERK phosphorylation. Western Blot analysis showing reduction in FGF signaling (lanes 4-8) with increase in mini binder concentration. Lanes 3-4 show that EGF-induced ERK phosphorylation is unaffected by FGFR2 mini binder, eliminating any cross talk between the two receptors. b, EGFR n-side mini binder (EGFRn_mb) inhibits EGF-induced ERK and AKT phosphorylation. Western Blot analysis showing reduction in EGF signaling (lanes 4-8) with increase in mini binder concentration. Lanes 3-4 show that βFGF-induced ERK phosphorylation is unaffected by EGFR mini binder, eliminating any crosstalk between the two receptors. c, Titration curve for bFGF mediated pERK signaling. (upper) Western Blot showing dose-dependent increase in FGF signaling with βFGF concentration. (lower) n = 2 biologically independent experimental repeats were performed, and quantification was done using ImageJ analysis software. The selected concentration for competition assays was 0.75 nM. d, Titration curve for EGF mediated pERK/pAKT signaling. (upper) Western Blot showing dose-dependent increase in EGF signaling with EGF concentration. (lower) n = 2 biologically independent experimental repeats were performed, and quantification was done using ImageJ analysis software. The selected concentration for competition assays was 1 nM. e, Representative Western Blot for inhibition curves – FGFR2 minibinder. Western Blot shows dose-dependent reduction in pERK signaling with mini minder concentration. Quantification was done using ImageJ analysis software. f, Representative Western Blot for inhibition curves – EGFR n-side minibinder. Western Blot shows dose-dependent reduction in (upper) pERK signaling and (lower) pAKT signaling with minibinder concentration. Quantification was done using ImageJ analysis software. g, Dose-dependent reduction in pAKT signaling elicited by 1 nM EGF in HUVECs with increase in EGFR n-side minibinder concentration. The IC50 was calculated using a four-parameter-logistic equation in GraphPad Prism 9 software.
Extended Data Fig. 10
Extended Data Fig. 10. De novo design and experimental characterization of the influenza hemagglutinin (HA) binder.
a, Structure comparison of the stem region of group 1 HA and group 2 HA. The stem regions of H1 HA (A/Puerto Rico/8/1934) (left, PDB code: 1RU7) and H3 HA (A/Hong Kong/1/1968) (right, PDB code: 4WE4) are shown in cartoon and colored in pale cyan and pale green respectively, the key residues in the stem region are shown as sticks. Three major differences make the H3 HA stem region a more challenging target for designing de novo protein binders: the H3 HA stem region contains more polar residues and is more hydrophilic. Residues in H1 HA that are hydrophobic residues or small polar residues while the corresponding residues are polar or larger polar residues are highlighted in dashed circles; Trp21 adopts different configurations in H1 HA and H3 HA, and the targeting groove in H3 HA is much shallower and less hydrophobic; the H3 HA is glycosylated at Asn38, and the carbohydrate side chains cover the hydrophobic groove and protect the HA stem region from binding by antibodies or designed binders. The insert shows a more extended view of the Asn38 glycosylation site on H3 HA. b, Binding of H3 binder to the H3 HA (A/Hong Kong/1/1968) N38D mutant (left) and H1 HA (A/Puerto Rico/8/1934) (right) with BLI. Two-fold serial dilutions were tested for each binder and the highest concentrations and the binder affinities are labeled. The gray color represents experimental data and orange color represents fit curves. c, The FI6v3 antibody competes with the binder for binding to the influenza A H1 hemagglutinin (left) and influenza A H3 hemagglutinin (right). Yeast cells displaying the H3 binder were incubated with 10 nM H1 or H3 in the presence or absence of 2 μM FI6v3 antibody, and hemagglutinin binding to cells (y axis) was monitored with flow cytometry.
Extended Data Fig. 11
Extended Data Fig. 11. Structure characterization of the miniprotein binders without the target proteins.
Superimposition of the computation of the design model (silver) and the crystal structure for the FGFR2 binder (a) and IL-7Rα (b) binder. The crystal structures of the miniprotein binders were determined without the target protein.
Extended Data Fig. 12
Extended Data Fig. 12. Analysis of the determinants of the success rate of de novo binder design.
a, Correlation between success rate and root mean square deviation (RMSD) with scaffolds. In this experiment, the accuracy of the scaffold library was examined with an experiment similar to Chevalier et al.. The binding residues from known-good interfaces were copied onto scaffolds that closely resembled the known-good binders. If the scaffold folded properly and displayed these binding residues similarly to the original known-good interface, the hypothesis was that the scaffold would bind. This experiment sought to determine both the required accuracy of displayed sidechains to create a successful binder as well as to probe the accuracy of the scaffold library. If for instance, the scaffold library was perfectly accurate, this graph would indicate that if the Cα RMSD of the displayed sidechains deviates from the known-good conformation by 0.5 Å, that there would be a 15% chance of binding due to the intrinsic accuracy of sidechains required for binding. The scaffold library is likely not perfectly accurate however; as such, the correct interpretation would be: If the Cα RMSD of the displayed sidechains according to the scaffold PDB model (which may not be perfectly correct) deviates by 0.5 Å Cα RMSD, there is a 15% chance of binding. This 15% chance of binding arises in part from the likelihood that the scaffold will fold correctly and in part from the intrinsic required accuracy of sidechain placements for binding. Notably, the RMSD reported in this graph is far lower than the determined crystallographic accuracy of the IL-7Rα binder when aligned by the receptor (the two interfacial helices are 1.5 Å Cα RMSD when aligned by the IL-7Rα receptor); however, if the two interfacial helices are aligned without regard for the receptor (the same calculation performed in this figure (i.e. the helices are superimposed on top of each other)) the Cα RMSD is 0.43 Å. As such, the best explanation for this data is as follows: Although the predicted binding conformation of the complex structure was only accurate to 1.5 Å, the predicted monomer structure was correct to 0.43 Å. The comparison between scaffold and known-good interface was performed at the monomer level, and therefore, these new binders were successful because they assumed the correct monomer structure, which displayed the sidechains the same as the known-good binder, and therefore were able to bind, even though the known-good complex structure was not as accurate. This graph continues to show increased signal below 0.43 Å probably because the scaffolds at very low RMSD ended up being slightly structurally different for the same reason as the known-good binder. (i.e. if we crystallized one of the scaffolds that differed only by 0.2 Å, we would likely find that scaffold model and the scaffold crystal structure deviate by about 0.43 Å and that the scaffold crystal structure and the known-good crystal structure are very similar). Method: 11 IL-7Rα SSM-validated interfaces were used as a starting point to create 2-helical grafts. All grafts consisted of 2-helices joined with a loop and the scaffold library was superimposed onto these two helices and the RMSD of the match was assessed. If a good match was found, the sidechains making strong interactions with IL-7Rα were copied onto the scaffold and the remaining positions near the interface were allowed to redesign to avoid clashes. Plotted on the x-axis is the RMSD of the superposition of the 2-helices + loop between the motif and the scaffold. The y-axis represents the fraction of binders with predicted SC50s <3 μM with the number on top representing the denominator. b, Target success rate versus hydrophobicity. The y-axis shows what percentage of tested binders against the indicated target showed SC50 below 4 μM. The x-axis shows the hydrophobicity of the target region in SAP units. A greater Δsap_score indicates greater hydrophobicity. While this graph is not completely fair as the authors improved the method with time, the trend is striking and can be used to estimate the difficulty of potential future targets. (The Δsap_score can be calculated on the target structure alone by observing the SAP score of all residues a potential binder would cover.).
Extended Data Fig. 13
Extended Data Fig. 13. Power of computational metrics to predict binders.
On the fully-relaxed binder dataset (see Methods), the ability of several computational metrics to predict which binders would have SC50 below 4 μM was assessed. In black and in the bar charts, data for all targets were pooled together. The bar charts show the success rate in each of the 10 percentiles for the metric while the black solid line shows the ROC plot for the metric. Each of the colored lines represents the correlation of this metric on each of the targets individually. The AUC of the overall black line is given in the upper left with the median of the AUC of the colored lines given immediately below.

References

    1. Chevalier A, et al. Massively parallel de novo protein design for targeted therapeutics. Nature. 2017;550:74–79. doi: 10.1038/nature23912. - DOI - PMC - PubMed
    1. Strauch EM, et al. Computational design of trimeric influenza-neutralizing proteins targeting the hemagglutinin receptor binding site. Nat. Biotechnol. 2017;35:667–671. doi: 10.1038/nbt.3907. - DOI - PMC - PubMed
    1. Silva DA, et al. De novo design of potent and selective mimics of IL-2 and IL-15. Nature. 2019;565:186–191. doi: 10.1038/s41586-018-0830-7. - DOI - PMC - PubMed
    1. Baran D, et al. Principles for computational design of binding antibodies. Proc. Natl Acad. Sci. USA. 2017;114:10900–10905. doi: 10.1073/pnas.1707171114. - DOI - PMC - PubMed
    1. Fleishman SJ, et al. Computational design of proteins targeting the conserved stem region of influenza hemagglutinin. Science. 2011;332:816–821. doi: 10.1126/science.1202617. - DOI - PMC - PubMed

Publication types