. 2022 Oct;29(10):1913-1927.
doi: 10.1038/s41418-022-00974-5. Epub 2022 Mar 24.

Activation of Drp1 promotes fatty acids-induced metabolic reprograming to potentiate Wnt signaling in colon cancer

Affiliations

Activation of Drp1 promotes fatty acids-induced metabolic reprograming to potentiate Wnt signaling in colon cancer

Xiaopeng Xiong et al. Cell Death Differ. 2022 Oct.

Abstract

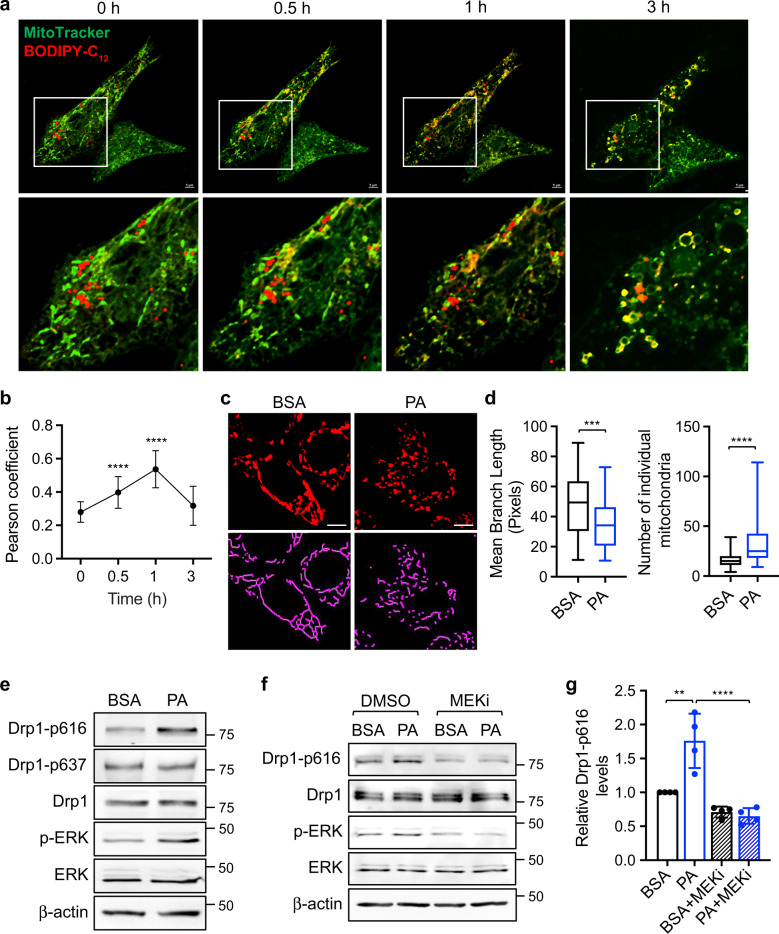
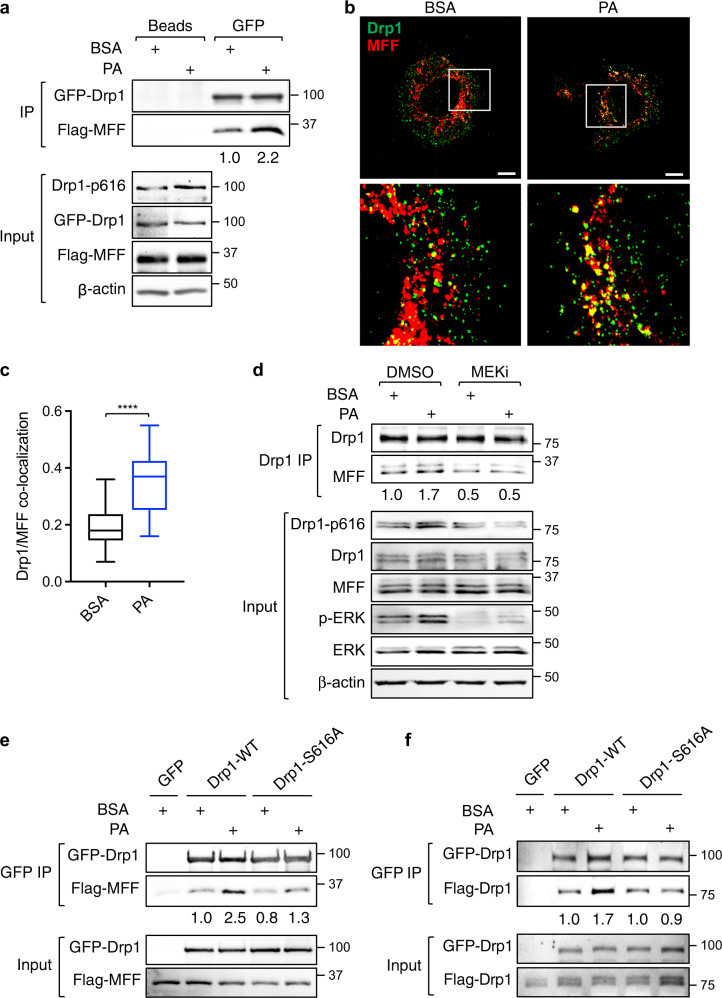
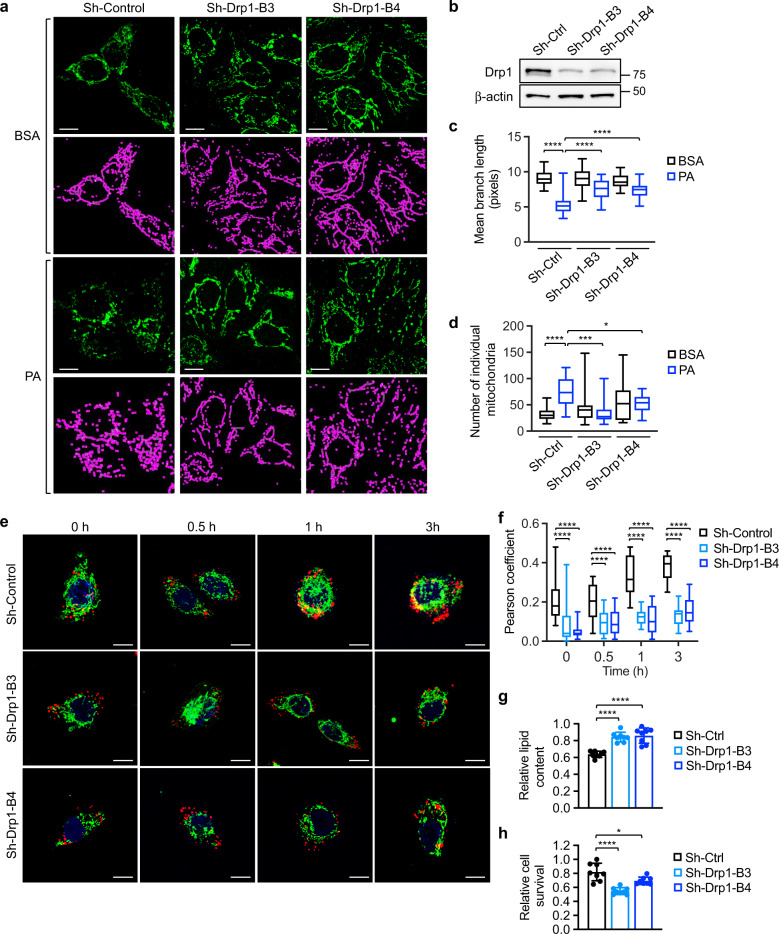
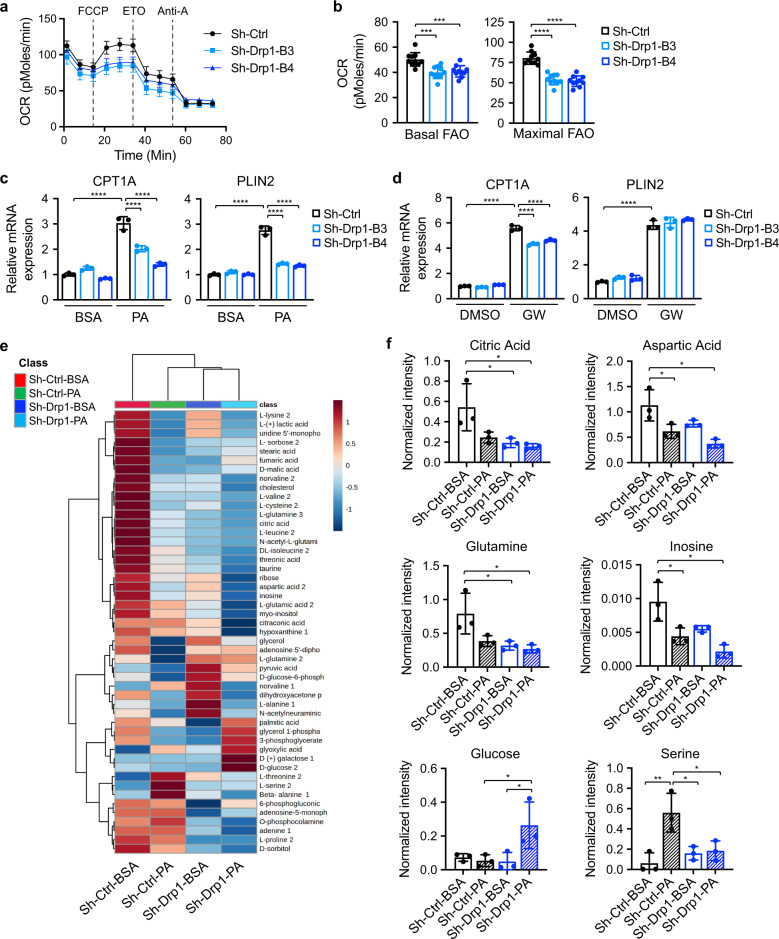
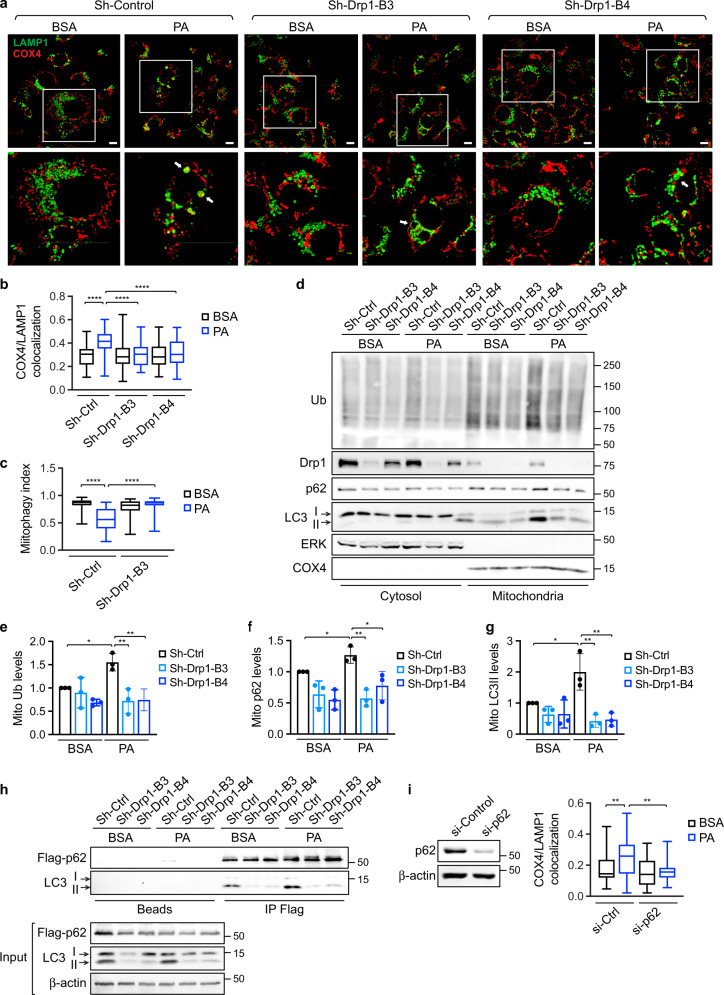
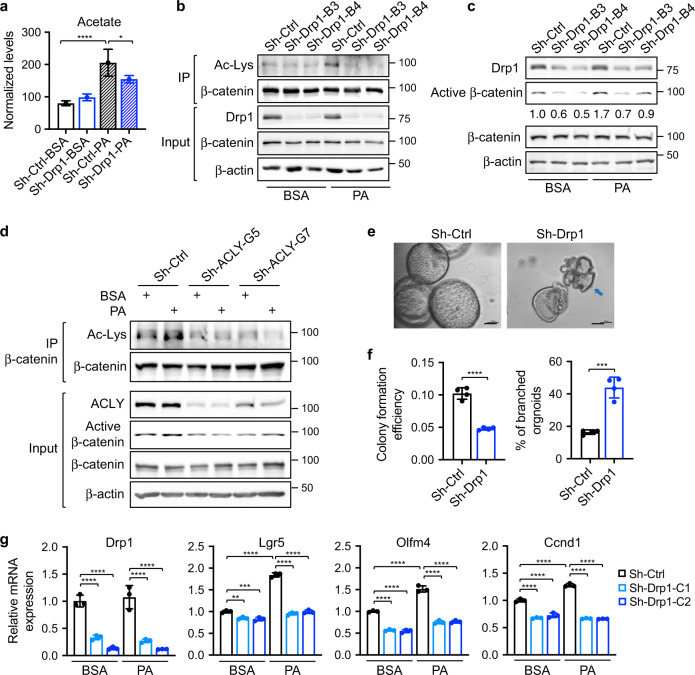
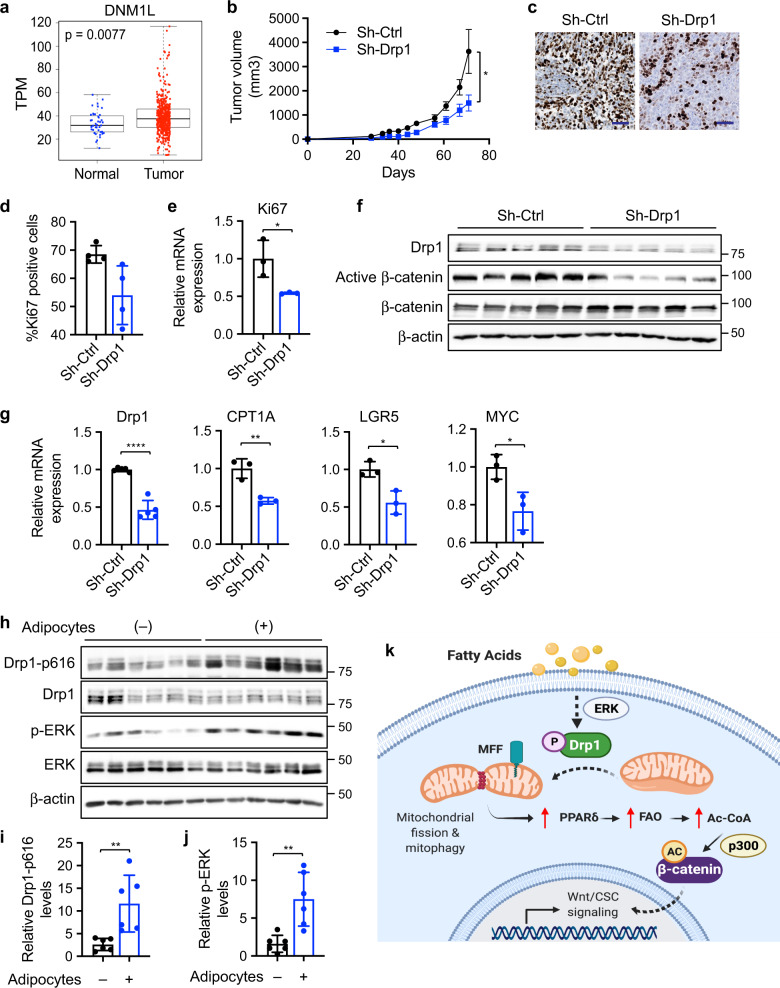
Cancer cells are known for their ability to adapt variable metabolic programs depending on the availability of specific nutrients. Our previous studies have shown that uptake of fatty acids alters cellular metabolic pathways in colon cancer cells to favor fatty acid oxidation. Here, we show that fatty acids activate Drp1 to promote metabolic plasticity in cancer cells. Uptake of fatty acids (FAs) induces mitochondrial fragmentation by promoting ERK-dependent phosphorylation of Drp1 at the S616 site. This increased phosphorylation of Drp1 enhances its dimerization and interaction with Mitochondrial Fission Factor (MFF) at the mitochondria. Consequently, knockdown of Drp1 or MFF attenuates fatty acid-induced mitochondrial fission. In addition, uptake of fatty acids triggers mitophagy via a Drp1- and p62-dependent mechanism to protect mitochondrial integrity. Moreover, results from metabolic profiling analysis reveal that silencing Drp1 disrupts cellular metabolism and blocks fatty acid-induced metabolic reprograming by inhibiting fatty acid utilization. Functionally, knockdown of Drp1 decreases Wnt/β-catenin signaling by preventing fatty acid oxidation-dependent acetylation of β-catenin. As a result, Drp1 depletion inhibits the formation of tumor organoids in vitro and xenograft tumor growth in vivo. Taken together, our study identifies Drp1 as a key mediator that connects mitochondrial dynamics with fatty acid metabolism and cancer cell signaling.


Conflict of interest statement

The authors declare no competing interests.

Figures

Fig. 1
Fig. 1. Fatty acid treatment induces mitochondrial fission in colon cancer cells.
a HCT116 cells were incubated with BODIPY-C12 fluorescent fatty acid (red) and MitoTracker (green) for 1 h. After washing with PBS, the localization of BODIPY-C12 and mitochondria were monitored using live cell imaging. Representative images were taken at indicated time points. The boxed area is enlarged and shown below the corresponding image. Scale bar, 5 μm. b Colocalization of BODIPY-C12 lipid droplets with mitochondria at indicated time points were determined by Pearson coefficient as calculated using NIS-elements AR software (Nikon). Data are presented as mean ± SD (n = 30, ****p < 0.0001). c Representative confocal images of PT130 cells that were treated with BSA or PA and stained with MitoTracker (red). The skeletonized images shown below were generated by the MiNA software and used for the quantitative analysis of mitochondrial morphology. Scale bar, 10 μm. d The length of mitochondrial branch and the number of individual mitochondria were determined using MiNA with ImageJ. Results were presented as box plots (n = 20, ***p < 0.001 and ****p < 0.0001). e PT130 were treated with BSA or PA for 18 h. The levels of Drp1 phosphorylation at S616 (Drp1-p616), and S637 (Drp1-p637), Drp1, phospho-ERK (p-ERK), ERK, and β-actin were determined in cell lysates using western blot. f PT130 cells were treated with BSA or PA in combination with DMSO or trametinib (MEKi) for 18 h. The levels of Drp1-p616, Drp1, p-ERK, ERK, and β-actin were determined using western blot. g Representative western blots as shown in (f) were quantified to determine the relative Drp1-p616 levels by normalizing Drp1-p616 to Drp1. Data were presented as mean ± SD (n = 4, **p < 0.01, and ****p < 0.0001).
Fig. 2
Fig. 2. Fatty acid-induced Drp1 phosphorylation facilitates mitochondrial recruitment of Drp1 via interaction with MFF.
a PT130 cells transfected with GFP-Drp1 and Flag-MFF plasmids were treated with BSA or PA for 18 h. Cell lysates were immunoprecipitated with protein A/G agarose (beads) or GFP antibody conjugated beads. The presence of GFP-Drp1 and Flag-MFF in the immunoprecipitates was detected using Drp1 and Flag antibodies, respectively. The expression of Drp1-p616, GFP-Drp1, Flag-MFF, and β-actin in cell lysates (10% of input) was determined using western blot. The relative amount of Flag-MFF immunoprecipitated with GFP-Drp1 was obtained by normalizing MFF to Drp1 in GFP immunoprecipitates. b Representative confocal images of PT130 cells treated with BSA or PA for 6 h and stained with Drp1 (green) and MFF (red) antibodies. The boxed area is enlarged and shown below the corresponding image. Scale Bar, 10 μm. c Colocalization of Drp1 and MFF was quantitatively determined by Pearson coefficient analysis. Results were presented as a box plot (n = 20, ****p < 0.0001). d PT130 cells were treated with BSA or PA in combination with DMSO or MEKi for 18 h. Cell lysates were immunoprecipitated with the Drp1 antibody. The presence of endogenous Drp1 and MFF in immunoprecipitates were detected using Drp1 and MFF antibodies, respectively. The expression of Drp1-p616, Drp1, MFF, p-ERK, ERK, and β-actin in the input was determined using western blot. The relative amount of MFF that co-immunoprecipitated with Drp1 was determined by normalizing levels of MFF to Drp1 in the immunoprecipitates. Note that multiple endogenous MFF isoforms are detected by the MFF antibody in total cell lysates. e PT130 cells transfected with GFP, GFP-Drp1-WT, or GFP-Drp1-S616A together with Flag-MFF were treated with BSA or PA for 18 h. Cell lysates were immunoprecipitated with GFP antibody conjugated beads. The presence of GFP-Drp1 and Flag-MFF was detected using Drp1 and Flag antibodies, respectively. The relative amount of Flag-MFF that co-immunoprecipitated with GFP-Drp1 was determined by normalizing levels of MFF to Drp1 in GFP immunoprecipitates. f PT130 cells were transfected with the following combination of plasmids: (i) GFP + Flag-Drp1-WT; (ii) GFP-Drp1-WT + Flag-Drp1-WT; and (iii) GPF-Drp1-S616A + Flag-Drp1-S616A. Cell lysates prepared from transfected cells treated with BSA or PA were immunoprecipitated with GFP antibody conjugated beads. The presence of GFP-Drp1 (WT or S616A) and Flag-Drp1 (WT or S616A) was detected in the immunoprecipitates and input using GFP and Flag antibodies, respectively. The relative amount of Flag-Drp1 (WT or S616A) that co-immunoprecipitated with GFP-Drp1 (WT or S616A) was determined by normalizing Flag-Drp1 to GFP-Drp1 in GFP immunoprecipitates.
Fig. 3
Fig. 3. Knockdown of Drp1 blocks fatty acid-induced mitochondrial fission and fatty acid utilization.
a Control (sh-Ctrl) and two Drp1 knockdown (sh-Drp1-B3 and sh-Drp1-B4) PT130 cells were treated with BSA or PA for 18 h. Representative confocal images were taken of cells stained with MitoTracker Green. The skeletonized images shown below were generated by the MiNA software and used for the quantitative analysis of mitochondrial morphology. Scale bar, 10 μm. b Cell lysates of sh-Ctrl and sh-Drp1 PT130 cells were analyzed for the expression of Drp1 and β-actin using western blot. c The length of mitochondrial branch and d the number of individual mitochondria were determined using MiNA with ImageJ. Results were presented as box plots (n = 20, *p < 0.05, ***p < 0.001 and ****p < 0.0001). e Sh-Ctrl and sh-Drp1 PT130 cells were incubated with BODIPY-C12 (red) and MitoTracker (green) for 45 min and subsequently cultured in DMEM low glucose media supplemented with 10% lipoprotein-deficient serum. Representative images were taken at indicated time points. Scale bar, 10 μm. f Colocalization of BODIPY-C12 with mitochondria was determined using Pearson coefficient as calculated by NIS-elements AR software (Nikon). Results were presented as a box plot (n = 40, ****p < 0.0001). g Sh-Ctrl and sh-Drp1 PT130 cells were incubated with PA for 24 h and subsequently cultured in DMEM low glucose media supplemented with 10% lipoprotein-deficient serum for additional 48 h to allow for lipid utilization. Total cellular lipid contents were determined by BODIPY 493/503 staining. The fluorescence intensity of stained cells was measured using a fluorescence plate reader. Data were presented as mean ± SD (n = 8, ****p < 0.0001). h Sh-Ctrl and sh-Drp1 PT130 cells were loaded with PA and subsequent cultured in EBSS for 48 h. The relative cell survival for each cell line was determined by comparing to cells cultured in regular growth media. Data were presented as mean ± SD (n = 8, *p < 0.05, and ****p < 0.0001).
Fig. 4
Fig. 4. Knockdown of Drp1 disrupts FAO and alters cellular metabolism in colon cancer cells.
a Sh-Ctrl and sh-Drp1 PT130 cells were cultured in substrate-limited media and subsequently subjected to Seahorse FAO tests using Seahorse XF96 Extracellular Flux Analyzer as described in Materials and Methods. FCCP, ETO, and antimycin A (Anti-A) were added sequentially as indicated by dashed lines. The OCR measurements were normalized to total cell numbers. b Fatty acid-driven mitochondrial respirations were calculated based on OCR measurements and used to reflect basal and maximal levels of FAO. Results were presented as mean ± SD (n = 10, ***p < 0.001 and ****p < 0.0001). c Sh-Ctrl and sh-Drp1 PT130 cells treated with BSA or PA were analyzed for the expression of CPT1A and PLIN2 using RT-qPCR. Data were presented as mean ± SD (n = 3, ****p < 0.0001). d Sh-Ctrl and sh-Drp1 PT130 cells were treated with PPARδ agonist GW501516 (1 μM) for 24 h. The relative expression of CPT1A and PLIN2 was determined using RT-qPCR. Data were presented as mean ± SD (n = 3, ****p < 0.0001). e Sh-Ctrl and sh-Drp1 PT130 cells were treated with BSA or PA for 18 h. Polar metabolites were extracted and analyzed using GC-MS. The heatmap of polar metabolite levels was generated using Metaboanalyst. f Examples of polar metabolites that were differentially regulated in sh-Ctrl and sh-Drp1 PT130 cells. Data were presented as mean ± SD (n = 3, *p < 0.05, and **p < 0.01).
Fig. 5
Fig. 5. Uptake of fatty acids induces mitophagy through a Drp1- and p62-dependent mechanism in colon cancer cells.
a Sh-Ctrl and sh-Drp1 PT130 cells were treated with BSA or PA for 18 h. Representative confocal images were taken from cells stained with LAMP1 (green) and COX4 (red) antibodies. The boxed areas are enlarged and shown below the corresponding images. Arrows indicate enlarged lysosomes either filled with mitochondria in sh-Ctrl cells or remained empty in sh-Drp1 cells. Scale Bar, 10 μm. b Colocalization of COX4 and LAMP1 was determined using Pearson coefficient as calculated by NIS-elements AR software. Results are presented as a box plot (n = 30, ****p < 0.0001). c Sh-Ctrl and sh-Drp1 PT130 cells transfected with Su9-mCherry-GFP reporter were treated with BSA or PA for 18 h. The degree of mCherry and GFP colocalization of was determined using Person coefficient and termed mitophagy index. Results were presented as a box plot (n = 30, ****p < 0.0001). d Sh-Ctrl and sh-Drp1 PT130 cells were treated with BSA or PA for 18 h. Cytosolic and mitochondrial fractions were prepared and analyzed for the expression of ubiquitinated proteins (Ub), Drp1, p62, and LC3 using western blot. ERK and COX4 were used as markers for cytosolic and mitochondrial fractions, respectively. e–g Relatively levels of protein ubiquitination (e), p62 (f), and LC3 (g) in the mitochondrial fraction were determined by normalizing to COX4. Data were presented as mean ± SD (n = 3, *p < 0.05 and **p < 0.01). h Sh-Ctrl and sh-Drp1 PT130 cells transfected with Flag-p62 were treated with BSA or PA for 18 h. Cell lysates were immunoprecipitated with protein A/G beads (beads) or Flag antibody conjugated beads. The presence of LC3 and Flag-p62 and in the immunoprecipitates and inputs was detected using LC3 and Flag antibodies, respectively. i PT130 cells were transfected with control or p62 siRNA. Two days following transfection, si-Ctrl and si-p62 cells were treated with BSA or PA for 18 h. Colocalization of LAMP1 and COX4 were examined using IF staining and expressed as Person coefficient. Results were presented as a box plot (n = 30, **p < 0.01). The knockdown efficiency of p62 was confirmed by western blot analysis and shown on the left.
Fig. 6
Fig. 6. Downregulation of Drp1 decreases cellular levels of acetate and acetylation of β-catenin.
a Sh-Ctrl and sh-Drp1 PT130 cells were treated with BSA or PA for 18 h. Cellular acetate was extracted and analyzed using GC-MS. Data were presented as mean ± SD (n = 3 for sh-Ctrl-PA group and n = 4 for other groups, *p < 0.05 and ****p < 0.0001). b Cell lysates isolated from sh-Ctrl and sh-Drp1 PT130 cells treated with BSA or PA were immunoprecipitated using the β-catenin antibody. The acetylation of β-catenin was detected by the acetylated-lysine antibody (Ac-Lys). c Sh-Ctrl and sh-Drp1 PT130 cells were treated with BSA or PA for 18 h. GSK3 inhibitor, CHIR99021 (3 μM), was included in both groups to allow the analysis of β-catenin activation downstream of the destruction complex. The expression of Drp1, active β-catenin, total β-catenin, and β-actin were analyzed using western blot. The relative levels of active β-catenin were obtained by normalizing active β-catenin to β-actin. d Sh-Ctrl and sh-ACLY PT130 cells were treated with BSA or PA for 18 h. Cell lysates were immunoprecipitated using the anti-β-catenin antibody and the acetylation of β-catenin were detected using the Ac-Lys antibody. The expression of ACLY, active β-catenin, total β-catenin, and β-actin was detected in the 10% input using western blot. e Representative images of control and Drp1 knockdown Apc/Kras tumor organoids grown in 3D Matrigel for 6 days. Arrow indicates tumor organoid with branched phenotype. Scale bar, 100 μm. f Single cell suspensions of sh-Ctrl and sh-Drp1 tumor cells were seeded in 3D Matrigel. The colony formation efficiency and the percentage of organoids with branched phenotype were quantified. Data were presented as mean ± SD (n = 4, ****p < 0.0001). g Sh-Ctrl and sh-Drp1 tumor organoids were cultured in organoid growth media with the addition of BSA or PA for 2 days. The relative expression of Drp1 and Wnt target genes (including Lgr5, Olfm4, and Ccnd1) was determined using RT-qPCR. Data were presented as mean ± SD (n = 3, **p < 0.01 and ****p < 0.0001).
Fig. 7
Fig. 7. Knockdown of Drp1 inhibits xenograft tumor growth and Wnt signaling in vivo.
a Bioinformatic analysis of TCGA-COAD dataset showed higher Drp1 (DNM1L gene) expression in tumors compared to normal samples (p = 0.0077 based on linear mixed models). b Sh-Ctrl and sh-Drp1 PT130 cells were injected subcutaneously into NSG mice. The size of tumors was measured every 3–5 days starting at the 3rd week after injection. Data were presented as mean ± SEM (n = 12, *p < 0.05). c Representative images from tumor sections stained with the Ki67 antibody. Scale bar, 25 μm. d The percentage of Ki67 positive cells were quantified in tumors from 4 mice of each group using HALO. Data were presented as mean ± SD (n = 4, *p < 0.05). e Tumor tissues from three mice of each group were analyzed for the expression of Ki67 mRNA using RT-qPCR. Data were presented as mean ± SD (n = 3, *p < 0.05). f Tumor tissues from sh-Ctrl and sh-Drp1 group were analyzed for the expression of Drp1, active β-catenin, total β-catenin, and β-actin using western blot. g Tumor tissues from three mice of each group were analyzed for the expression of Drp1, CPT1A, LGR5, and MYC mRNA using RT-qPCR. Data were presented as mean ± SD (n = 3, *p < 0.05, **p < 0.01, and ****p < 0.0001). h Suspensions of SW480 cells with or without adipocytes were injected subcutaneously into NSG mice and tumor tissues were analyzed for the expression of Drp1-p616, Drp1, p-ERK, ERK, and β-actin using western blot. i, j Relative Drp1-p616 (i) and p-ERK (j) levels were quantified by normalizing Drp1-p616 to Drp1 and p-ERK to ERK, respectively. Data were presented as mean ± SD (n = 6, **p < 0.01). k Results from our study support a model in which fatty acids activate Drp1/MFF-mediated mitochondrial fission to promote Wnt/β-catenin signaling by remodeling cellular metabolic pathways.

References

    1. Bhaskaran K, Douglas I, Forbes H, dos-Santos-Silva I, Leon DA, Smeeth L. Body-mass index and risk of 22 specific cancers: a population-based cohort study of 5·24 million UK adults. Lancet. 2014;384:755–65. doi: 10.1016/S0140-6736(14)60892-8. - DOI - PMC - PubMed
    1. Lauby-Secretan B, Scoccianti C, Loomis D, Grosse Y, Bianchini F, Straif K. Body fatness and cancer—viewpoint of the IARC working group. N. Engl J Med. 2016;375:794–8. doi: 10.1056/NEJMsr1606602. - DOI - PMC - PubMed
    1. Corn KC, Windham MA, Rafat M. Lipids in the tumor microenvironment: From cancer progression to treatment. Prog Lipid Res. 2020;80:101055. doi: 10.1016/j.plipres.2020.101055. - DOI - PMC - PubMed
    1. Ringel AE, Drijvers JM, Baker GJ, Catozzi A, García-Cañaveras JC, Gassaway BM, et al. Obesity shapes metabolism in the tumor microenvironment to suppress anti-tumor immunity. Cell. 2020;183:1848–66. doi: 10.1016/j.cell.2020.11.009. - DOI - PMC - PubMed
    1. Li Z, Liu H, He J, Wang Z, Yin Z, You G, et al. Acetyl-CoA synthetase 2: a critical linkage in obesity-induced tumorigenesis in myeloma. Cell Metab. 2021;33:78–93. doi: 10.1016/j.cmet.2020.12.011. - DOI - PMC - PubMed

Publication types