. 2022 Apr;54(4):393-402.
doi: 10.1038/s41588-022-01032-z. Epub 2022 Mar 24.

HLA autoimmune risk alleles restrict the hypervariable region of T cell receptors

Affiliations

HLA autoimmune risk alleles restrict the hypervariable region of T cell receptors

Kazuyoshi Ishigaki et al. Nat Genet. 2022 Apr.

Abstract

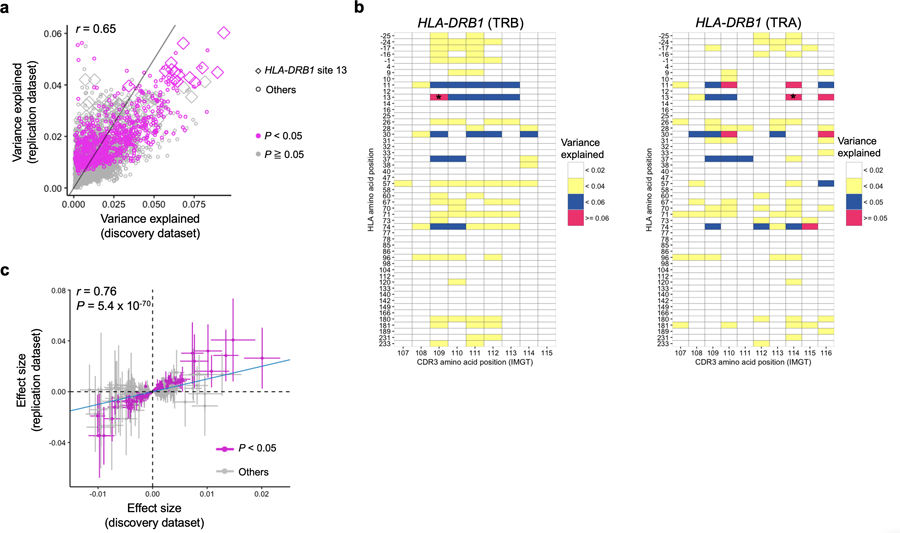
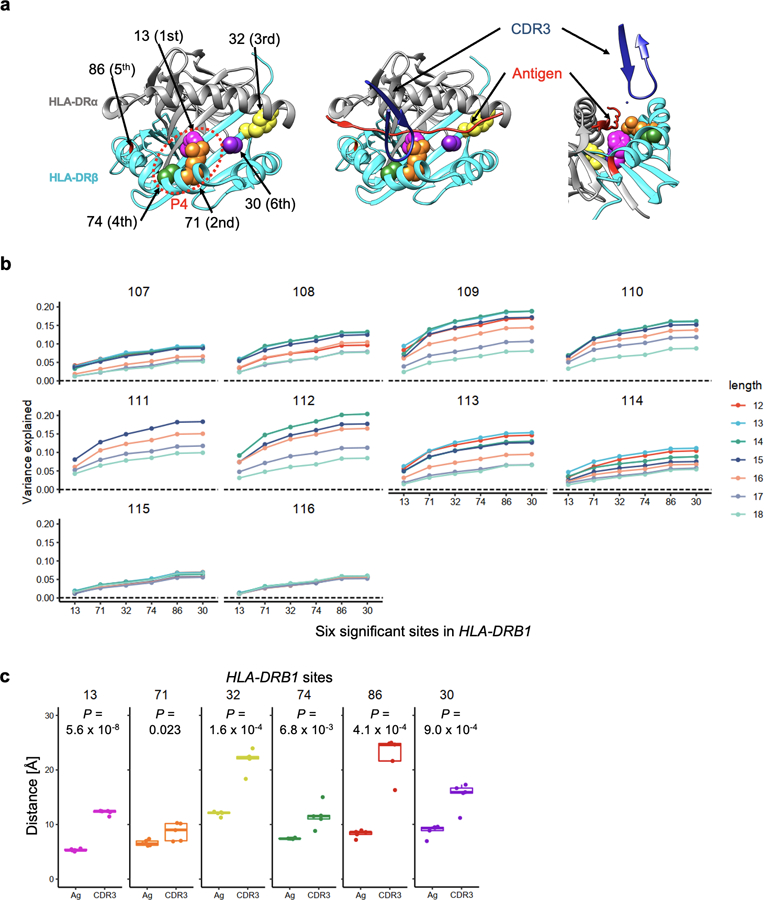
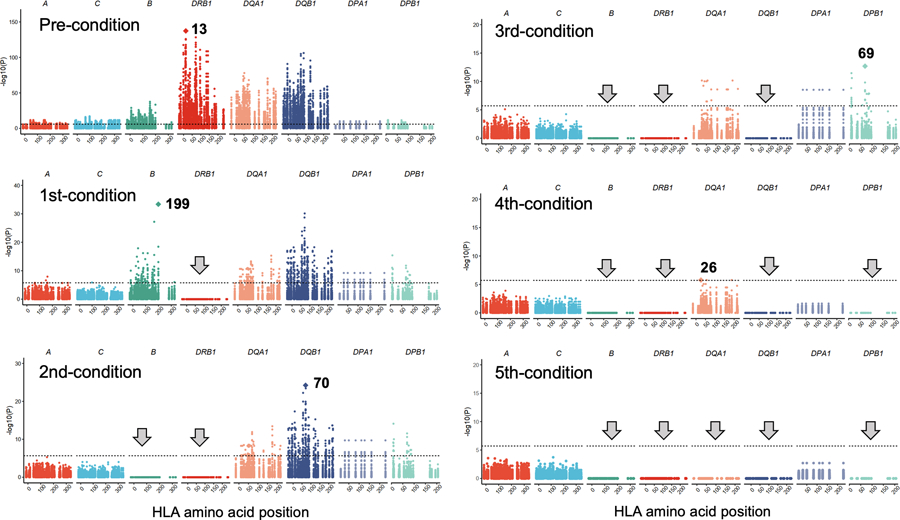
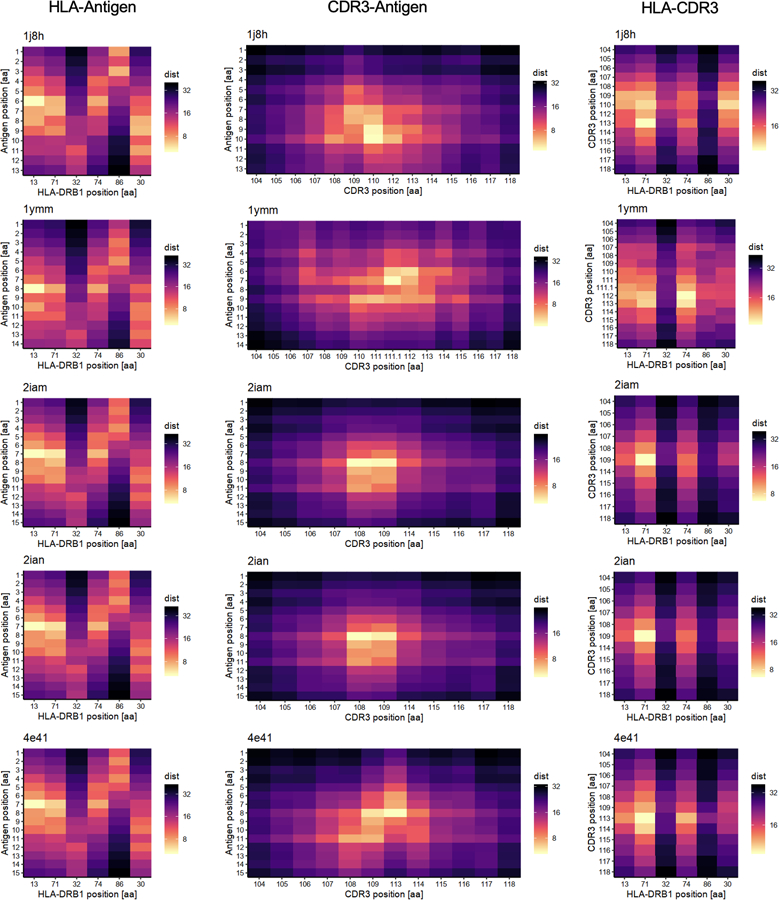
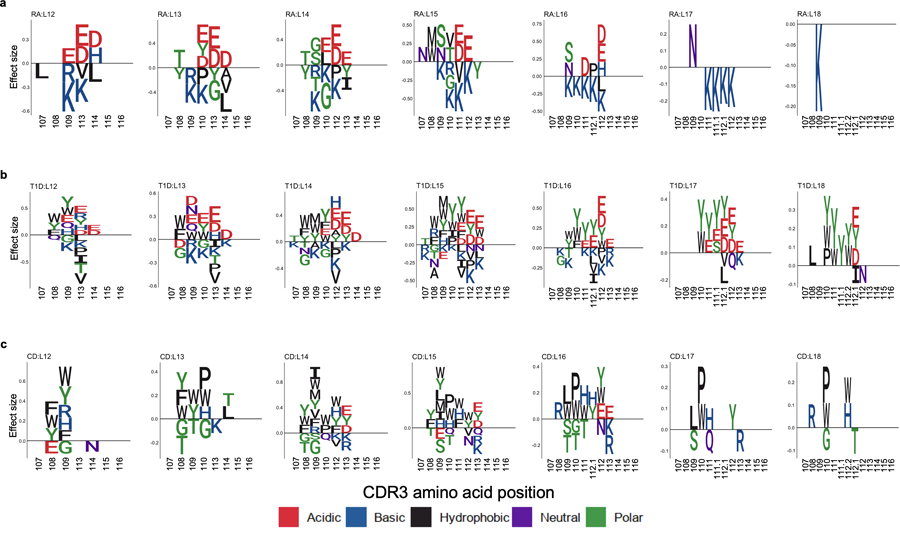
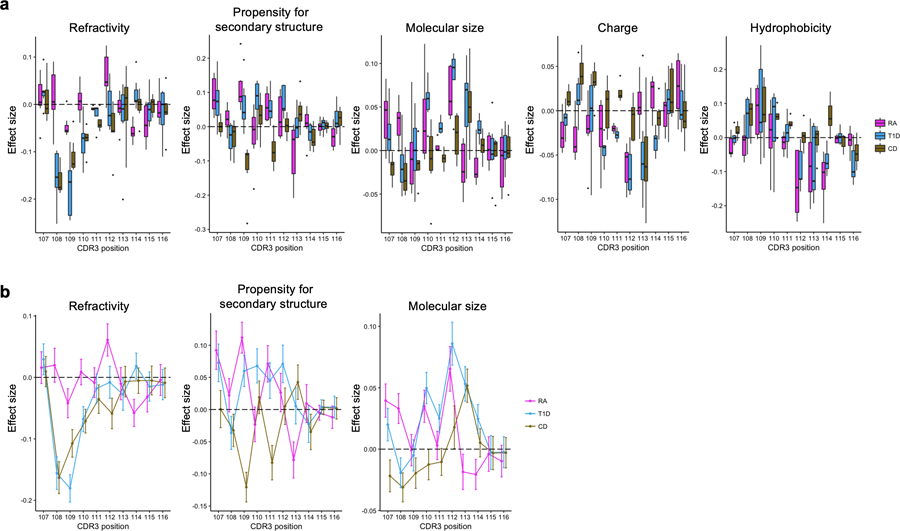
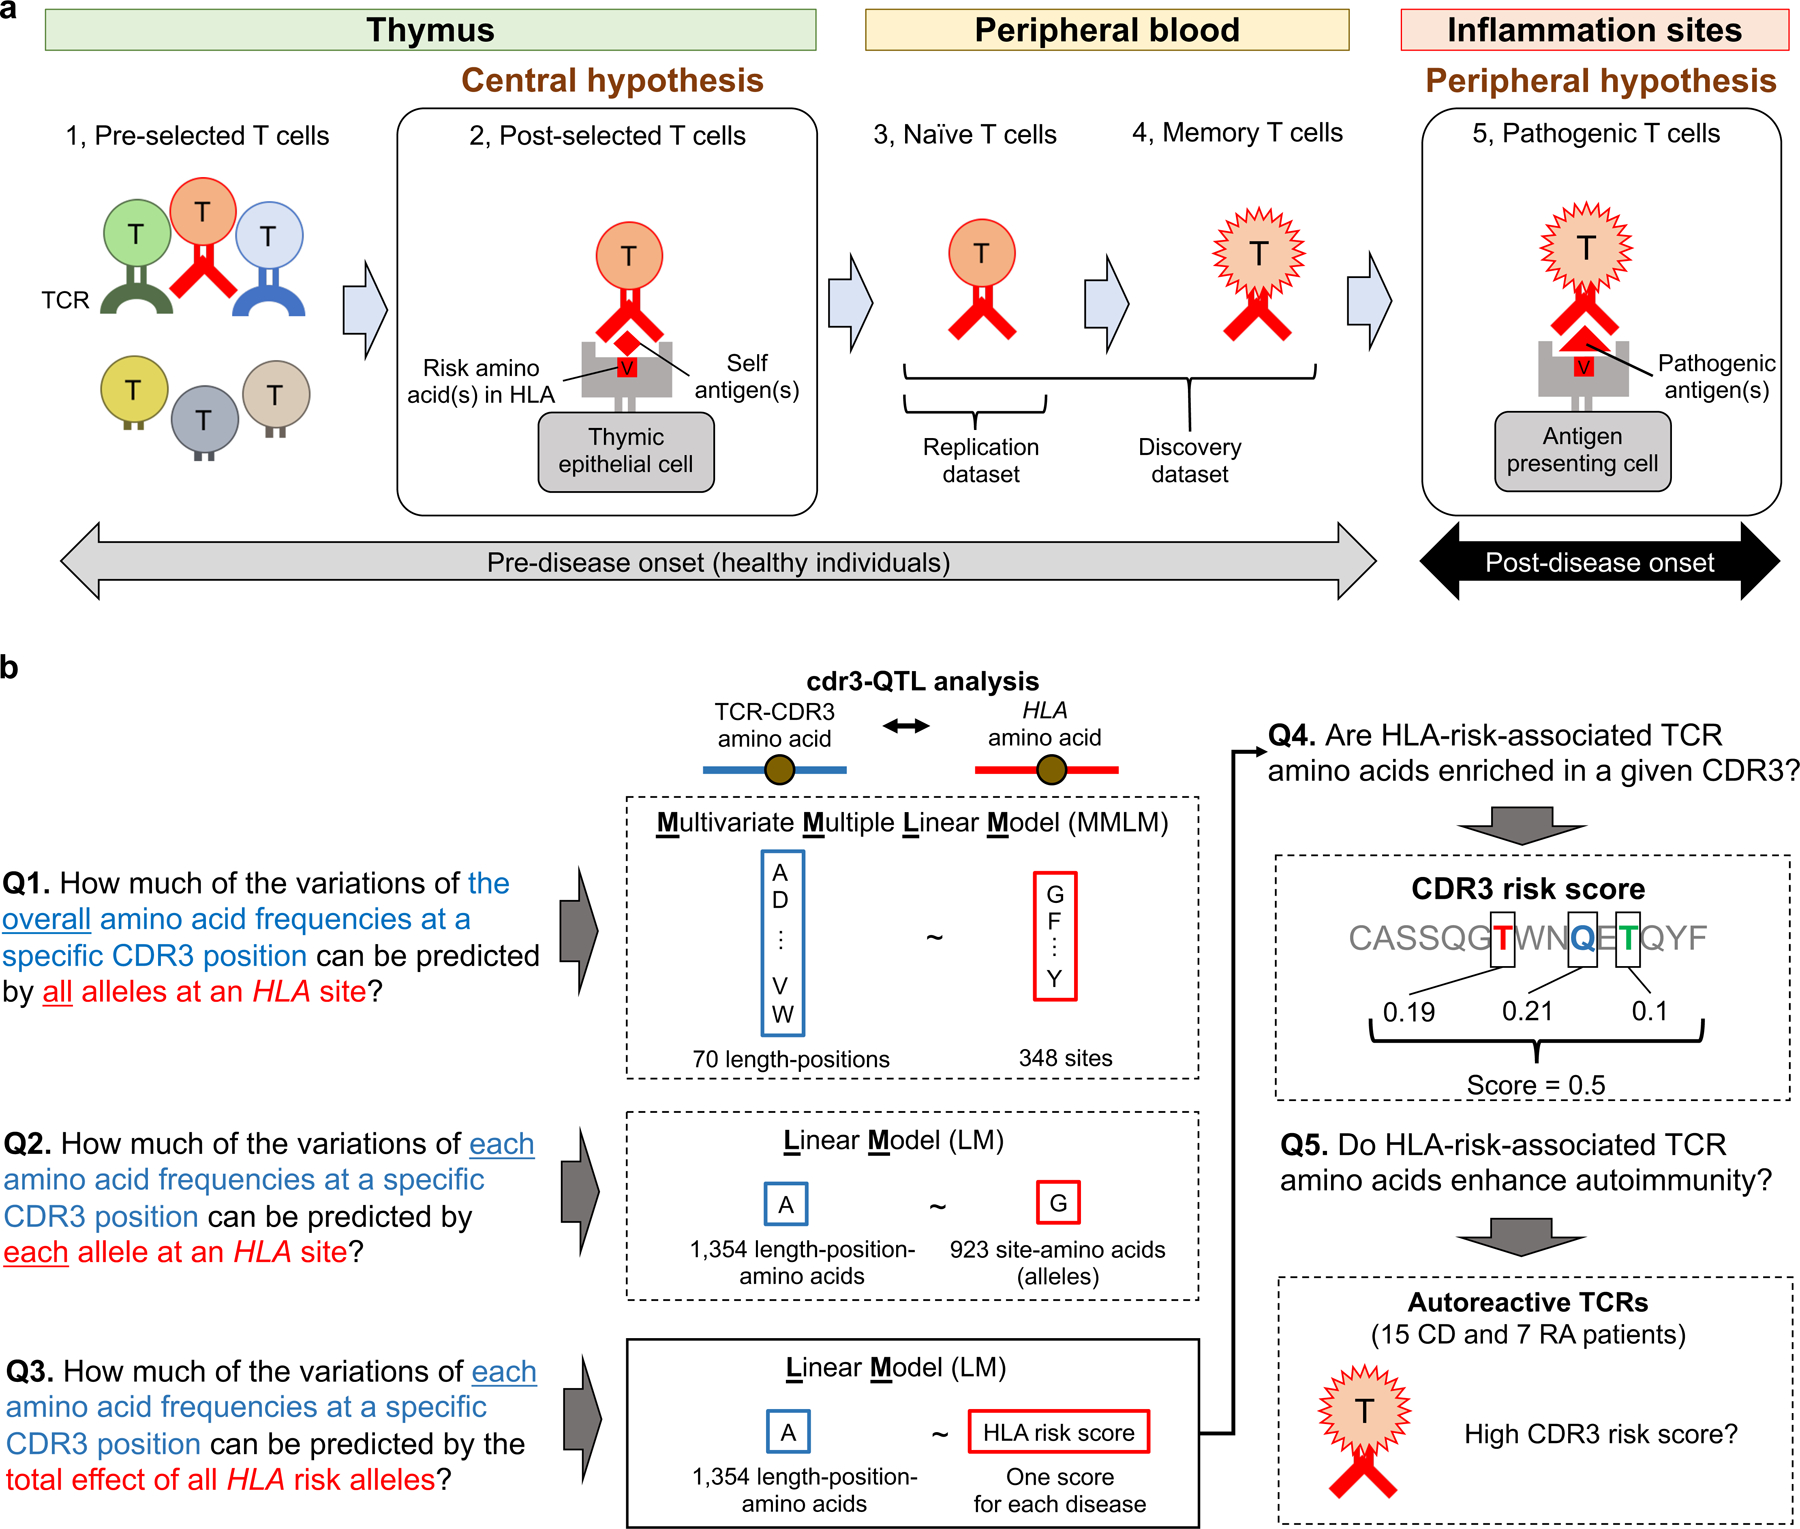
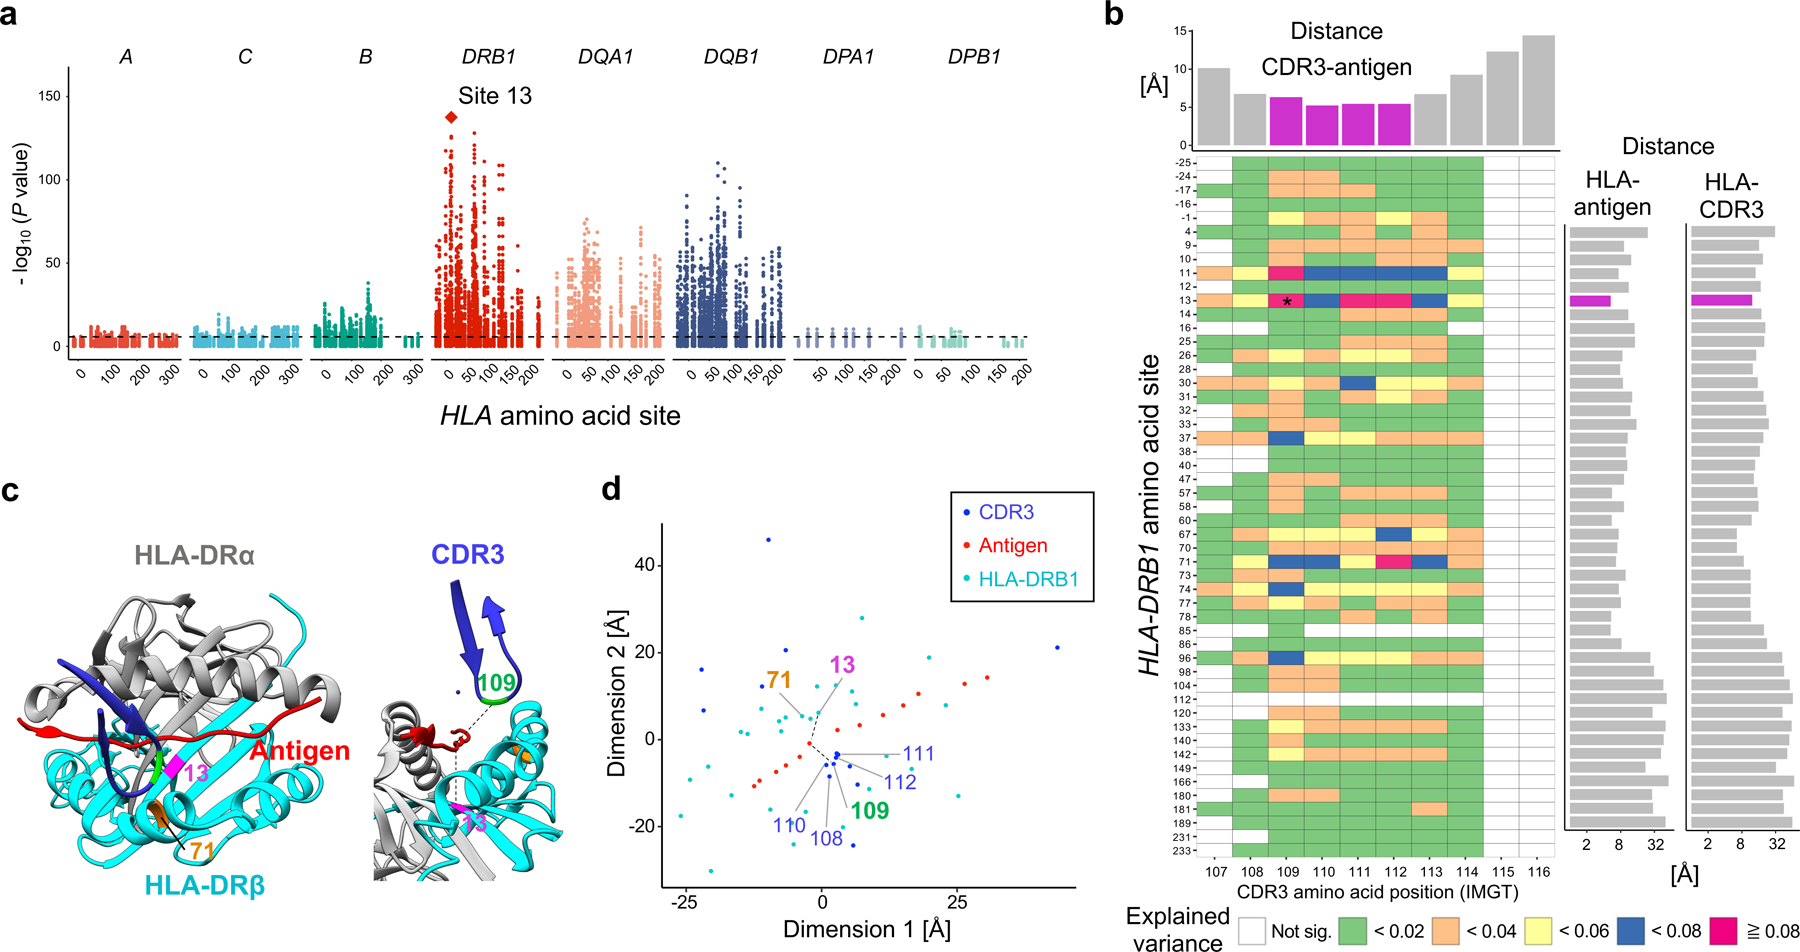
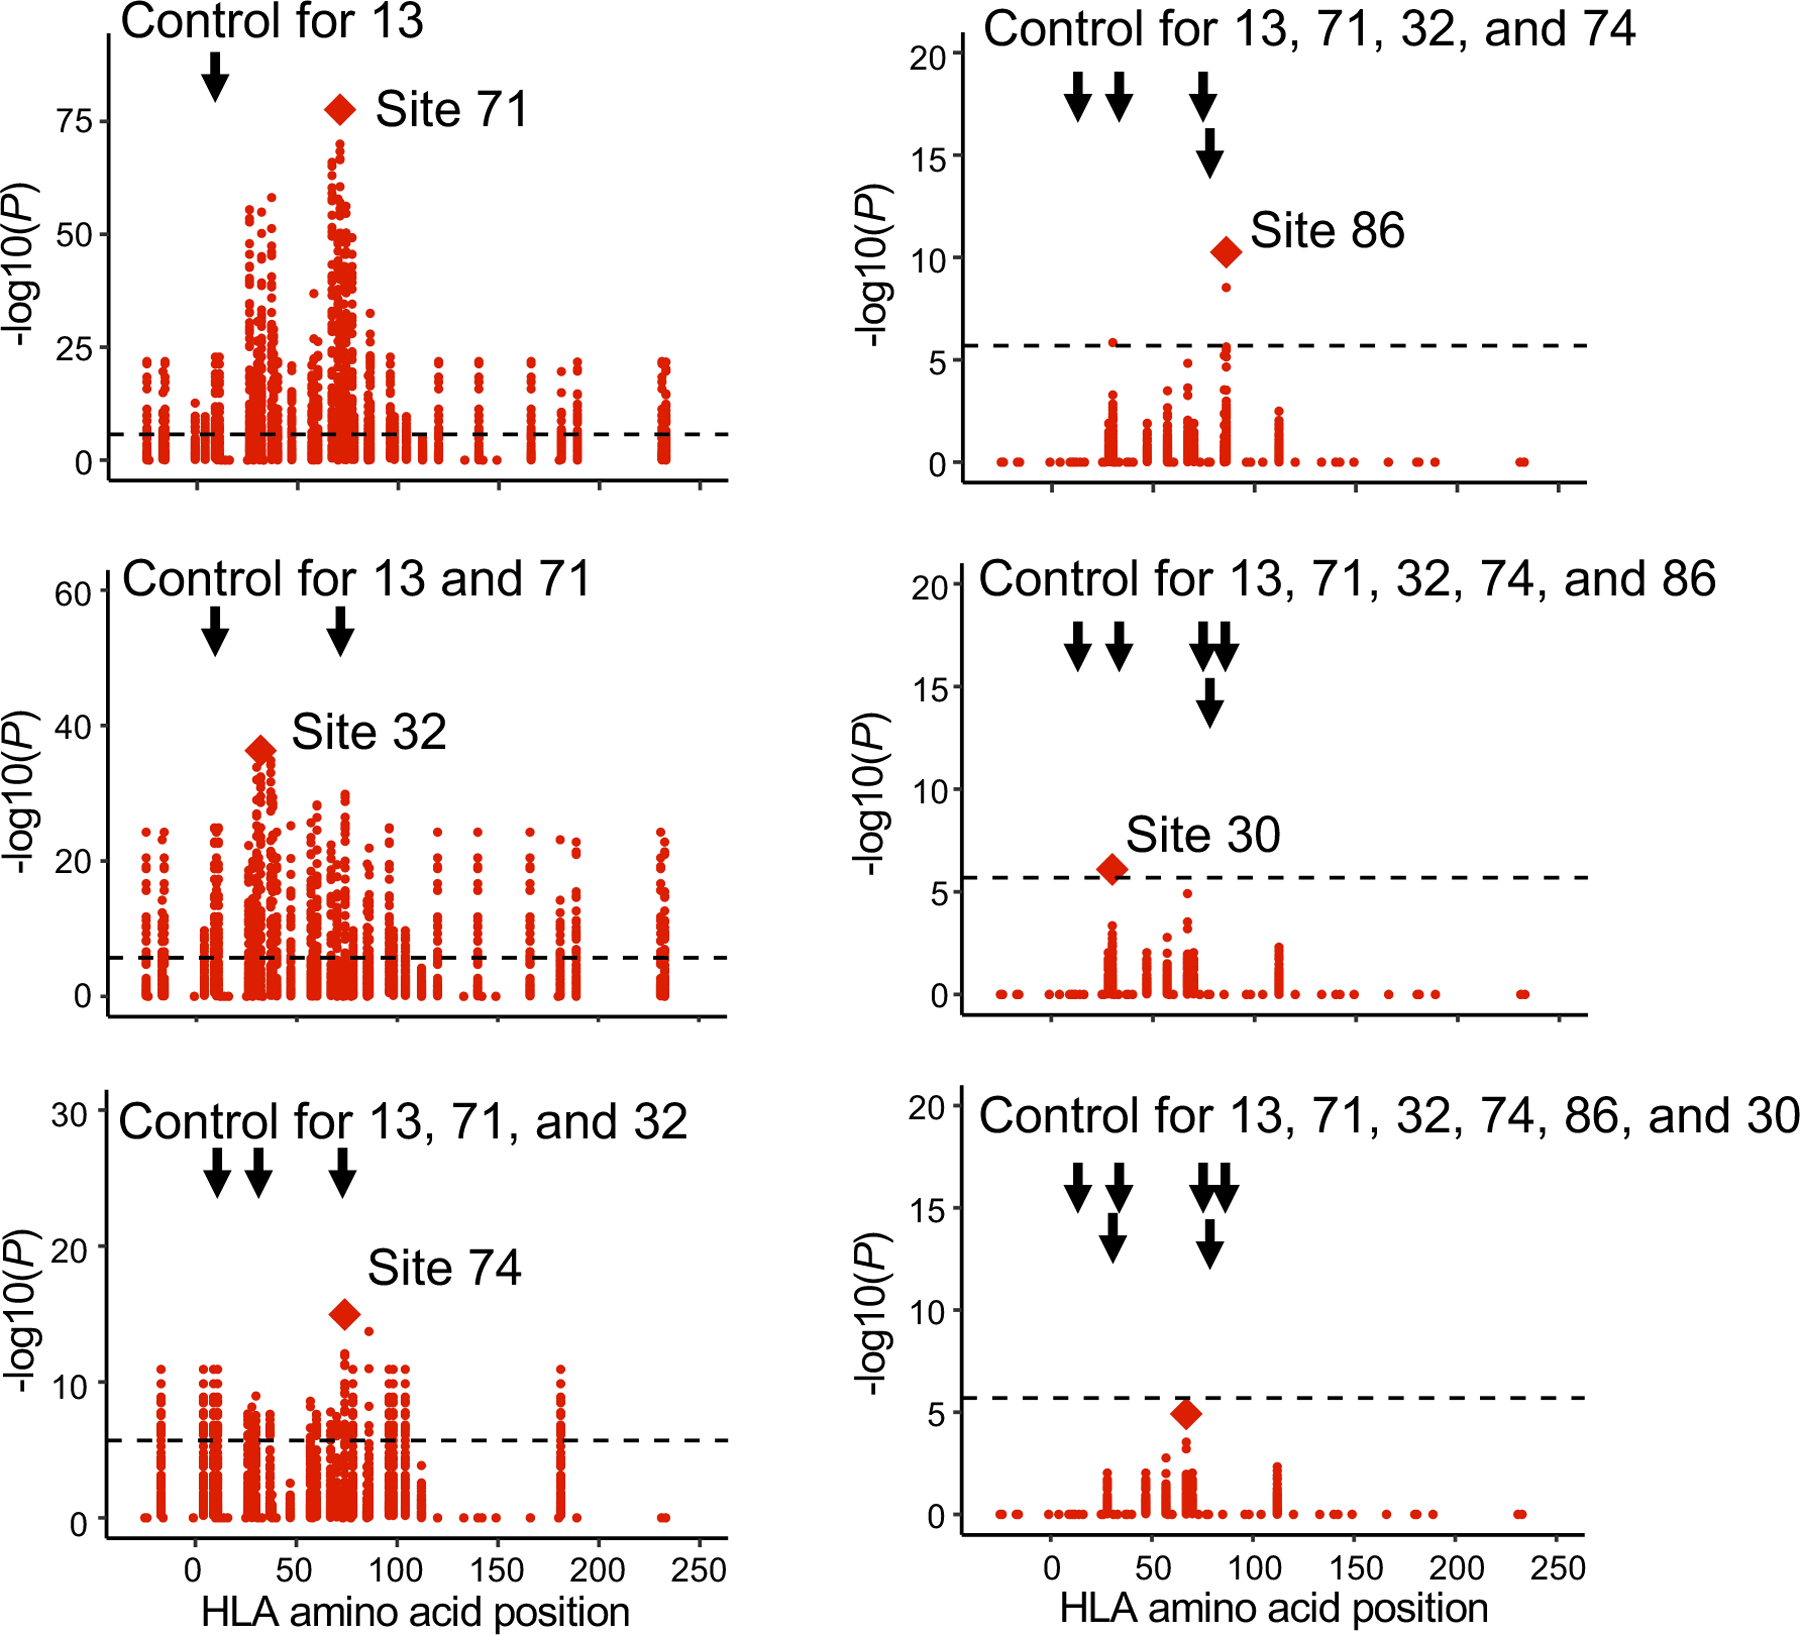
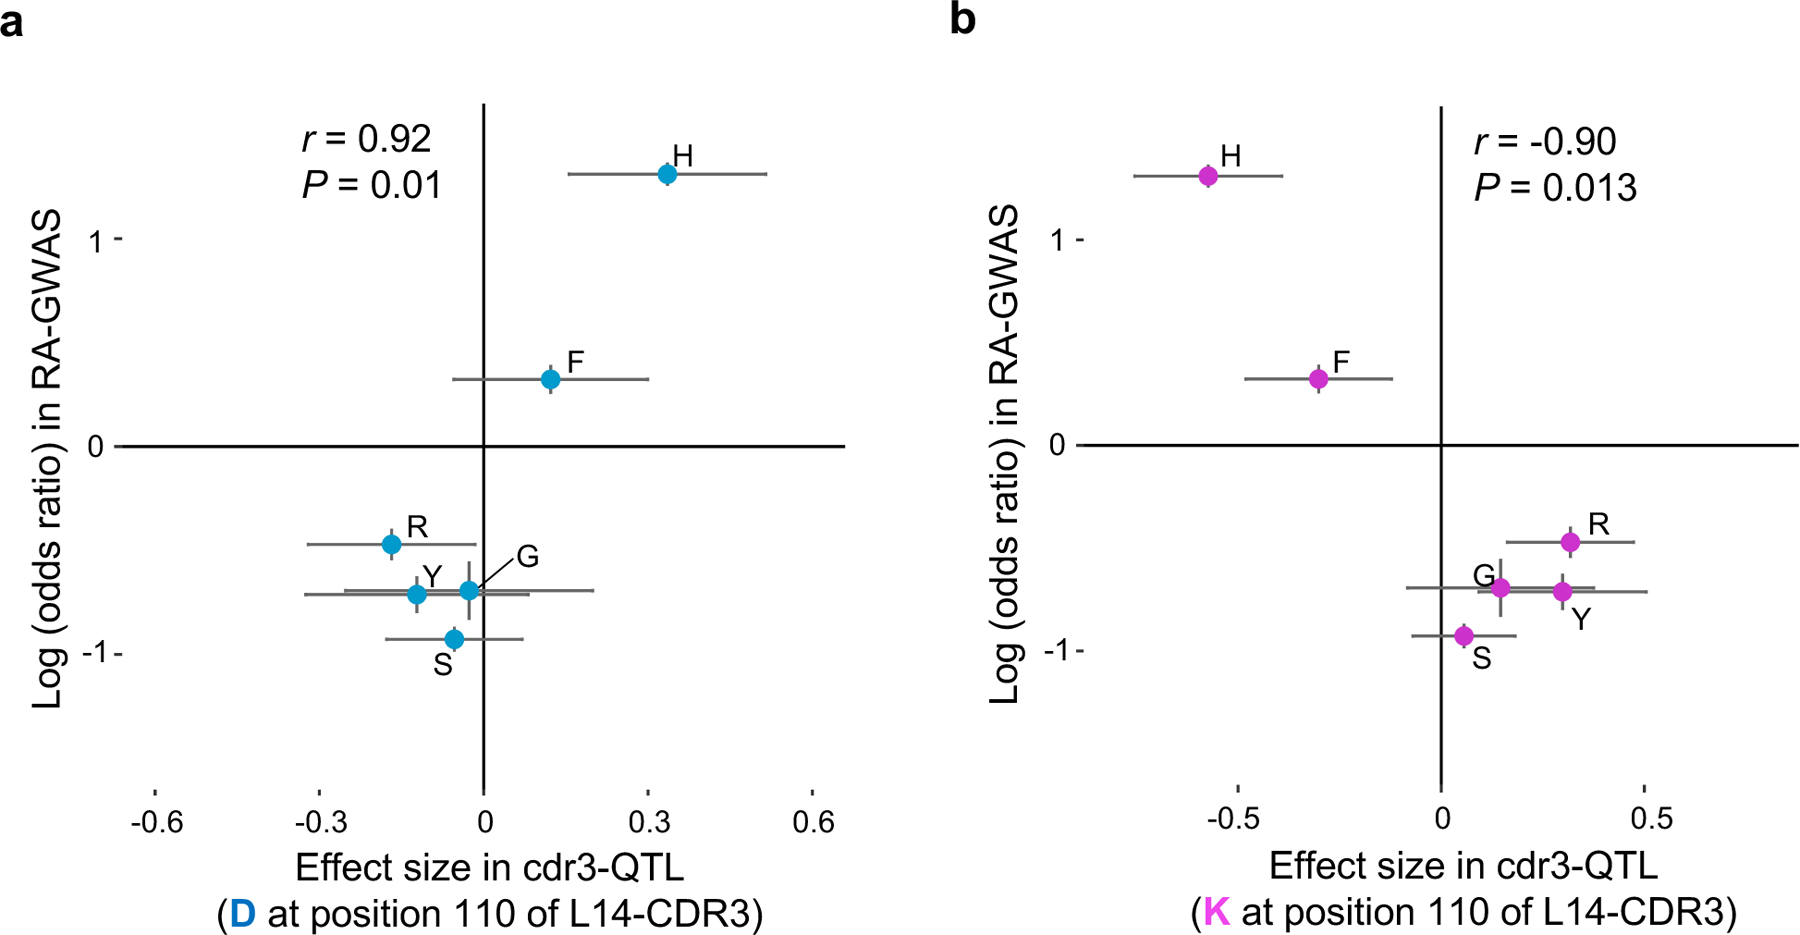
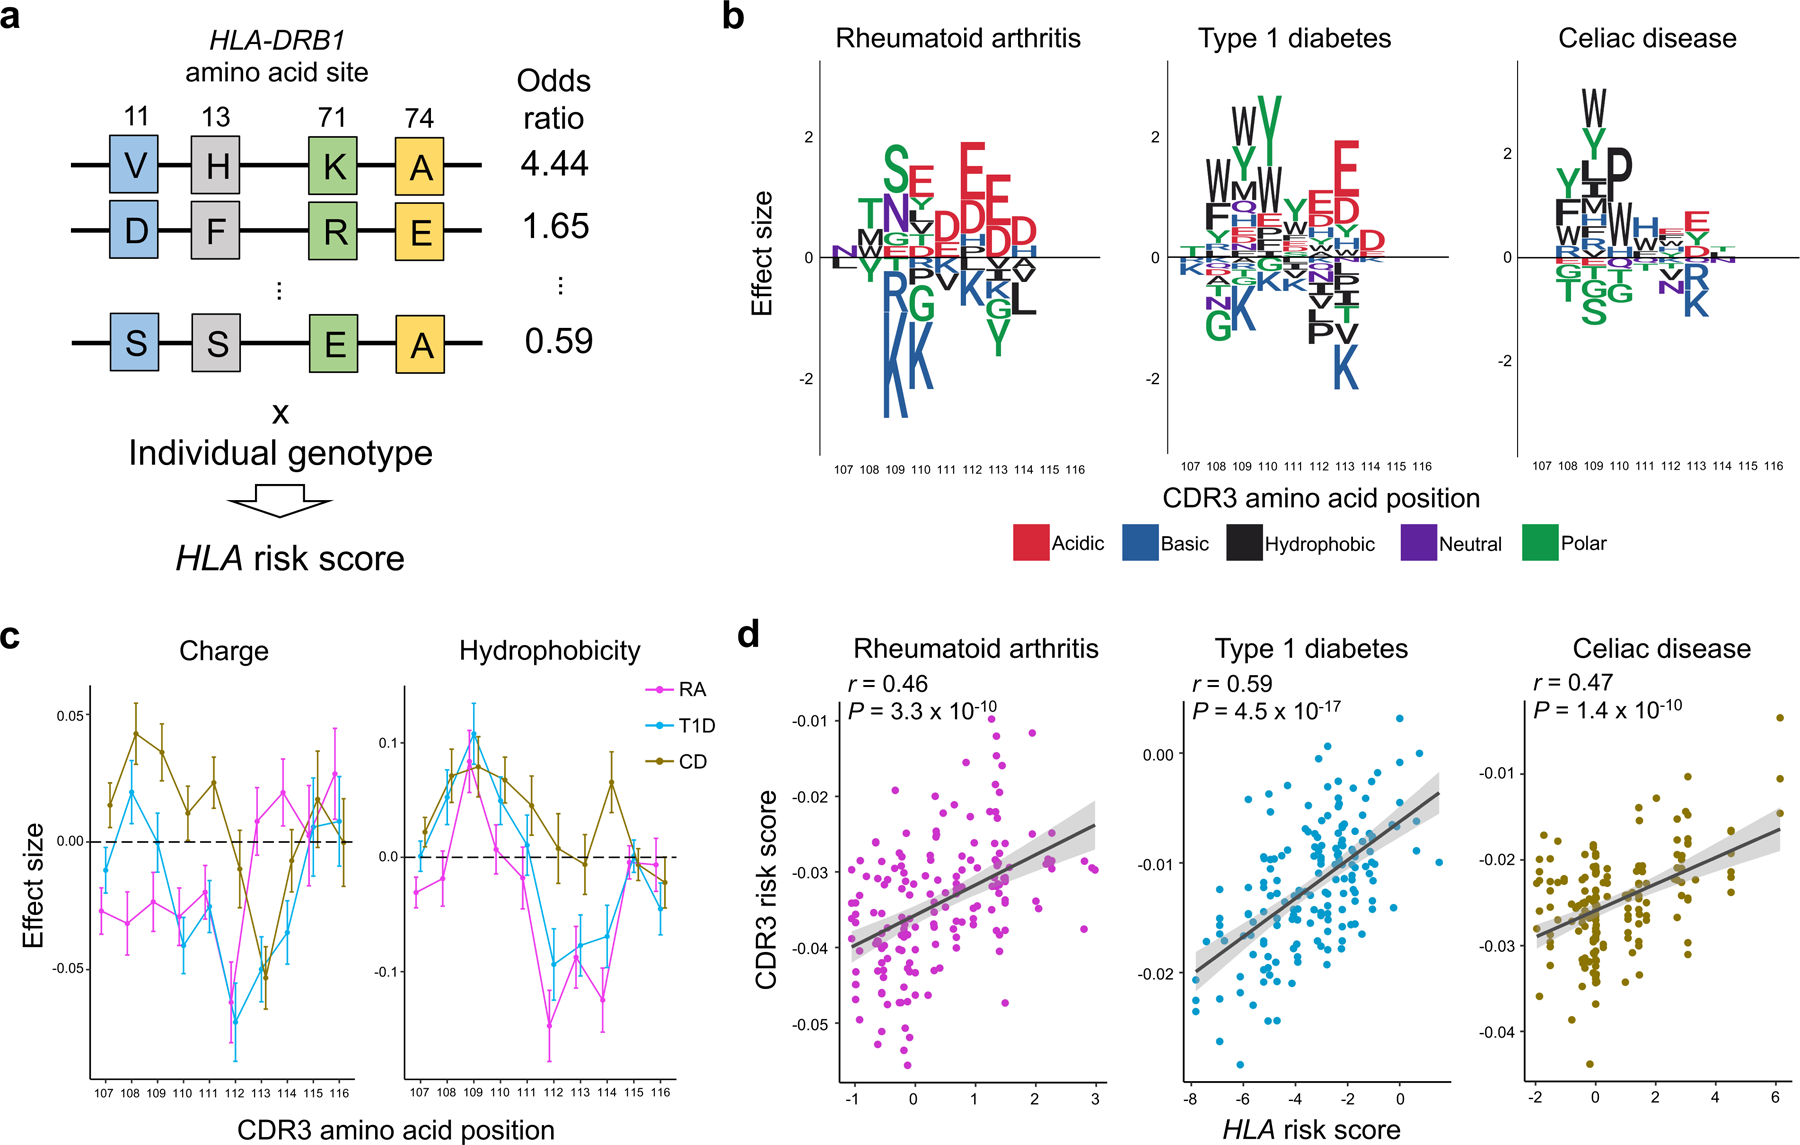
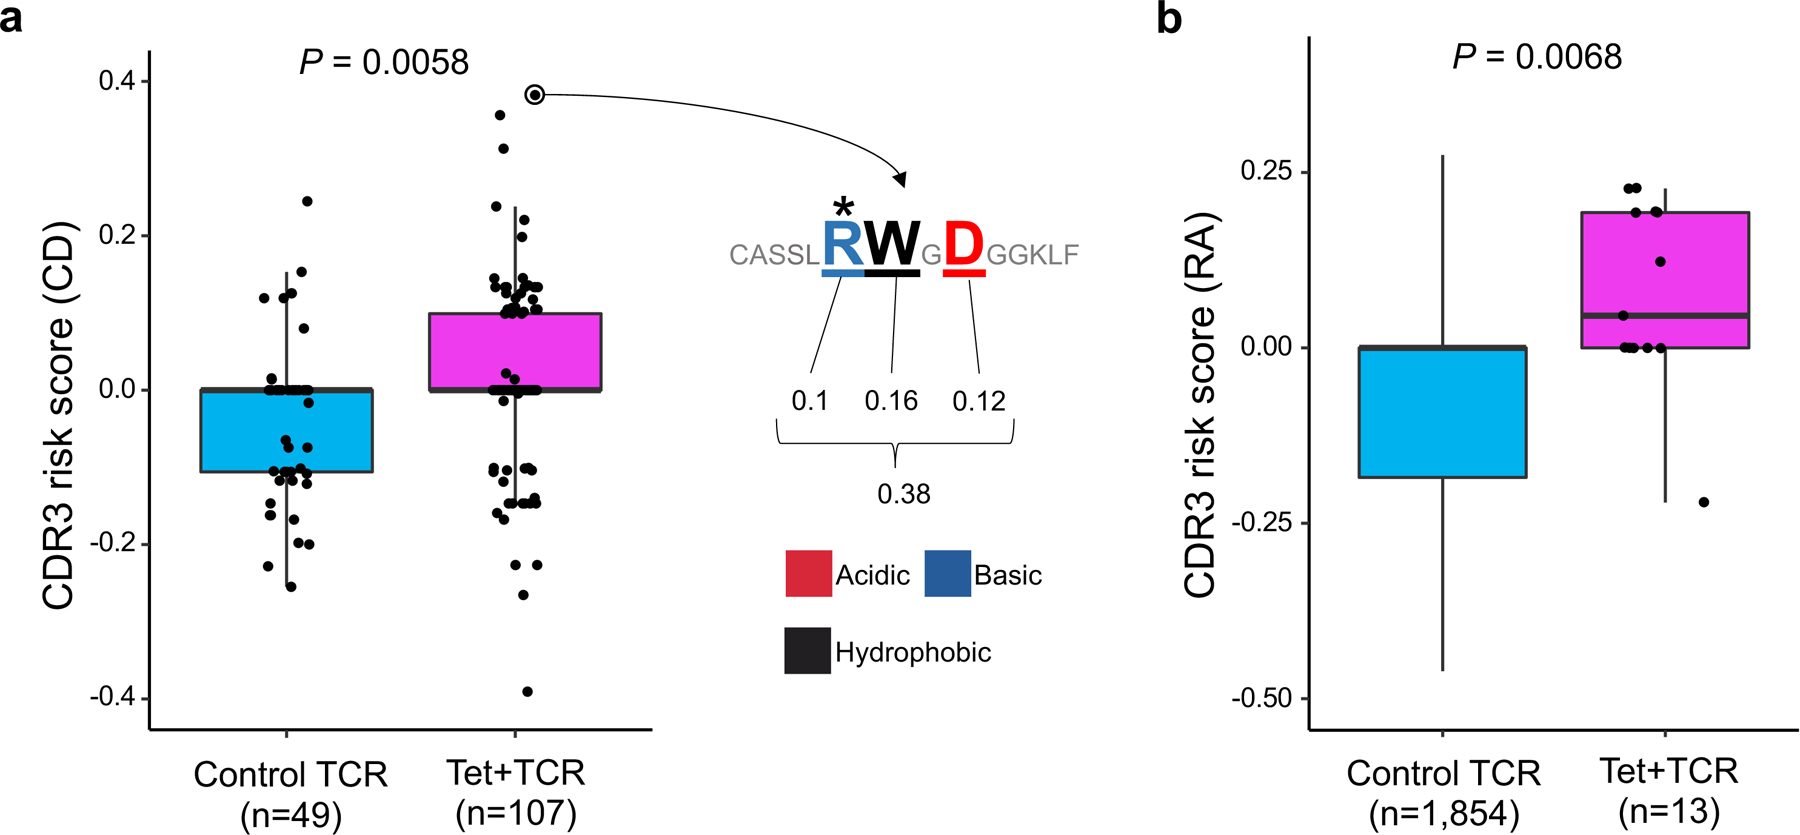
Polymorphisms in the human leukocyte antigen (HLA) genes strongly influence autoimmune disease risk. HLA risk alleles may influence thymic selection to increase the frequency of T cell receptors (TCRs) reactive to autoantigens (central hypothesis). However, research in human autoimmunity has provided little evidence supporting the central hypothesis. Here we investigated the influence of HLA alleles on TCR composition at the highly diverse complementarity determining region 3 (CDR3), which confers antigen recognition. We observed unexpectedly strong HLA-CDR3 associations. The strongest association was found at HLA-DRB1 amino acid position 13, the position that mediates genetic risk for multiple autoimmune diseases. We identified multiple CDR3 amino acid features enriched by HLA risk alleles. Moreover, the CDR3 features promoted by the HLA risk alleles are more enriched in candidate pathogenic TCRs than control TCRs (for example, citrullinated epitope-specific TCRs in patients with rheumatoid arthritis). Together, these results provide genetic evidence supporting the central hypothesis.


Conflict of interest statement

COMPETING INTERESTS

The authors declare no competing interests.

Figures

Extended Data Fig. 1
Extended Data Fig. 1. TCR structure in the discovery dataset.
a, The amino acid positioning scheme used in this study. Additional amino acids in longer CDR3s align to middle positions. b, Schematic explanation of the structure of CDR3. During T cell development in thymus, TCRs are generated by randomly recombining component genes (V, D, and J gene for beta chain). In addition, several nucleotides are randomly added or deleted at the junctional regions. c, The distribution of CDR3 amino acid length in the discovery dataset. d, The diversity and mutual information of amino acid composition at CDR3 positions (length = 15 amino acids). Normalized entropy (bar plot) and normalized mutual information (NMI, heatmap) of amino acid usage at each position of CDR3 and V/J gene usage were calculated in each individual, and the averaged values are provided. In the top heatmap, NMI is shown in a linear scale. In the bottom heatmap, NMI is shown in log scale. CDR3 positions 107–116, which directly contact antigenic peptides, are highlighted in red (b and d).
Extended Data Fig. 2
Extended Data Fig. 2. Statistical models used in this study.
a, Strategy to calculate amino acid frequencies in the main analysis. In this example, the alanine (A) usage ratio at CDR3 position 110 is calculated for each individual. b, Strategy to calculate amino acid frequencies for the linear mixed model (LMM) used to adjust the effect of V genes. In this example, alanine (A) usage ratio at CDR3 position 110 was calculated for each individual for each V gene. c, Schematic explanation of LM and MMLM, the two main linear models in this study. Each square indicates the dimensions of the matrix. In LM, the frequency of a single amino acid at a position of CDR3 is the response variable; the count of a single amino acid allele at a site of HLA is the explanatory variable. In MMLM, a vector of frequency of all amino acids at a given position of CDR3 is the response variable; the counts of all amino acid alleles except one at the HLA site are the explanatory variables. When we have 20 CDR3 phenotypes and the five HLA alleles, we need to conduct 100 LM tests to cover all combinations (as shown in d). On the other hand, MMLM model aggregates all 100 combinations into one single association test, maximizing the power of detecting associations. cov, covariates. d, On the left, we provide an association plot between the allele count of arginine (R) in HLA-DRB1 site 13 and the frequency of lysine (K) in position 109 of L13-CDR3. The P value from the LM analysis is provided (n = 628 donors; two-sided linear regression test). On the right, we provide a heatmap showing P values from all 100 LM tests. We also provide a heatmap showing the P values from a permuted dataset. Within each boxplot, the horizontal lines reflect the median, the top and bottom of each box reflect the interquartile range (IQR), and the whiskers reflect the maximum and minimum values within each grouping no further than 1.5 × IQR from the hinge.
Extended Data Fig. 3
Extended Data Fig. 3. Permutation analyses using the MMLM.
a, MANOVA test P values in cdr3-QTL analysis using the MMLM with permuted sample labels (n = 628; the discovery dataset). At each HLA site, P values of all CDR3 phenotypes are plotted. The black dashed line corresponds to the Bonferroni P value threshold (P = 0.05/24,360 total tests). b, QQ plots of MANOVA test P values in cdr3-QTL analysis using the MMLM with the real and the permuted sample labels (n = 628). Both have 24,360 data points. c, The distribution of minimum P values (Pmin) using the MMLM in each round of the 1,000 permutations (MANOVA test). We restricted this analysis to alleles at HLA-DRB1 site 13. In each round of permutation, we tested associations for all CDR3 positions (70 length-position combinations). The bottom 5 percentile of Pmin was 8.6 × 10⁻⁴, almost identical to the Bonferroni P value threshold (= 0.05/70 total tests = 7.1 × 10⁻⁴), which indicates that our P values are well calibrated. d, The distribution of variance in amino acid composition at position 109 of L13-CDR3 explained by the alleles at HLA-DRB1 site 13 in each round of the 1,000 permutations. Red vertical line denotes the observed variance explained in unpermuted data.
Extended Data Fig. 4
Variance explained in the MMLM analysis summarized across different lengths of CDR3. Variance explained in the MMLM analysis (n = 628; the discovery dataset). The results for all HLA genes except HLA-DRB1 are provided. For each HLA site-CDR3 position pair, the largest variance explained across different CDR3 lengths is shown in a heatmap.
Extended Data Fig. 5
Extended Data Fig. 5. MMLM and LM results in the replication dataset.
a, Explained variance in the MMLM analysis in the discovery dataset (n = 628; peripheral blood) compared with that in the replication dataset (n=169; naïve CD4+ T cells). All pairs of class II HLA sites and CDR3 phenotypes are shown without any filtering (9,735 data points). The results at HLA-DRB1 site 13 and the results with P < 0.05 in the replication dataset are highlighted. b, Explained variance in the MMLM analysis in the replication dataset (n = 169; naïve CD4+ T cells). For each HLA site-CDR3 position pair, the largest variance explained across different CDR3 lengths are shown in a heatmap. The results of HLA-DRB1 are provided. Only associations with P < 0.05 are colored in the heatmap. The results both for alpha and beta chains are provided. The pair with the largest variance is indicated by an asterisk. c, LM analysis using the replication dataset (n = 169; naïve CD4+ T cells). Effect sizes for non-transformed phenotypes from discovery and replication datasets are provided. The error bar indicates ± 2 × s.e. The nominally significant associations in the replication dataset are highlighted in red (P < 0.05). The analysis was restricted to the 388 CDR3 phenotypes (length-position-amino acid combinations) that had at least one significant association in the LM analysis (P < 0.05/1,249,742 total tests) and were testable in the replication dataset. For each CDR3 phenotype, we used the HLA amino acid allele that had the lowest P value for that phenotype in the LM analysis of the discovery dataset. We used P values from two-sided linear regression test.
Extended Data Fig. 6
Extended Data Fig. 6. Six sites in HLA-DRB1 have independently significant cdr3-QTL effects.
a, Structure of HLA-DRB1 protein and amino acid sites with independently significant cdr3-QTL effects (Protein database 2IAM). Positions 13, 71 and 74 are within the P4 binding pocket. On the left, we depict only HLA-DR molecules looking into the binding groove. In the middle, we depict the antigen (red) and CDR3 (dark blue) overlaid onto HLA-DR molecules. On the right, we depict HLA-DR, antigen, and CDR3 from a side view. b, Variance explained by six HLA-DRB1 amino acid sites with independently significant cdr3-QTL effects (n = 628; MMLM; the discovery dataset). The order of sites on the x-axis indicates the order of significance. c, The distances from HLA-DRB1 amino acid sites to antigen (Ag) or to CDR3. We analyzed five structures and the shortest distances in each structure were used. One-sided paired t test P values are provided (n = 5). Within each boxplot, the horizontal lines reflect the median, the top and bottom of each box reflect the interquartile range (IQR), and the whiskers reflect the maximum and minimum values within each grouping no further than 1.5 × IQR from the hinge.
Extended Data Fig. 7
Conditional analysis using four-digit classical alleles. Conditional analysis using four-digit classical alleles (n = 628; MMLM; the discovery dataset). In the first conditioning analysis, to assess whether there were independent effects outside of the HLA-DRB1 locus, we conducted cdr3-QTL analysis using all four-digit classical alleles of HLA-DRB1 as covariates, and the strongest signal was found in HLA-B region. In the second conditional analysis, we additionally included all four-digit classical alleles of HLA-B as covariates. We sequentially included as covariates all four-digit classical alleles of the gene with the strongest signal until we did not observe further significant signal (P > 0.05/24,360 total tests). We excluded strongly correlated alleles among covariates (r2 > 0.8). We reported MANOVA test P values.
Extended Data Fig. 8
The pair-wise distances of amino acids in MHC-peptide-TCR complexes. The distances (in Å) between HLA-DRB1 sites and antigen (left), CDR3 amino acids of beta chains and antigen (middle), and HLA-DRB1 sites and CDR3 amino acids of beta chains (right) are shown in heatmaps.
Extended Data Fig. 9
CDR3 amino acids associated with MHC-wide risk of RA, T1D, and CD. CDR3 amino acids influenced by HLA risk score. We conducted the LM analysis using HLA risk score; the CDR3 phenotypes were each amino acid at each position of each length of CDR3 (n = 628; the discovery dataset). a-c, The effect sizes of significant associations for each amino acid at a given position are illustrated by sequence logo (P < 0.05/1,354 total test), separately for different CDR3 lengths (a, RA; b, T1D; and c, CD). We used P values from two-sided linear regression test.
Extended Data Fig. 10
Amino acid features at each position of CDR3 influenced by HLA risk score. We conducted the LM analysis using HLA risk score in which the phenotypes were amino acid features at a given position of each length of CDR3 (n = 628; the discovery dataset). a, Effect sizes were plotted separately for different lengths of CDR3. Within each boxplot, the horizontal lines reflect the median, the top and bottom of each box reflect the interquartile range (IQR), and the whiskers reflect the maximum and minimum values within each grouping no further than 1.5 x IQR from the hinge. b, Meta-analyzed effect sizes were plotted (the results for charge and hydrophobicity are shown in Fig. 6c). The error bar indicates ± 2 × s.e.
Figure 1 |
Figure 1 |. Underlying hypotheses and overview of our study.
a, Pathogenic roles of HLA in autoimmune disease can be explained by two non-exclusive hypotheses: the central hypothesis and the peripheral hypothesis. This figure illustrates five T cell maturation phases: (1) thymic T cells pre-selection (during T cell development in the thymus, a highly diverse TCR repertoire is generated), (2) thymic T cells post-selection, (3) naïve T cells in the peripheral blood, (4) memory T cells in the peripheral blood, and (5) pathogenic T cells in sites of inflammation. In the central hypothesis, HLA proteins encoded by risk alleles allow more autoreactive TCRs (in red) to survive thymic selection (phase 2). In the peripheral hypothesis, HLA proteins encoded by risk alleles have a higher affinity to critical autoantigens, and therefore can more efficiently induce autoimmunity (phase 5). Using non-productive CDR3s, which experience no thymic selection pressure, we can observe T cell biology in phase 1. Using peripheral blood data, we can observe T cell biology in phases 3 and 4. b, Study overview. We asked five major questions and conducted cdr3-QTL analysis using different models in both discovery and replication datasets (n = 797 donors in total). We conducted downstream investigations using the cdr3-QTL results, which include application of CDR3 risk score (a score indicating the enrichment of CDR3 features favored by HLA risk alleles) to clinical TCR repertoire datasets (n = 22 patients in total). CD, celiac disease; RA, rheumatoid arthritis.
Figure 2 |
Figure 2 |. HLA-DRB1 site 13 strongly influences CDR3 amino acid composition.
a, MANOVA test P values in the MMLM analysis (n = 628; the discovery dataset). At each HLA site, P values for all CDR3 phenotypes are plotted. The HLA site with the lowest P value (HLA-DRB1 site 13) is highlighted by a diamond. The dashed line indicates the significance threshold with the Bonferroni multiple testing correction (P < 0.05/24,360 total tests). b, Variance explained in the MMLM analysis (n = 628; the discovery dataset). For each HLA site-CDR3 position pair, the largest variance explained across all CDR3 lengths is depicted in a heatmap. Here we show all polymorphic sites of HLA-DRB1 (other HLA genes are in Extended Data Fig. 4). The pair with the largest variance is indicated by an asterisk. Above the heatmap, we present the shortest distance between each CDR3 position and any antigenic peptide residue; middle positions of CDR3 are highlighted in magenta. On the right of the heatmap, we present the shortest distance between each HLA-DRB1 site and any antigenic peptide residue (the left bar plot) and that between each HLA-DRB1 site and any CDR3 position (the right bar plot); site 13 is highlighted in magenta. Distances were averaged across the five X-ray crystallography structures (Methods). c, Structure of HLA-DR, the antigenic peptide, and CDR3 (Protein Data Bank 2IAM). HLA-DRB1 sites 13 and 71 and CDR3 position 109 are highlighted in magenta, orange, and green, respectively. On the left, we depict the antigen (red) and the beta chain CDR3 (dark blue) overlaid onto HLA-DR molecules, looking into the binding groove. On the right, we depict the same complex from a side view. The shortest paths between site 13 and antigenic peptide and those between position 109 to antigenic peptide were shown in black lines. d, Two-dimensional embedding plot based on the pairwise distances between amino acids of HLA-DRB1, the CDR3 loop, and the antigenic peptide. We down-weighted the distances between HLA and CDR3 so that their antigen-mediated indirect interaction was highlighted (Methods). The shortest paths between site 13 and antigenic peptide and those between position 109 and antigenic peptide are shown in black lines as in c; the paths are well preserved in this embedding.
Figure 3 |
Figure 3 |. The results of conditional haplotype analysis.
Conditional haplotype analysis within HLA-DRB1 (n = 628; MMLM; the discovery dataset). To detect independent cdr3-QTL signals within HLA-DRB1, we conducted a conditional haplotype analysis using MMLM by controlling all effects coming from specific sites of HLA-DRB1 gene. The strongest cdr3-QTL signal was found at site 13 of HLA-DRB1. Therefore, in the first round of the conditional analysis, we conducted cdr3-QTL analysis by controlling the effects coming from site 13. The null model consisted of haplotypes defined only by residues at site 13. The full model consisted of haplotypes defined by the combination of residues at site 13 and the target site; addition of the target site may result in k additional unique haplotypes. We tested whether the creation of k additional haplotype groups improved the model fit. In this analysis, the strongest signal was found at site 71 of HLA-DRB1. Therefore, in the second round of the conditional analysis, we conducted cdr3-QTL analysis by controlling all effects coming from site 13 and 71. We repeated these processes sequentially within HLA-DRB1 until we did not observe further significant signals (P > 0.05/24,360 total tests). We reported MANOVA test P values.
Figure 4 |
Figure 4 |. cdr3-QTL effects were not observed for non-productive CDR3 and attenuated by clonal expansion.
a, QQ plot of the MMLM analysis in three different settings (n = 628; the discovery dataset): (1) associations with productive CDR3 sequences (the primary analysis, in red), (2) productive CDR3 sequences down-sampled to match the number of non-productive sequences (in green), and (3) non-productive CDR3 sequences (in blue). We reported MANOVA test P values. b, Z score comparison between the LM analyses using productive (the primary analysis) and those using non-productive CDR3 (n = 628; the discovery dataset). c, QQ plot of the MMLM analysis in two different settings (n = 628; the discovery dataset): (1) not considering clone size (the primary analysis, in red), and (2) weighting observations by clone size when calculating CDR3 amino acid frequencies (blue). We reported MANOVA test P values. d, Z score comparison between the LM analyses with and without clone-size weight (n = 628; the discovery dataset). The analyses in b and d were restricted to the 388 CDR3 phenotypes (length-position-amino acid combinations) that had at least one significant association in the primary LM analysis (P < 0.05/1,249,742 total tests; the discovery dataset) and the HLA amino acid allele that had the lowest P value for that phenotype. We used P values from two-sided linear regression test.
Figure 5 |
Figure 5 |. Negative charge at CDR3 position 110 might be involved in the pathogenesis of RA.
a, The cdr3-QTL effect sizes in the LM analysis for aspartic acid (D) usage at position 110 of L14-CDR3 for the six possible amino acids at HLA-DRB1 site 13 (n = 628; the discovery dataset; linear regression test) plotted against their effect size (log of odds ratio) in RA-GWAS. The error bar indicates ± 2 × s.e. Pearson’s r is provided. b, The same plot as in a but for lysine (K).
Figure 6 |
Figure 6 |. CDR3 amino acid patterns influenced by HLA risk for RA, T1D, and CD.
a, Strategy to quantify per-individual MHC-wide risk of autoimmune diseases (HLA risk score) based on effect size estimates of disease-associated HLA haplotypes in previous studies. Haplotypes are depicted as joint amino acid assignments for the polymorphic sites in HLA-DRB1 (rows). The effect size (logarithm of odds ratio) for each haplotype is multiplied by the individual’s haplotype count (0, 1, 2, if the individual is null, heterozygous, or homozygous, respectively) to compute the HLA risk score. b, CDR3 amino acids influenced by HLA risk score for RA, T1D and CD. We conducted the LM analysis using the HLA risk score for each of these diseases separately, testing for differential usage of each amino acid at each position of each length CDR3 (n = 628; the discovery dataset). To create a sequence logo for each disease, the effect sizes of significant associations for each amino acid at a given position were summed across L12-L18 CDR3s (P < 0.05/1,354 total test). We used P values from two-sided linear regression test. c, CDR3 amino acid features influenced by HLA risk score. We conducted the LM analysis using HLA risk score for RA, T1D, and CD; the CDR3 phenotypes were amino acid features at each position of each length CDR3 (n = 628; the discovery dataset). The effect sizes for each feature at a given position were meta-analyzed across different lengths of CDR3 using a fixed effect model and the meta-analyzed effect sizes of two features are provided. The error bar indicates ± 2 × s.e. (see Extended Data Fig. 10 for other features). d, The correlation between HLA risk score and CDR3 risk score in the replication dataset for RA, T1D, and CD (n = 169; naïve CD4+ T cells). The error bands indicate 95% confidence interval for predictions from a fitted linear model. Pearson’s r is provided.
Figure 7 |
Figure 7 |. Pathogenic CD4+ T cells possess high CDR3 risk score.
a, CD-CDR3 risk scores of TCRs reactive to gliadin epitopes and control TCRs. Seven TCRs specific to α-I gliadin (n = 4 patients), 92 TCRs specific to α-II gliadin (n = 13 patients), eight TCRs specific to ω-II gliadin (n = 2 patients), and 49 control TCRs (n = 3 patients) were analyzed. An illustration of CDR3 risk score calculation is provided for the CDR3 sequence with the highest score: effect sizes of CDR3 amino acids with a significant association to CD-HLA risk score (three amino acids of this sequence) are summed. Arginine (R) at position 109 (*) is known to be important for the recognition of α-II gliadin. One-sided t test P values are provided. b, RA-CDR3 risk scores of TCRs reactive to citrullinated epitopes and control TCRs. Six TCRs specific to citrullinated aggrecan (n = 5 patients), five TCRs specific to citrullinated CILP (n = 2 patients), one TCR specific to citrullinated vimentin (n = 1 patient), and one TCR specific to citrullinated enolase (n = 1 patient) were analyzed. We collected 1,753 control TCR sequences from an individual homozygous for HLA-DRB1*0401, the HLA-DRB1 allele with the highest risk for RA (Methods). One-sided t test P values are provided. Within each boxplot, the horizontal lines reflect the median, the top and bottom of each box reflect the interquartile range (IQR), and the whiskers reflect the maximum and minimum values within each grouping no further than 1.5 × IQR from the hinge.

Comment in

Similar articles

Cited by

References

    1. Raychaudhuri S et al. Five amino acids in three HLA proteins explain most of the association between MHC and seropositive rheumatoid arthritis. Nat. Genet 44, 291–296 (2012). - PMC - PubMed
    1. Hu X et al. Additive and interaction effects at three amino acid positions in HLA-DQ and HLA-DR molecules drive type 1 diabetes risk. Nat. Genet 47, 898–905 (2015). - PMC - PubMed
    1. Okada Y et al. Genetics of rheumatoid arthritis contributes to biology and drug discovery. Nature 506, 376–381 (2014). - PMC - PubMed
    1. Lenz TL et al. Widespread non-additive and interaction effects within HLA loci modulate the risk of autoimmune diseases. Nat. Genet 47, 1085–1090 (2015). - PMC - PubMed
    1. Gutierrez-Achury J et al. Fine mapping in the MHC region accounts for 18% additional genetic risk for celiac disease. Nat. Genet 47, 577–578 (2015). - PMC - PubMed

METHODS-ONLY REFERENCES

    1. James EA et al. Citrulline-specific Th1 cells are increased in rheumatoid arthritis and their frequency is influenced by disease duration and therapy. Arthritis Rheumatol 66, 1712–1722 (2014). - PMC - PubMed
    1. Rims C et al. Citrullinated aggrecan epitopes as targets of autoreactive CD4+ T cells in patients with rheumatoid arthritis. Arthritis Rheumatol 71, 518–528 (2019). - PMC - PubMed
    1. Cerosaletti K et al. Single-cell RNA sequencing reveals expanded clones of islet antigen-reactive CD4+ T cells in peripheral blood of subjects with type 1 diabetes. J. Immunol 199, 323–335 (2017). - PMC - PubMed

Publication types

MeSH terms