. 2022 Apr;29(4):320-328.
doi: 10.1038/s41594-022-00743-5. Epub 2022 Mar 24.

Bound nucleotide can control the dynamic architecture of monomeric actin

Affiliations

Bound nucleotide can control the dynamic architecture of monomeric actin

Rustam Ali et al. Nat Struct Mol Biol. 2022 Apr.

Abstract

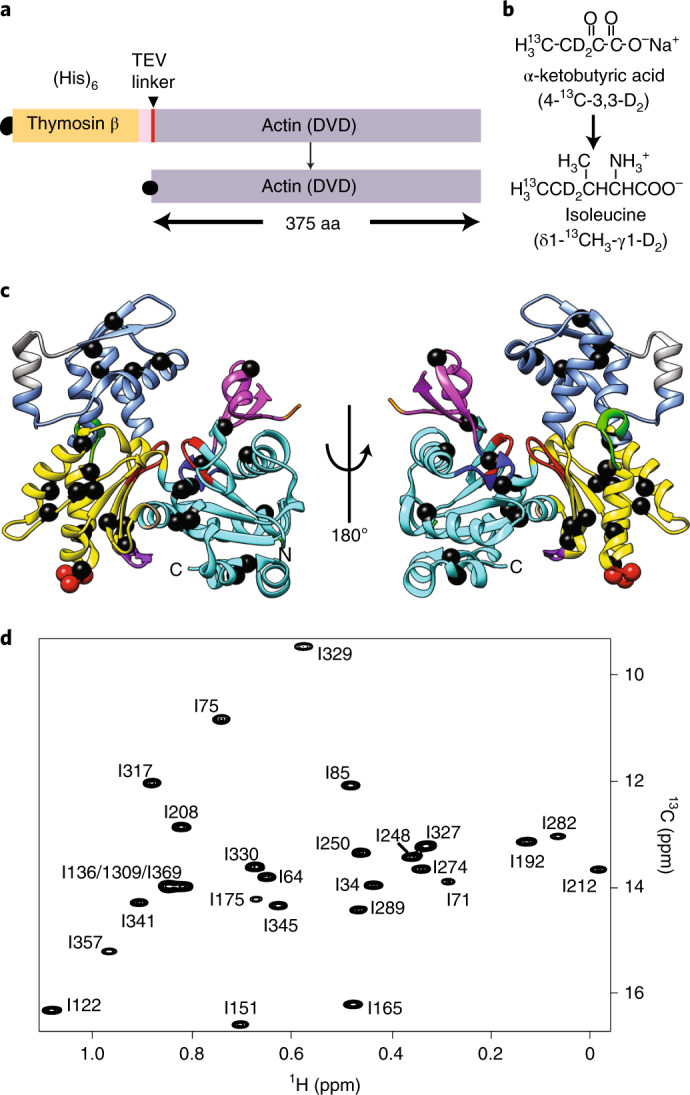
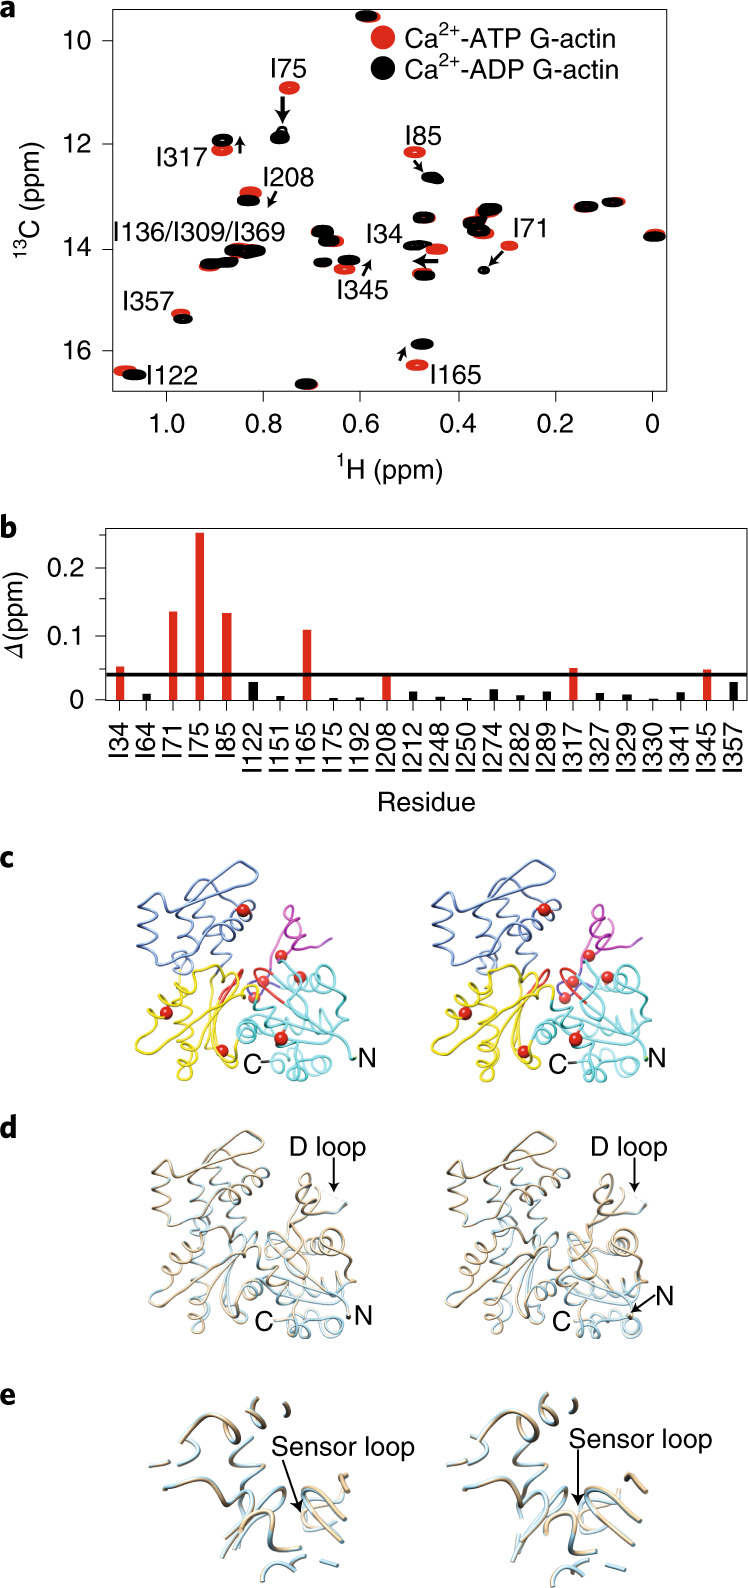
Polymerization of actin into cytoskeletal filaments is coupled to its bound adenine nucleotides. The mechanism by which nucleotide modulates actin functions has not been evident from analyses of ATP- and ADP-bound crystal structures of the actin monomer. We report that NMR chemical shift differences between the two forms are globally distributed. Furthermore, microsecond-millisecond motions are spread throughout the molecule in the ATP form, but largely confined to subdomains 1 and 2, and the nucleotide binding site in the ADP form. Through these motions, the ATP- and ADP-bound forms sample different high-energy conformations. A deafness-causing, fast-nucleating actin mutant populates the high-energy conformer of ATP-actin more than the wild-type protein, suggesting that this conformer may be on the pathway to nucleation. Together, the data suggest a model in which differential sampling of a nucleation-compatible form of the actin monomer may contribute to control of actin filament dynamics by nucleotide.


Conflict of interest statement

M.K.R. is a founder of Faze Medicines. R.A. and J.A.Z. declare no competing interests.

Figures

Fig. 1
Fig. 1. High-quality methyl TROSY NMR spectrum and sequence-specific isoleucine δ1-methyl chemical shift assignments of non-polymerizable (DVD) G-actin.
a, Cartoon representation of TEV protease cleavable, (His)6-tagged DVD G-actin fused with thymosin β4. aa, amino acid. b, δ1 13C-methyl labeling of isoleucine in P. pastoris using precursor α-ketobutyrate (4-13C-3,3-D2) (Methods). c, Ribbon diagram of G-actin (PDB 2HF4) showing isoleucine residues as black spheres. Elements of actin are colored as follows: SD1, cyan; SD2, magenta; SD3, yellow; SD4, corn blue; P1 and P2 nucleotide binding loops, red; sensor loop, blue; hydrophobic plug, green; WH2 binding motif in the hydrophobic groove, violet. Sites in SD3 mutated to block polymerization (D286A/V287A/D288A) are shown as red spheres. d, 1H/13C methyl TROSY NMR spectrum of perdeuterated, 1H/13C-Ile δ1-methyl-labeled G-actin showing assigned isoleucine residues (Extended Data Fig. 1).
Fig. 2
Fig. 2. Chemical shift changes due to the nucleotide switch propagate throughout G-actin.
a, Overlaid 1H/13C methyl TROSY NMR spectra of Ca2+-actin in the ATP- (red) and ADP-bound (black) forms. b,c, Chemical shift differences (Δ = [(δ1Η)2 + (0.25 × δ13C)2]1/2) between the ATP- and ADP-bound forms of actin. Residues showing Δ > 0.04 ppm (black line) are colored red (b), and are labeled in a and shown as red spheres in the wire representation of G-actin (PDB 2HF4) (c). SDs are colored as in Fig. 1c. d,e, Comparison of AP mutant G-actin crystal structures in the ATP- (PDB 2HF4; cyan) and ADP-bound (PDB 2HF3; wheat) forms (d). The structures in the two states are nearly identical except in the sensor loop region with an overall backbone r.m.s.d. of 0.23 Å (e). Panels ce show stereo views.
Fig. 3
Fig. 3. Microsecond–millisecond dynamics measurements of Ca2+-ATP and -ADP-actin.
ad, Representative relaxation dispersion profiles (effective relaxation rate R2eff versus CPMG frequency) for isoleucine residues in SD1 (a), SD2 (b), SD3 (c) and SD4 (d). In all panels, data recorded at 600-MHz and 800-MHz field strengths are shown in black and red, respectively. MQ data (columns 1 and 3) report on the chemical exchange experienced by both 1H and 13C nuclei, whereas SQ data (column 2 and 4) report on the chemical exchange experienced by 1H only. Error bars represent s.d., calculated from the two and three replicated data points for 600- and 800-MHz data, respectively.
Fig. 4
Fig. 4. G-actin has a different dynamic architecture in its ATP- and ADP-bound forms.
ac, Isoleucine residues with MQ or 1H SQ relaxation dispersion > 2 Hz mapped onto the G-actin structure in the ATP- (left panel, red balls; PDB 2HF4) and ADP-bound (right panel, green balls; PDB 2HF3) forms (a). Black balls, overlapped residues (I136, I309, I369) in NMR spectra. The SDs are colored as in Fig. 1c. Panels a and b were generated using Chimera. 3D (b) and 2D (c) depictions of the NBS of ATP- and ADP-bound actin (left and right images, respectively). Hydrogen bonds are indicated by dashed lines. In ATP-actin, the two halves of the structure are bridged through additional hydrogen bonds between the terminal γ-phosphate and residues in SD3 that are absent in ADP-actin (circled in red). Panel c was generated using LigPlot+.
Fig. 5
Fig. 5. Structural models for the dynamics of G-actin.
In each panel the left column schematically depicts a potential structural mechanism to explain the observed dynamics (T and D indicate ATP- and ADP-bound actin ground states, respectively, and T* and D* indicate the respective excited states), the middle panels plot various ground- and excited-state chemical shifts against each other, and the right column depicts the mechanistic conclusion from the data (see main text). In the middle column, each datapoint represents an isoleucine residue. Residues with different ground-state chemical shifts in ATP- and ADP-actin are boxed, and are not used to make structural comparisons. a, Model in which actin exists in only two conformational states, which are differentially biased by ATP and ADP (left). In such a model, T and D* are conformationally identical and have the same chemical shifts, as do D and T*. The scatter plots (middle) compare the ATP and ADP* 13C chemical shifts (top) and the ADP and ATP* chemical shifts (bottom). Off-diagonal, non-boxed points indicate structural differences between the states (more definitive for the T*/D comparison than the T/D* comparison), ruling out a two-state equilibrium (right). b, In a three-state model, ATP- and ADP-actin have distinct ground-state structures, but populate a common excited state (left). The scatter plot of ATP* versus ADP* 13C chemical shifts (middle) shows numerous off-diagonal, non-boxed points, indicating the two forms do not populate a common excited state (right). c, In a four-state equilibrium, ATP- and ADP-actin have distinct ground- and excited-state conformations (left). The scatter plots (middle) of ATP* versus ADP* (top) and ATP versus ADP (bottom) 13C chemical shifts show numerous off-diagonal, non-boxed points, indicating four distinct conformations (right).
Fig. 6
Fig. 6. A disease-causing, fast polymerizing actin mutant, K118N, increases the population of the ATP* state.
a, Overlaid 1H/13C methyl TROSY NMR spectra of ATP-bound wild-type (WT, red) and K118N G-actin (blue). b, MQ relaxation dispersion profiles for representative isoleucine resonances in WT (red) and K118N (blue) G-actin. The error in measurements was calculated from the intensities of duplicate data points (Methods). c, Comparison of ATP* populations in WT and K118N G-actin. d, Proposed model for the increased polymerization rate of the K118N mutant actin based on a higher population of an on-pathway intermediate in filament formation, T*. Errors in the population of excited states (PT*) were determined from the covariance matrix of the global fits.
Extended Data Fig. 1
Extended Data Fig. 1. Expression, purification and δ1-methyl 13C assignments of G-actin.
a, Schematics showing steps used for purification of recombinant G-actin from P. pastoris. b-d, SDS-PAGE (15%) showing fractions after Ni-NTA (b) anion exchange (c) and Superdex-200 size-exclusion chromatography (d). In (b), Lane 1, Molecular weight markers; Lane 2, pellet after lysis and centrifugation; Lane 3, supernatant after lysis and centrifugation; lane 4, flow through; lane 5, wash I; lane 6, wash II; lanes 7&8, elution; lane 9, after overnight TEV cleavage reaction. The SDS-PAGE gels are representative of at least 10 independent experiments. e,f, Overlaid 1H/13C HMQC spectra of WT G-actin (red) and mutants (black) I85L & I122L (e) and I175L (f). All assignments were obtained by mutagenesis; missing peaks in the mutant spectra were used to obtain sequence specific assignments. The missing peak in each mutant spectrum is labeled. Overlaid spectra of WT and mutant I175L showing chemical shift perturbation experienced by residues that are away from the position of mutation and propagate to different sub-domains (f). g, Ribbon diagram of G-actin with I175 shown as a red ball and residues altered by its mutation shown as black balls. Uncropped images for b-d are available as source data. Source data
Extended Data Fig. 2
Extended Data Fig. 2. Preparation of Ca2+-ADP-actin and effects of metal ion on 1H/13C HMQC spectra.
a, Purified Ca2+-ATP-actin was first converted using hexokinase to Mg2+-ADP-actin, which was then dialyzed against buffer containing Ca2+-ADP to produce Ca2+-ADP-actin. See Methods for details. b, 1H/13C HMQC spectra of perdeuterated, 1H/13C- Ile δ1-methyl-labeled Ca2+-ATP-actin (top); overlaid spectra of Ca2+-ATP-actin (red) and Mg2+-ADP-actin (cyan) (middle); overlaid spectra of Mg2+-ADP-actin (cyan) and Ca2+-ADP-actin (black) (bottom). Residues showing chemical shift changes upon metal switching in the ADP state are circled. c,d, Structural comparison between AMPPNP (PDB ID INWK)- and ADP-bound (PDB ID 1J6Z) forms of TMR-labeled actin.
Extended Data Fig. 3
Extended Data Fig. 3. G-actin does not aggregate and is stable during NMR data acquisition at 100 μM.
a,b, Full linewidth at half height (νFWHH) in the 13C (a) and 1H (b) dimensions of resolved Ile δ1-methyl resonances in 1H/13C HMQC spectra recorded at 600 MHz on 1H/13C- Ile δ1-methyl-labeled Ca2+-ATP-actin at the indicated protein concentrations. c, S/N (signal to noise) ratio in 1H/13C HMQC spectra of 1H/13C- Ile δ1-methyl-labeled labeled Ca2+-ATP-actin acquired at different times (0, 20 and 40 hours) after sample preparation. No significant changes in S/N were observed over the 40 hour timecourse. Error bars represent SD calculated from the noise in the spectra.
Extended Data Fig. 4
Extended Data Fig. 4. μs-ms dynamics of Ca2+-ATP-actin.
a, Multiple quantum relaxation dispersion (ΔR2), the difference in R2eff at lowest and highest pulsing rates, recorded at 800 MHz, of Ile δ1-methyl resonances of 1H/13C- Ile δ1-methyl-labeled Ca2+-ATP-actin. Error bars in ΔR2 represent the SD based on noise levels in NMR spectra and were calculated using standard error propagation methods, b, Magnitude of 13C chemical shift difference (13C|Δω|) between the major (ground) and minor (excited) states for Ile δ1-methyl groups of ATP-actin. c, Thermodynamic (Pb) and kinetic parameters (kex) obtained from two-state global fitting of the relaxation dispersion data. Errors in 13C|Δω|, Pb, and kex were determined from the covariance matrix of the global fits. ΔR2 values near zero were obtained for all Ile δ1-methyl resonances in a 1H single quantum relaxation dispersion experiment as shown for representative residues in Fig. 3(columns 2 and 4).
Extended Data Fig. 5
Extended Data Fig. 5. μs-ms dynamics in Ca2+-ADP-actin.
a, Multiple quantum relaxation dispersion (ΔR2), difference in 1H/13C R2eff between the lowest and highest CPMG field strengths, recorded at 800 MHz of Ile δ1-methyl resonances of 1H/13C- Ile δ1-methyl-labeled Ca2+-ADP-actin. Error bars in ΔR2 represent the SD based on noise levels in NMR spectra and were calculated using standard error propagation methods b, Absolute value of the difference between ground and excited state 13C and 1H chemical shifts |Δω| for Ile δ1-methyl resonances of Ca2+-ADP-actin determined from global fitting of the MQ and 1H SQ CPMG data. c, Thermodynamic (Pb) and kinetic parameters (kex) obtained from two-state global fitting. Errors in |Δω|, Pb, and kex were determined from the covariance matrix of the global fits.
Extended Data Fig. 6
Extended Data Fig. 6. Comparison of dynamics in ATP- and ADP-bound G-actin.
a, Comparison of MQ ΔR2 recorded at 800 MHz of Ile δ1-methyl resonances of 1H/13C- Ile δ1-methyl-labeled ATP- (red) and ADP-bound (green) actin. Only residues I64, I71, I75 and I85 showed ΔR2 ≥ 2 Hz in ADP-actin, whereas many additional residues showed ΔR2 ≥ 2 Hz in ATP-actin. Error bars in ΔR2 represent the SD, based on noise levels in NMR spectra and were calculated using standard error propagation methods b, Although, residues showing ΔR2 ≥ 2 Hz are mainly confined to SD1 and SD2, in ADP-actin, the magnitude of ΔR2 was higher due to a greater population of the excited state. The error bars represent the SD (standard deviation), calculated from the two and three replicated data points for 600 and 800 MHz data, respectively.c, Hydrolysis of ATP (red) into ADP (yellow) triggers a series of rearrangements from which multiple hydrogen bonds (shown as dotted line) are broken.
Extended Data Fig. 7
Extended Data Fig. 7. Structural and dynamic analyses of K118N Ca2+-ATP-actin.
a, Location of K118 on the F-actin structure (PDB ID 6DJM). K118, shown as a red sphere, is not at a subunit interface. b, Comparison of Ile δ1-methyl 13C excited state chemical shifts 13C|Δω| of K118N (light blue) and WT (pink) ATP-actin. Error in 13C|Δω|, Pb, and kex were determined from the covariance matrix of the global fits.

References

    1. Dominguez R, Holmes KC. Actin structure and function. Annu. Rev. Biophys. 2011;40:169–186. doi: 10.1146/annurev-biophys-042910-155359. - DOI - PMC - PubMed
    1. Yamazaki D, Kurisu S, Takenawa T. Regulation of cancer cell motility through actin reorganization. Cancer Sci. 2005;96:379–386. doi: 10.1111/j.1349-7006.2005.00062.x. - DOI - PMC - PubMed
    1. Rubenstein PA, Wen KK. Insights into the effects of disease-causing mutations in human actins. Cytoskeleton. 2014;71:211–229. doi: 10.1002/cm.21169. - DOI - PubMed
    1. Oosawa, F. & Asakura, S. Thermodynamics of the Polymerization of Protein (Academic, 1975).
    1. Wegner A, Engel J. Kinetics of the cooperative association of actin to actin filaments. Biophys. Chem. 1975;3:215–225. doi: 10.1016/0301-4622(75)80013-5. - DOI - PubMed

Publication types

MeSH terms