. 2022 Apr;25(4):474-483.
doi: 10.1038/s41593-022-01032-6. Epub 2022 Mar 24.

Chromatin domain alterations linked to 3D genome organization in a large cohort of schizophrenia and bipolar disorder brains

Affiliations

Chromatin domain alterations linked to 3D genome organization in a large cohort of schizophrenia and bipolar disorder brains

Kiran Girdhar et al. Nat Neurosci. 2022 Apr.

Abstract

Chromosomal organization, scaling from the 147-base pair (bp) nucleosome to megabase-ranging domains encompassing multiple transcriptional units, including heritability loci for psychiatric traits, remains largely unexplored in the human brain. In this study, we constructed promoter- and enhancer-enriched nucleosomal histone modification landscapes for adult prefrontal cortex from H3-lysine 27 acetylation and H3-lysine 4 trimethylation profiles, generated from 388 controls and 351 individuals diagnosed with schizophrenia (SCZ) or bipolar disorder (BD) (n = 739). We mapped thousands of cis-regulatory domains (CRDs), revealing fine-grained, 104-106-bp chromosomal organization, firmly integrated into Hi-C topologically associating domain stratification by open/repressive chromosomal environments and nuclear topography. Large clusters of hyper-acetylated CRDs were enriched for SCZ heritability, with prominent representation of regulatory sequences governing fetal development and glutamatergic neuron signaling. Therefore, SCZ and BD brains show coordinated dysregulation of risk-associated regulatory sequences assembled into kilobase- to megabase-scaling chromosomal domains.


Conflict of interest statement

Competing Interests Statement

The authors declare no competing financial interests.

Figures

Figure 1:
Figure 1:. Histone peak profiling in 739 ChIP-Seq datasets from two studies consisting of SCZ, BD and control subjects
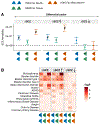
(A) (left) Datasets and studies; study-1, FANS isolated PFC NeuN+ nuclei: H3K4me3 (purple), H3K27ac (blue). study-2, total (non-sorted) tissue PFC nuclei: H3K27ac (green). (middle) Bar plot, genomic coverage (%) of each ChIP-Seq dataset. Numbers of subjects as indicated and bar plot to show % of regulatory elements in each dataset. (B) Bar plots (colored sectors marking significantly different peaks) showing the proportion of differentially regulated histone peaks in our four datasets of case control comparisons, as indicated. See also Figure S2 for overlap of disease-sensitive peaks across the various H3K27ac datasets (C) Spearman correlation of effect sizes of H3K27ac NeuN+ peaks altered (*) in SCZ study-1, compared with effect sizes for corresponding peaks in SCZ study-2 subjects with bulk PFC Tissue as input. Green dots mark H3K27ac NeuN+ at FDR < 5%. P value (p), Spearman rank correlation test. (D) Meta-analysis of H3K27ac NeuN+ and H3K27ac Tissue: The bar shows differential SCZ-specific peaks of H3K27ac Meta NeuN+ at FDR < 5%. Volcano plot of differentially modified H3K27ac Meta NeuN+ peaks by fixed effect model. Orange dots represent peaks with FDR < 5%. P values for t-test of limma pipeline, with FDR correction (Benjamini & Hochberg) across all peaks. (E) (top) Visualization of the hyperacetylated region covering STX1A gene. H3K27ac NeuN+ ChIP-Seq landscape from (gray) controls and (blue) SCZ individuals. (bottom) Differential peak profile, horizontal bars demarcate linear extension of disease-sensitive peak population for each of the three H3K27ac datasets, as indicated (blue) H3K27ac NeuN+ study 1, (green) H3K27ac Tissue study-2, (orange) H3K27ac NeuN+ meta-analysis.
Figure 2:
Figure 2:. Enrichment of common SCZ risk variants in dysregulated peaks in NeuN+ and bulk tissue.
(A) SCZ heritability coefficients of genetic variants overlapping histone peaks from study-1 H3K27ac NeuN+, study-2 H3K27ac Tissue and H3K27ac Meta NeuN+ stratified by 1) “ΔSCZ”: dysregulated peaks (n=3360, 5656 and 6219 peaks, respectively) 2) “ΔSCZ↑”:hyperacetylated dysregulated peaks (n=1918, 2681 and 4031 peaks, respectively) and 3) “ΔSCZ↓”: hypoacetylated dysregulated peaks (n=1442, 2975 and 2188 peaks, respectively) with log2FC (SCZ vs controls) >0 and <0 respectively. Error bars represent standard error in SCZ heritability from LDSc regression (B) Heatmap of enrichment P-values of brain-related GWAS traits. The overlap of peaks with genetic variants was assessed using LD score regression. ”#”: Significant for enrichment in LD score regression after FDR correction of multiple testing across all tests in the plot (Benjamini & Hochberg test); ”*”: Nominally significant for enrichment.
Figure 3:
Figure 3:. PFC histone CRDs reveal subTAD chromosomal organization.
(A) CRD analyses were conducted separately for each of our three ChIP-seq datasets (H3K4me3 NeuN+, H3K27ac NeuN+ , H3K27ac Tissue) (see also Figure 1A,B). The numbers next to bars indicate the proportion of total peak population integrated into CRD structures. (B) Venn diagrams summarizing genome-wide sequences, in Mb megabases, integrated into CRD structures, including overlap and Jaccard similarity index between different histones and cell population (NeuN+ or tissue). (C) (top) Representative 10Mb window of chromosome 4 showing PFC NeuN+ Hi-C TAD, chromosomal loop and H3K27ac landscape including CRD structure. (bottom, shaded in gray color) Higher resolution (2Mb) peak-to-CRD assignments and peak correlational structure expressed as an interaction matrix. (D) Neuronal CTCF chromatin occupancies (Y-axis, using CTCF ENCODE reference ChIP-seq from H1 stem cell-differentiated neuronal culture) in relation to distance from CRD (colored graphs) and TAD (black graph) boundaries.
Figure 4:
Figure 4:. Acetylated CRDs dysregulated in SCZ.
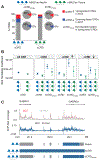
(A) Proportional representation of SCZ-sensitive H3K27ac NeuN+ ΔCRDs stratified by hypoacetylation (blue), hyperacetylation (red) and not dysregulated (gray). Pie chart shows the proportion of dysregulated histone peaks ΔCRDΔPeaks inside ΔCRD (B) SCZ heritability coefficients shown separately for (blue) H3K27ac NeuN+ and (green) H3K27ac Tissue, as indicated, by 1) “All CRD”: all peaks inside CRD (n=114,123 and 143,092 peaks in CRD), 2) “ΔCRD”: dysregulated CRD (n=28,866 and 15,787 peaks in ΔCRD; 3,507 and 1,673 peaks in ΔCRDΔPeaks), 3) “ΔCRD↑”: hyperacetylated with mean log2FC (SCZ vs controls) > 0 (n=14,710 and 7,770 peaks in ΔCRD↑, 1,825 and 873 peaks in ΔCRD↑ΔPeaks),and 4) “ΔCRD↓”: hypoacetylated with mean log2FC (SCZ vs controls) < 0 (n=14,156 and 8,017 peaks in ΔCRD↓; 1,682 and 800 peaks in ΔCRD↓ΔPeaks) classified on x-axis as ΔCRD for all peaks and ΔCRDΔPeaks for only dysregulated histone peaks. The overlap of peaks within the dysregulated CRDs in clusters with SCZ risk variants was assessed using LD score regression. ”#”: Significant for enrichment in LD score regression after FDR correction of multiple testing across all tests in the plot (Benjamini & Hochberg, multiple testing p value <0.05); ”*”: Nominally significant for enrichment (p value <0.05) . Error bars show standard error in SCZ heritability from LDSc regression (C) Representative example of a genomic region which spans ten peaks. Horizontal bars (blue, FDR 5%, gray n.s.) mark (top row) peak level analysis with a single differential peak; (mid row) hyperacetylated CRD and (bottom row) ΔCRDΔPeaks.
Figure 5:
Figure 5:. Fingerprinting disease-sensitive CRDs.
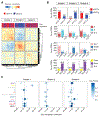
(A) CRD contact matrix of SCZ-sensitive H3K27ac NeuN+ CRDs clustered into three large clusters; notice striking separation of cluster 1 and cluster 3 representing hyperacetylated H3K27ac CRDs in red, and clusters 2 overwhelmingly defined by hypoacetylated H3K27ac CRDs in navy. (B) Composition of annotated CRDs by cell type (GABA in light blue , GLU in pink), compartments (A in cyan., B in indianred.), dysregulation (hypo vs hyper-acetylation in red and navy) and development (fetal in yellow, adult in purple). For every annotation, not significant or not annotated CRDs are shown in gray. (C) Coefficients of heritability of SCZ by cluster and annotation. The overlap of peaks within the dysregulated CRDs in clusters with genetic variants was assessed using LD score regression. P Values from LDSc regression. ”#”: Significant for enrichment in LD score regression after Benjamini and Hochberg FDR correction for multiple testing across all tests in the plot (FDR < 5%). ”*”: Nominally significant for enrichment (p value<.05). Error bars show standard error in SCZ heritability from LDSc regression.
Figure 6:
Figure 6:. Spatial organization of diseased CRDs in the virtual chrom 3D model of the neuronal nucleus.
(A) Box plots show for SCZ H3K27ac NeuN+ cohort, showing for diseased ΔCRDs the pairwise Euclidean distance of PFC NeuN+ TAD, and all CRDs, and diseased ΔCRDs from cluster-1, cluster-2 and cluster-3 (from figure 5) with n=11,103, 8,690 and 9,073 peaks for each clusters as indicated. (B) Box plots for H3K27ac Tissue cohort, separated by SCZ sensitive and BD sensitive ΔCRDs, with n = n=8,553 in cluster 1 and and 7,234 peaks in cluster 2 (from figure 5). Barplots in the bottom in red and navy show the dysregulation status of clusters. The center shows the median, the box shows the interquartile range, whiskers indicate the highest/lowest values within 1.5x the interquartile range, and potential outliers from this are shown as dots. * represents p value < .05 while p values are estimated using the Wilcoxon test.

Similar articles

  • Survey of schizophrenia and bipolar disorder candidate genes using chromatin immunoprecipitation and tiled microarrays (ChIP-chip).
    Pedrosa E, Locker J, Lachman HM. Pedrosa E, et al. J Neurogenet. 2009;23(3):341-52. doi: 10.1080/01677060802669766. Epub 2009 Feb 18. J Neurogenet. 2009. PMID: 19225952
  • Neuronal and glial 3D chromatin architecture informs the cellular etiology of brain disorders.
    Hu B, Won H, Mah W, Park RB, Kassim B, Spiess K, Kozlenkov A, Crowley CA, Pochareddy S; PsychENCODE Consortium; Li Y, Dracheva S, Sestan N, Akbarian S, Geschwind DH. Hu B, et al. Nat Commun. 2021 Jun 25;12(1):3968. doi: 10.1038/s41467-021-24243-0. Nat Commun. 2021. PMID: 34172755 Free PMC article.
  • Cross-Disorder Analysis of Genic and Regulatory Copy Number Variations in Bipolar Disorder, Schizophrenia, and Autism Spectrum Disorder.
    Kushima I, Nakatochi M, Aleksic B, Okada T, Kimura H, Kato H, Morikawa M, Inada T, Ishizuka K, Torii Y, Nakamura Y, Tanaka S, Imaeda M, Takahashi N, Yamamoto M, Iwamoto K, Nawa Y, Ogawa N, Iritani S, Hayashi Y, Lo T, Otgonbayar G, Furuta S, Iwata N, Ikeda M, Saito T, Ninomiya K, Okochi T, Hashimoto R, Yamamori H, Yasuda Y, Fujimoto M, Miura K, Itokawa M, Arai M, Miyashita M, Toriumi K, Ohi K, Shioiri T, Kitaichi K, Someya T, Watanabe Y, Egawa J, Takahashi T, Suzuki M, Sasaki T, Tochigi M, Nishimura F, Yamasue H, Kuwabara H, Wakuda T, Kato TA, Kanba S, Horikawa H, Usami M, Kodaira M, Watanabe K, Yoshikawa T, Toyota T, Yokoyama S, Munesue T, Kimura R, Funabiki Y, Kosaka H, Jung M, Kasai K, Ikegame T, Jinde S, Numata S, Kinoshita M, Kato T, Kakiuchi C, Yamakawa K, Suzuki T, Hashimoto N, Ishikawa S, Yamagata B, Nio S, Murai T, Son S, Kunii Y, Yabe H, Inagaki M, Goto YI, Okumura Y, Ito T, Arioka Y, Mori D, Ozaki N. Kushima I, et al. Biol Psychiatry. 2022 Sep 1;92(5):362-374. doi: 10.1016/j.biopsych.2022.04.003. Epub 2022 Apr 22. Biol Psychiatry. 2022. PMID: 35667888
  • The genome in three dimensions: a new frontier in human brain research.
    Mitchell AC, Bharadwaj R, Whittle C, Krueger W, Mirnics K, Hurd Y, Rasmussen T, Akbarian S. Mitchell AC, et al. Biol Psychiatry. 2014 Jun 15;75(12):961-9. doi: 10.1016/j.biopsych.2013.07.015. Epub 2013 Aug 16. Biol Psychiatry. 2014. PMID: 23958183 Free PMC article. Review.
  • The epigenomics of schizophrenia, in the mouse.
    Javidfar B, Park R, Kassim BS, Bicks LK, Akbarian S. Javidfar B, et al. Am J Med Genet B Neuropsychiatr Genet. 2017 Sep;174(6):631-640. doi: 10.1002/ajmg.b.32566. Epub 2017 Jul 12. Am J Med Genet B Neuropsychiatr Genet. 2017. PMID: 28699694 Free PMC article. Review.

Cited by

References

    1. Dixon JR et al. Chromatin architecture reorganization during stem cell differentiation. Nature 518, 331–336 (2015). - PMC - PubMed
    1. Girdhar K et al. Cell-specific histone modification maps in the human frontal lobe link schizophrenia risk to the neuronal epigenome. Nat. Neurosci. 21, 1126–1136 (2018). - PMC - PubMed
    1. Cheung I et al. Developmental regulation and individual differences of neuronal H3K4me3 epigenomes in the prefrontal cortex. Proc Natl Acad Sci USA 107, 8824–8829 (2010). - PMC - PubMed
    1. Khan A, Mathelier A & Zhang X Super-enhancers are transcriptionally more active and cell type-specific than stretch enhancers. Epigenetics 13, 910–922 (2018). - PMC - PubMed
    1. Network and Pathway Analysis Subgroup of Psychiatric Genomics Consortium. Psychiatric genome-wide association study analyses implicate neuronal, immune and histone pathways. Nat. Neurosci. 18, 199–209 (2015). - PMC - PubMed

References (Methods)

    1. Wang D et al. Comprehensive functional genomic resource and integrative model for the human brain. Science 362, (2018). - PMC - PubMed
    1. Kundakovic M et al. Practical Guidelines for High-Resolution Epigenomic Profiling of Nucleosomal Histones in Postmortem Human Brain Tissue. Biol. Psychiatry 81, 162–170 (2017). - PMC - PubMed
    1. Jiang Y, Matevossian A, Huang H-S, Straubhaar J & Akbarian S Isolation of neuronal chromatin from brain tissue. BMC Neurosci. 9, 42 (2008). - PMC - PubMed
    1. Bolger AM, Lohse M & Usadel B Trimmomatic: a flexible trimmer for Illumina sequence data. Bioinformatics 30, 2114–2120 (2014). - PMC - PubMed
    1. Li H & Durbin R Fast and accurate short read alignment with Burrows-Wheeler transform. Bioinformatics 25, 1754–1760 (2009). - PMC - PubMed

Publication types