. 2022 Aug;40(8):1250-1258.
doi: 10.1038/s41587-022-01245-x. Epub 2022 Mar 24.

Bioinstructive implantable scaffolds for rapid in vivo manufacture and release of CAR-T cells

Affiliations

Bioinstructive implantable scaffolds for rapid in vivo manufacture and release of CAR-T cells

Pritha Agarwalla et al. Nat Biotechnol. 2022 Aug.

Erratum in

Abstract

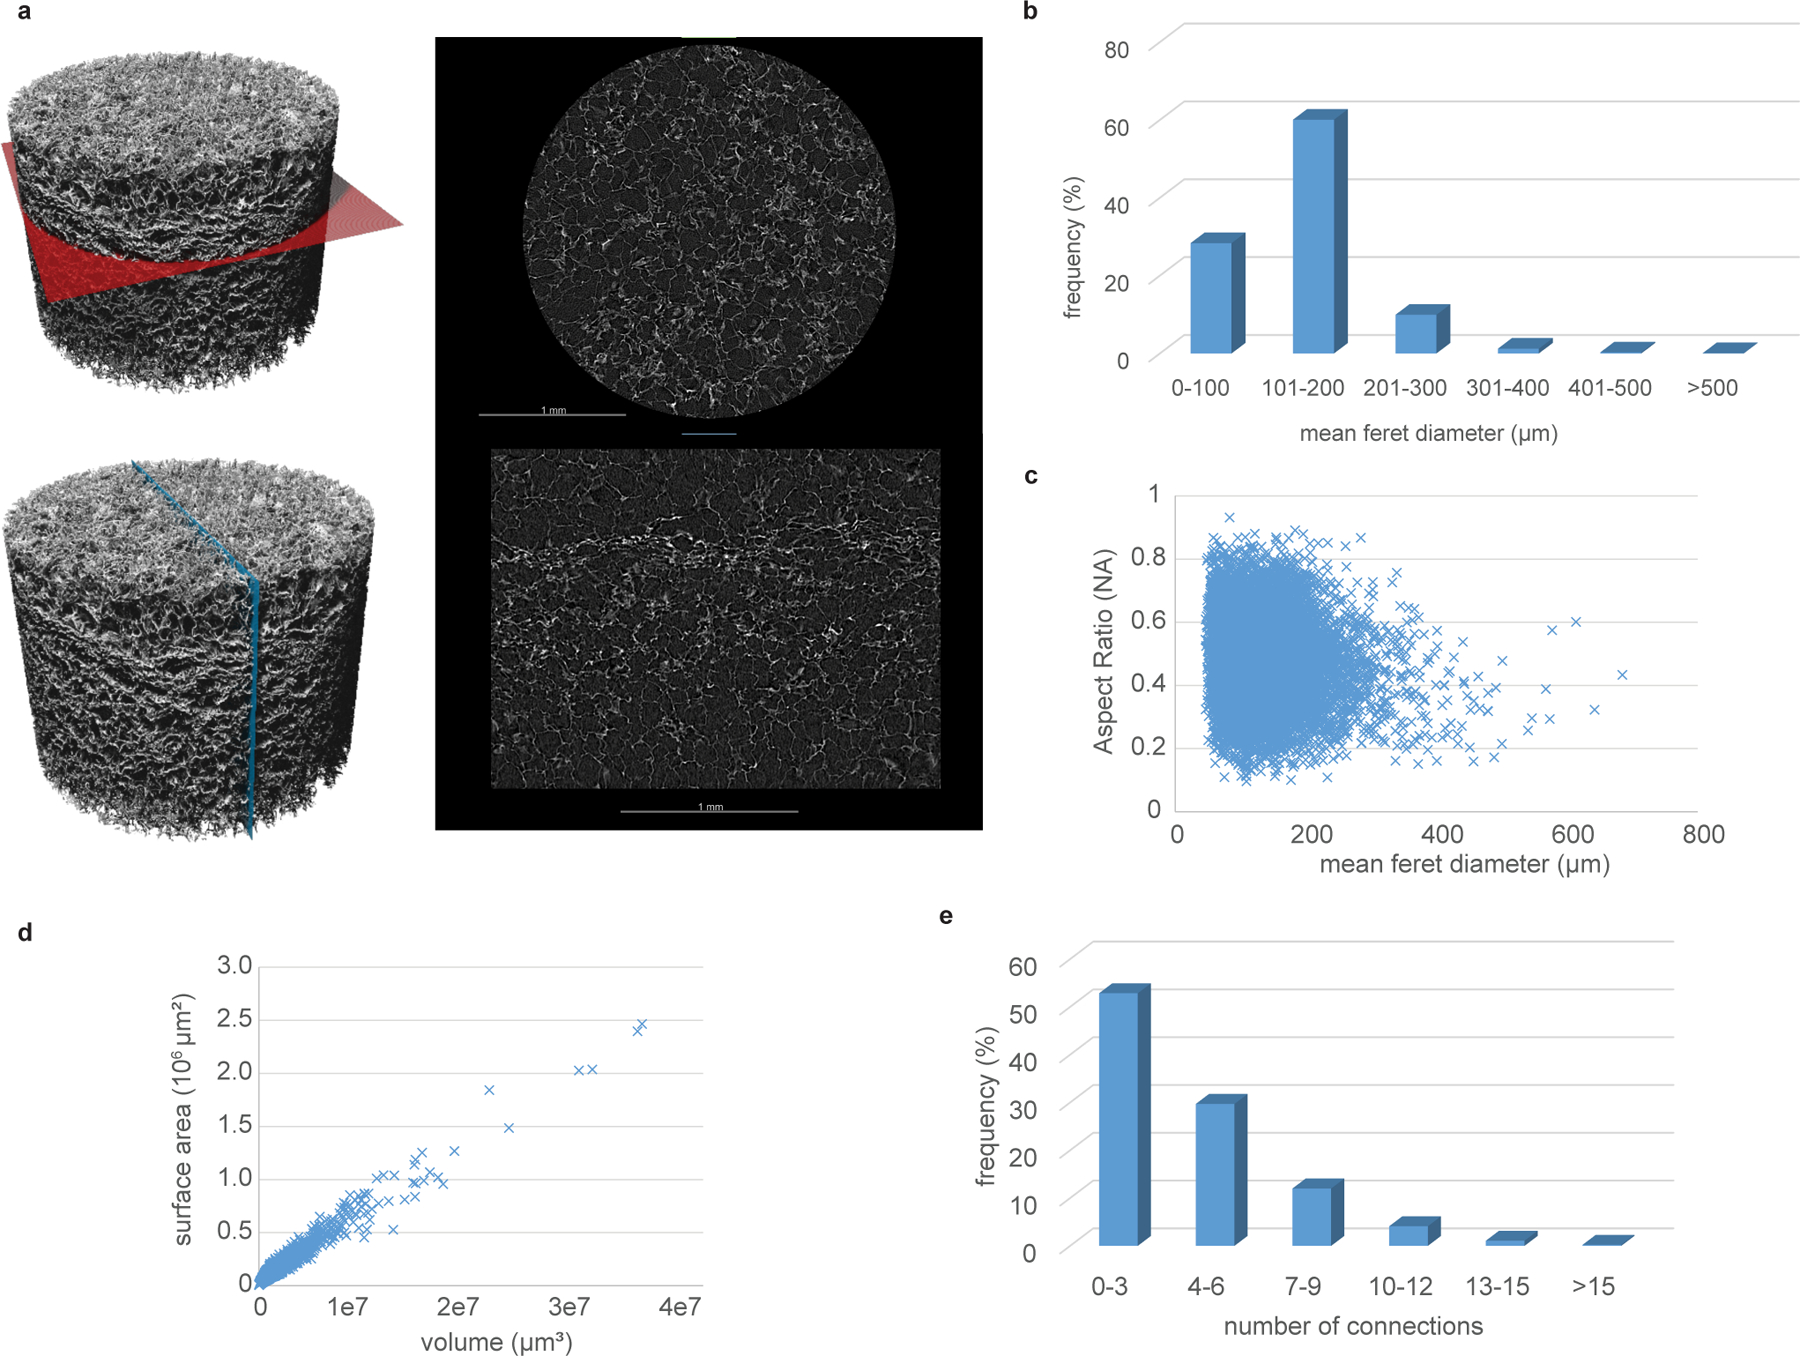
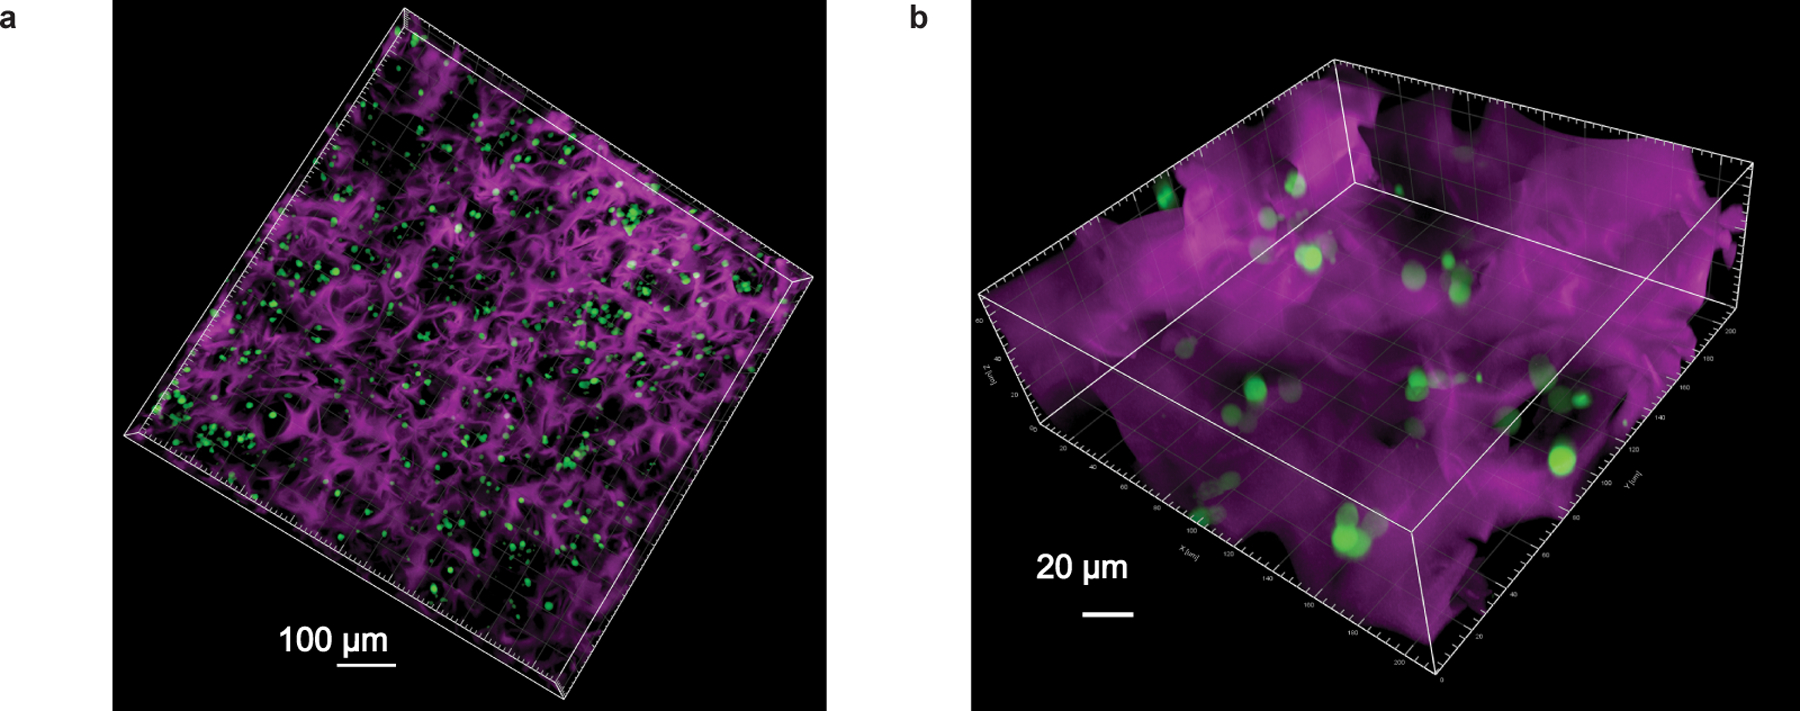
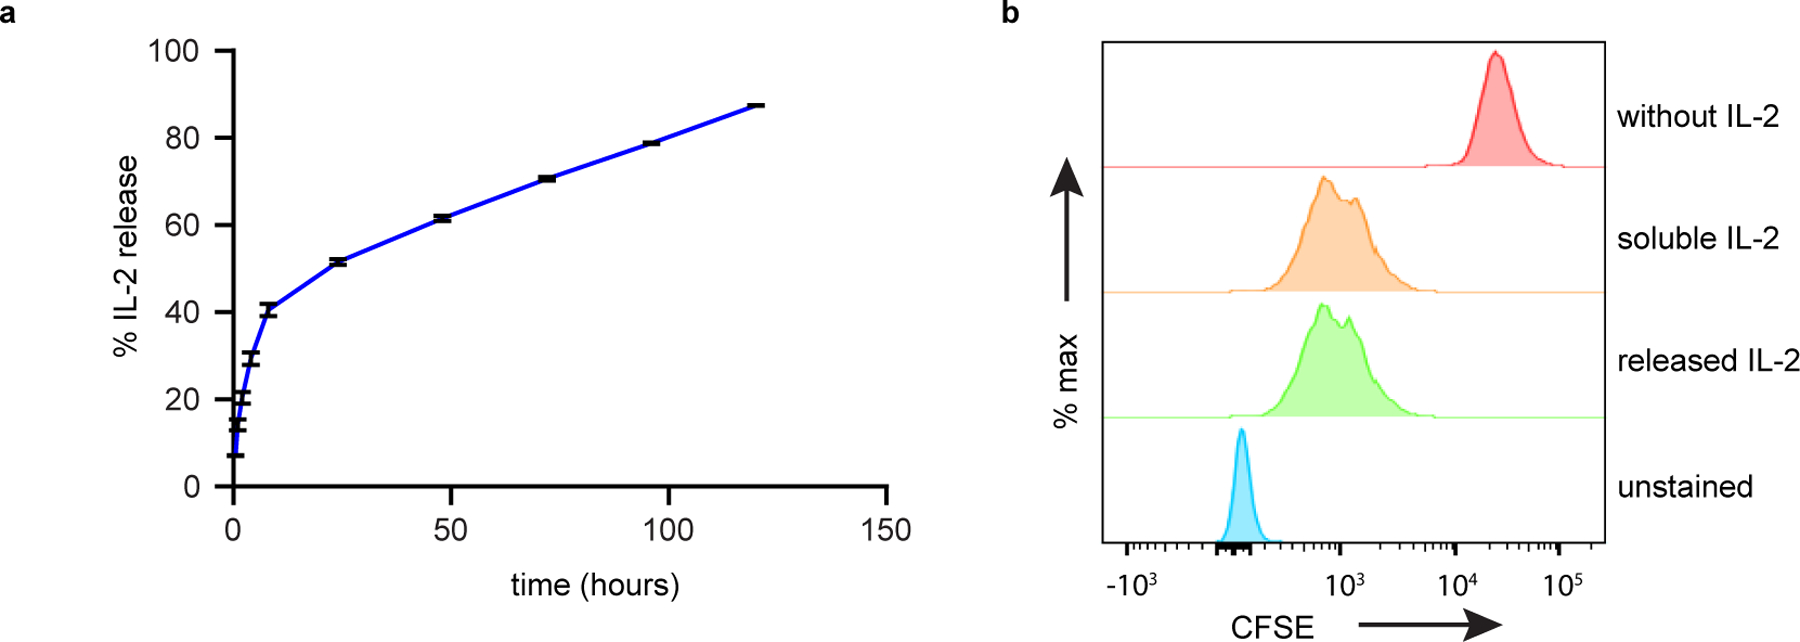
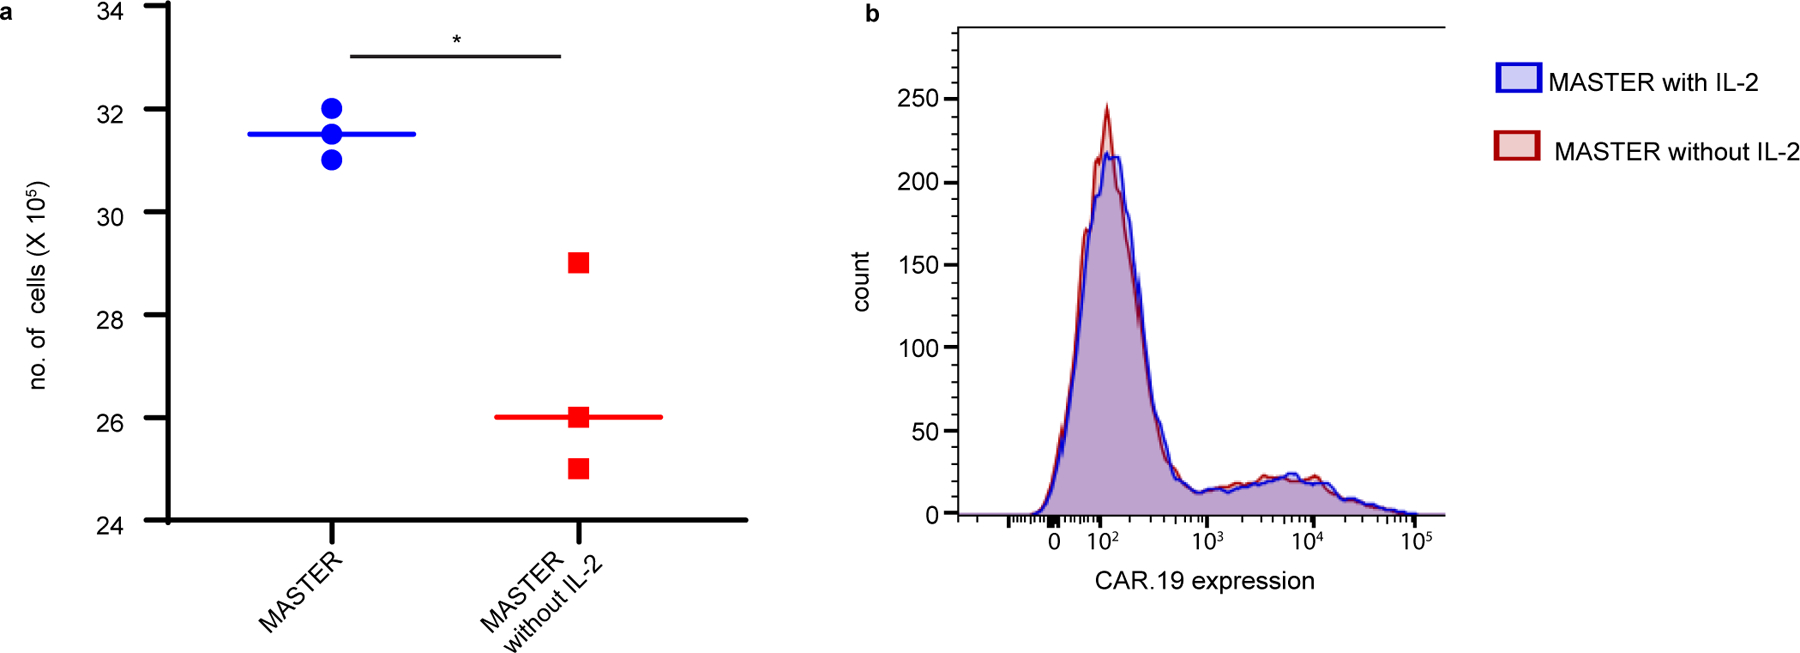
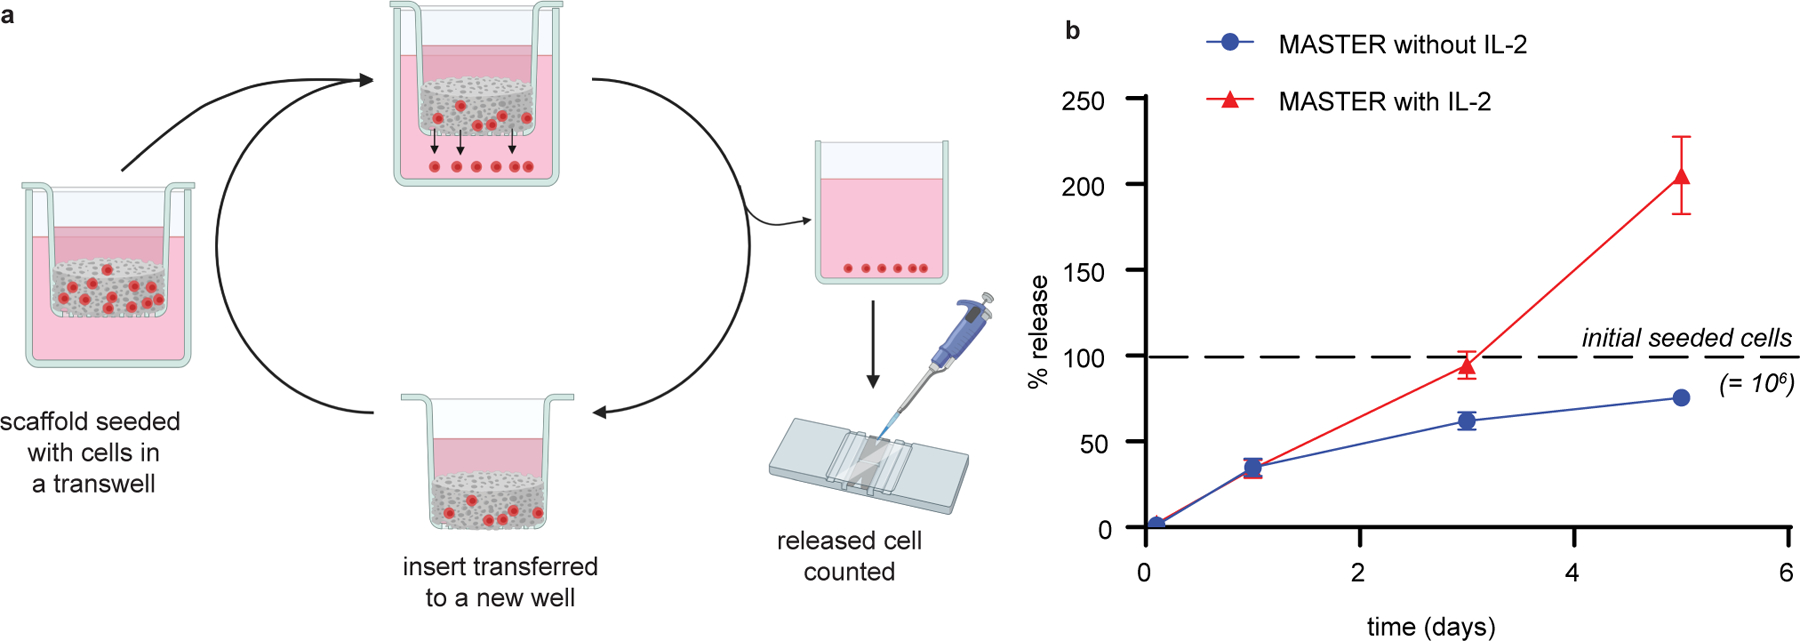
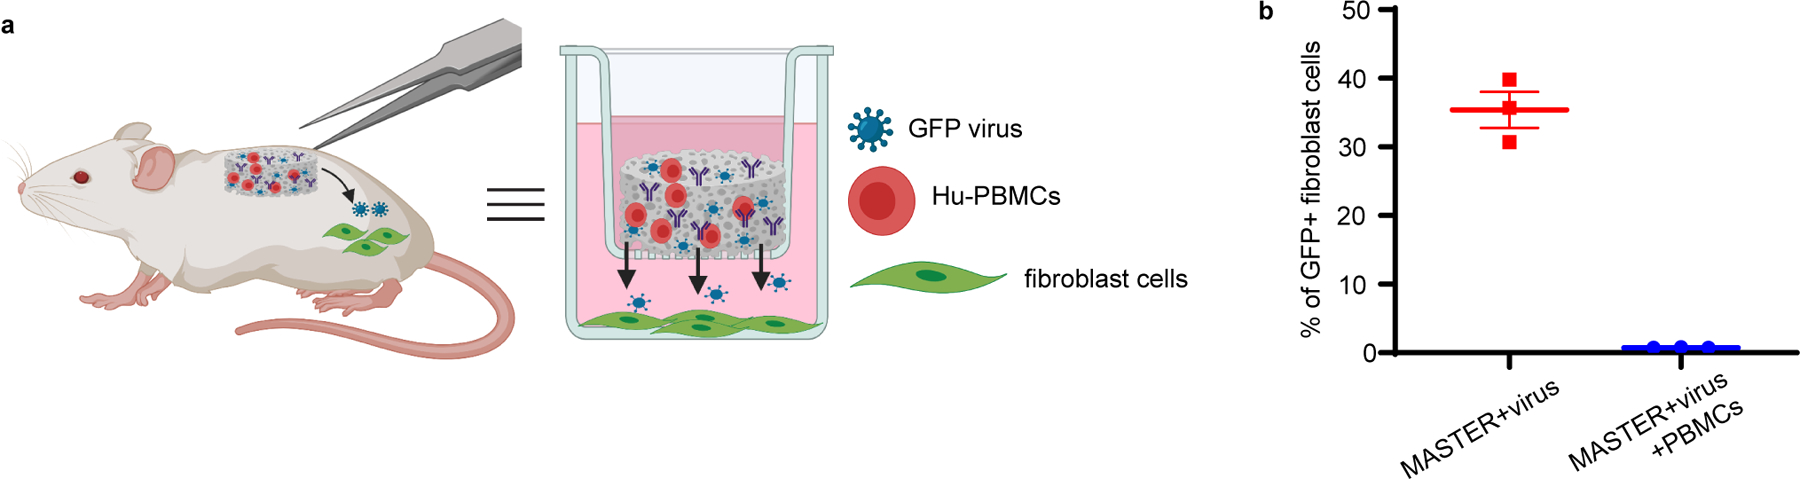
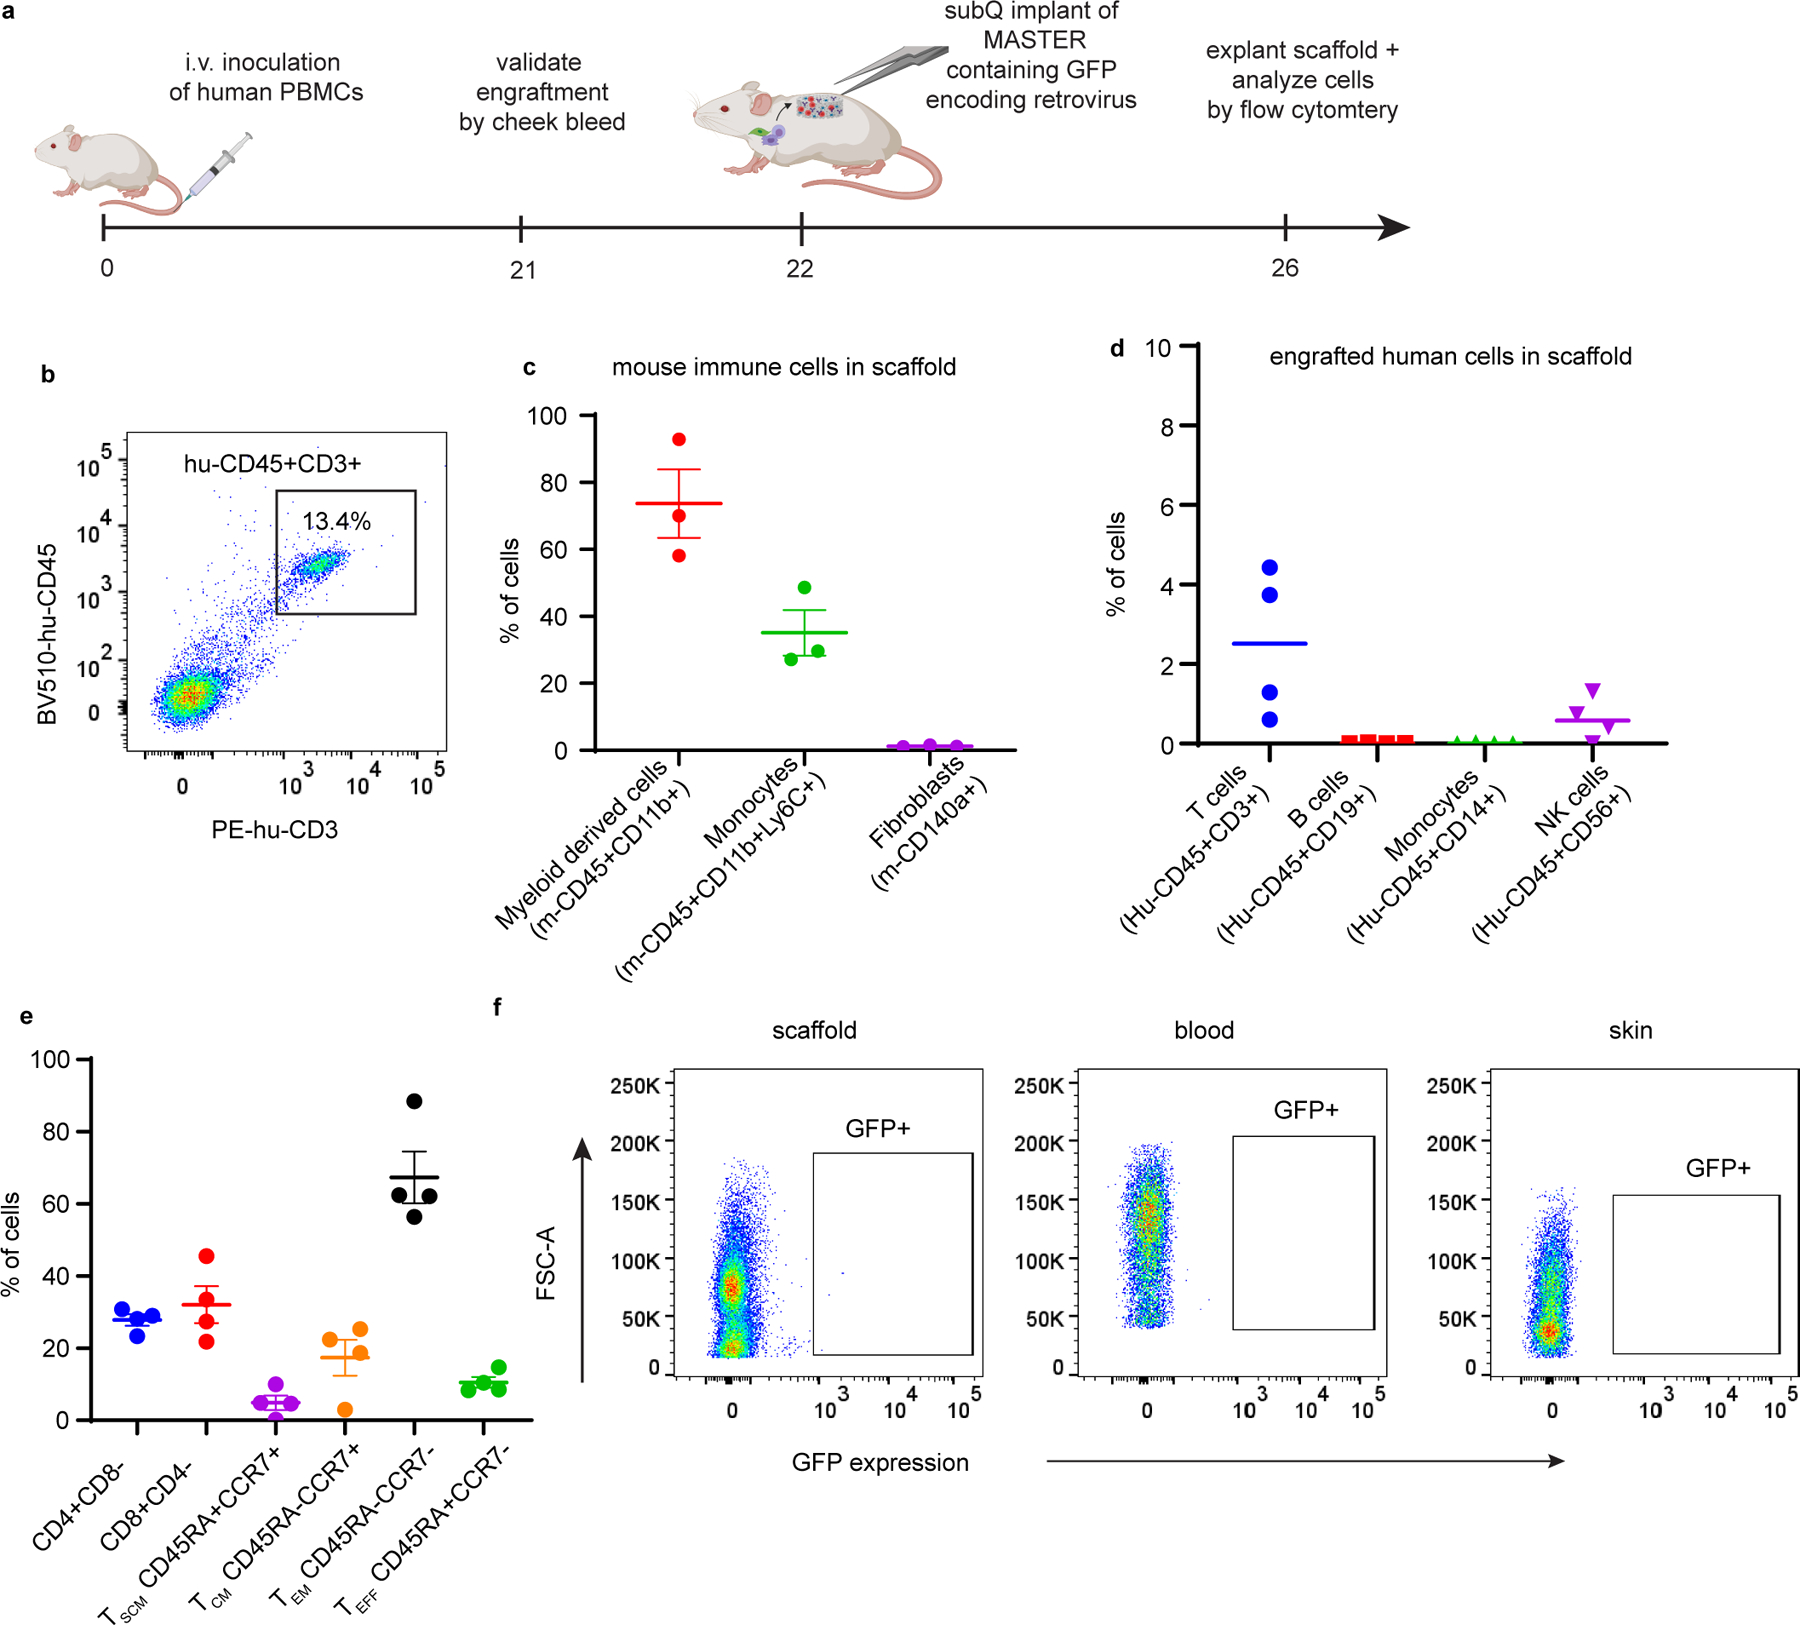
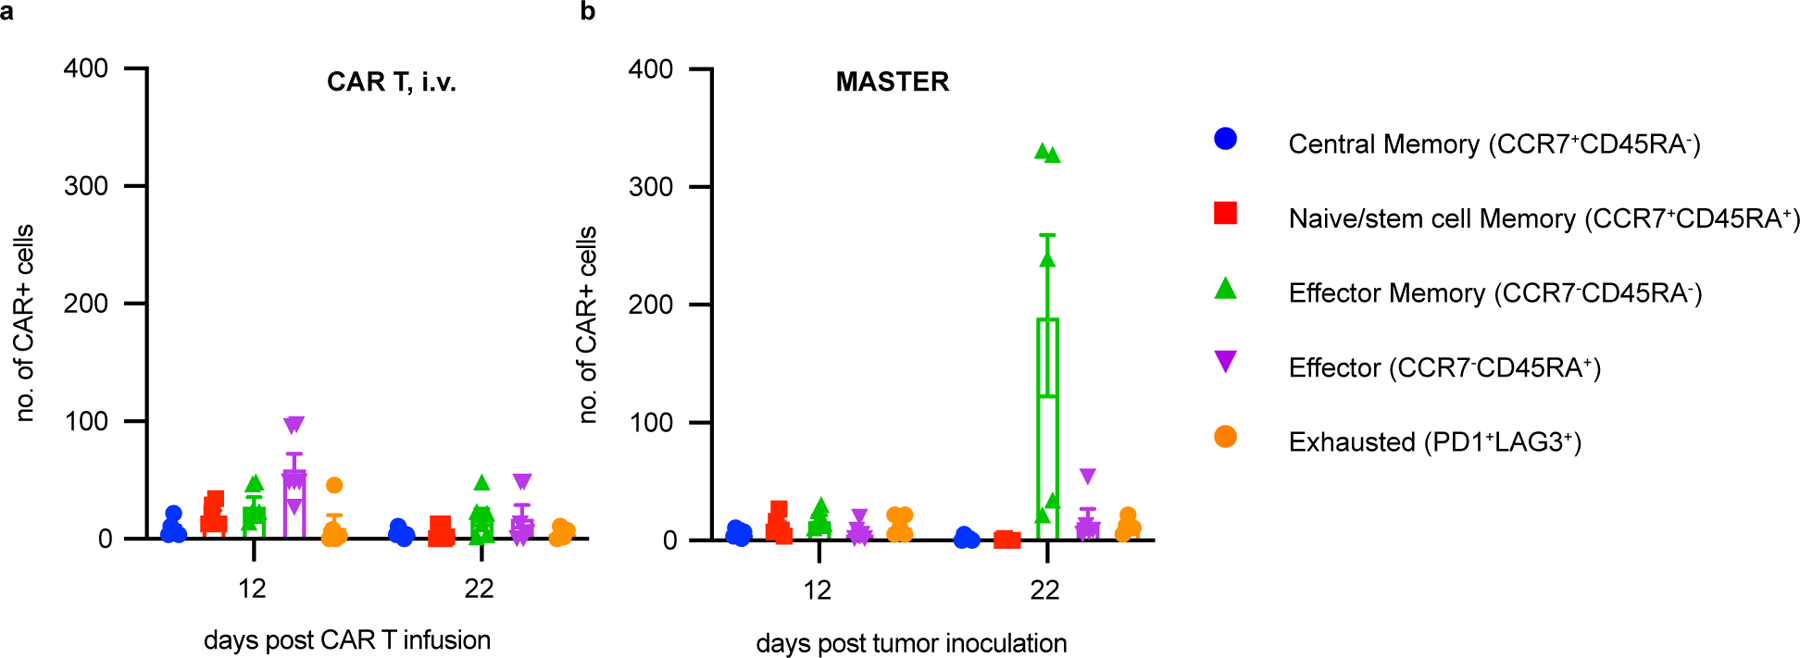
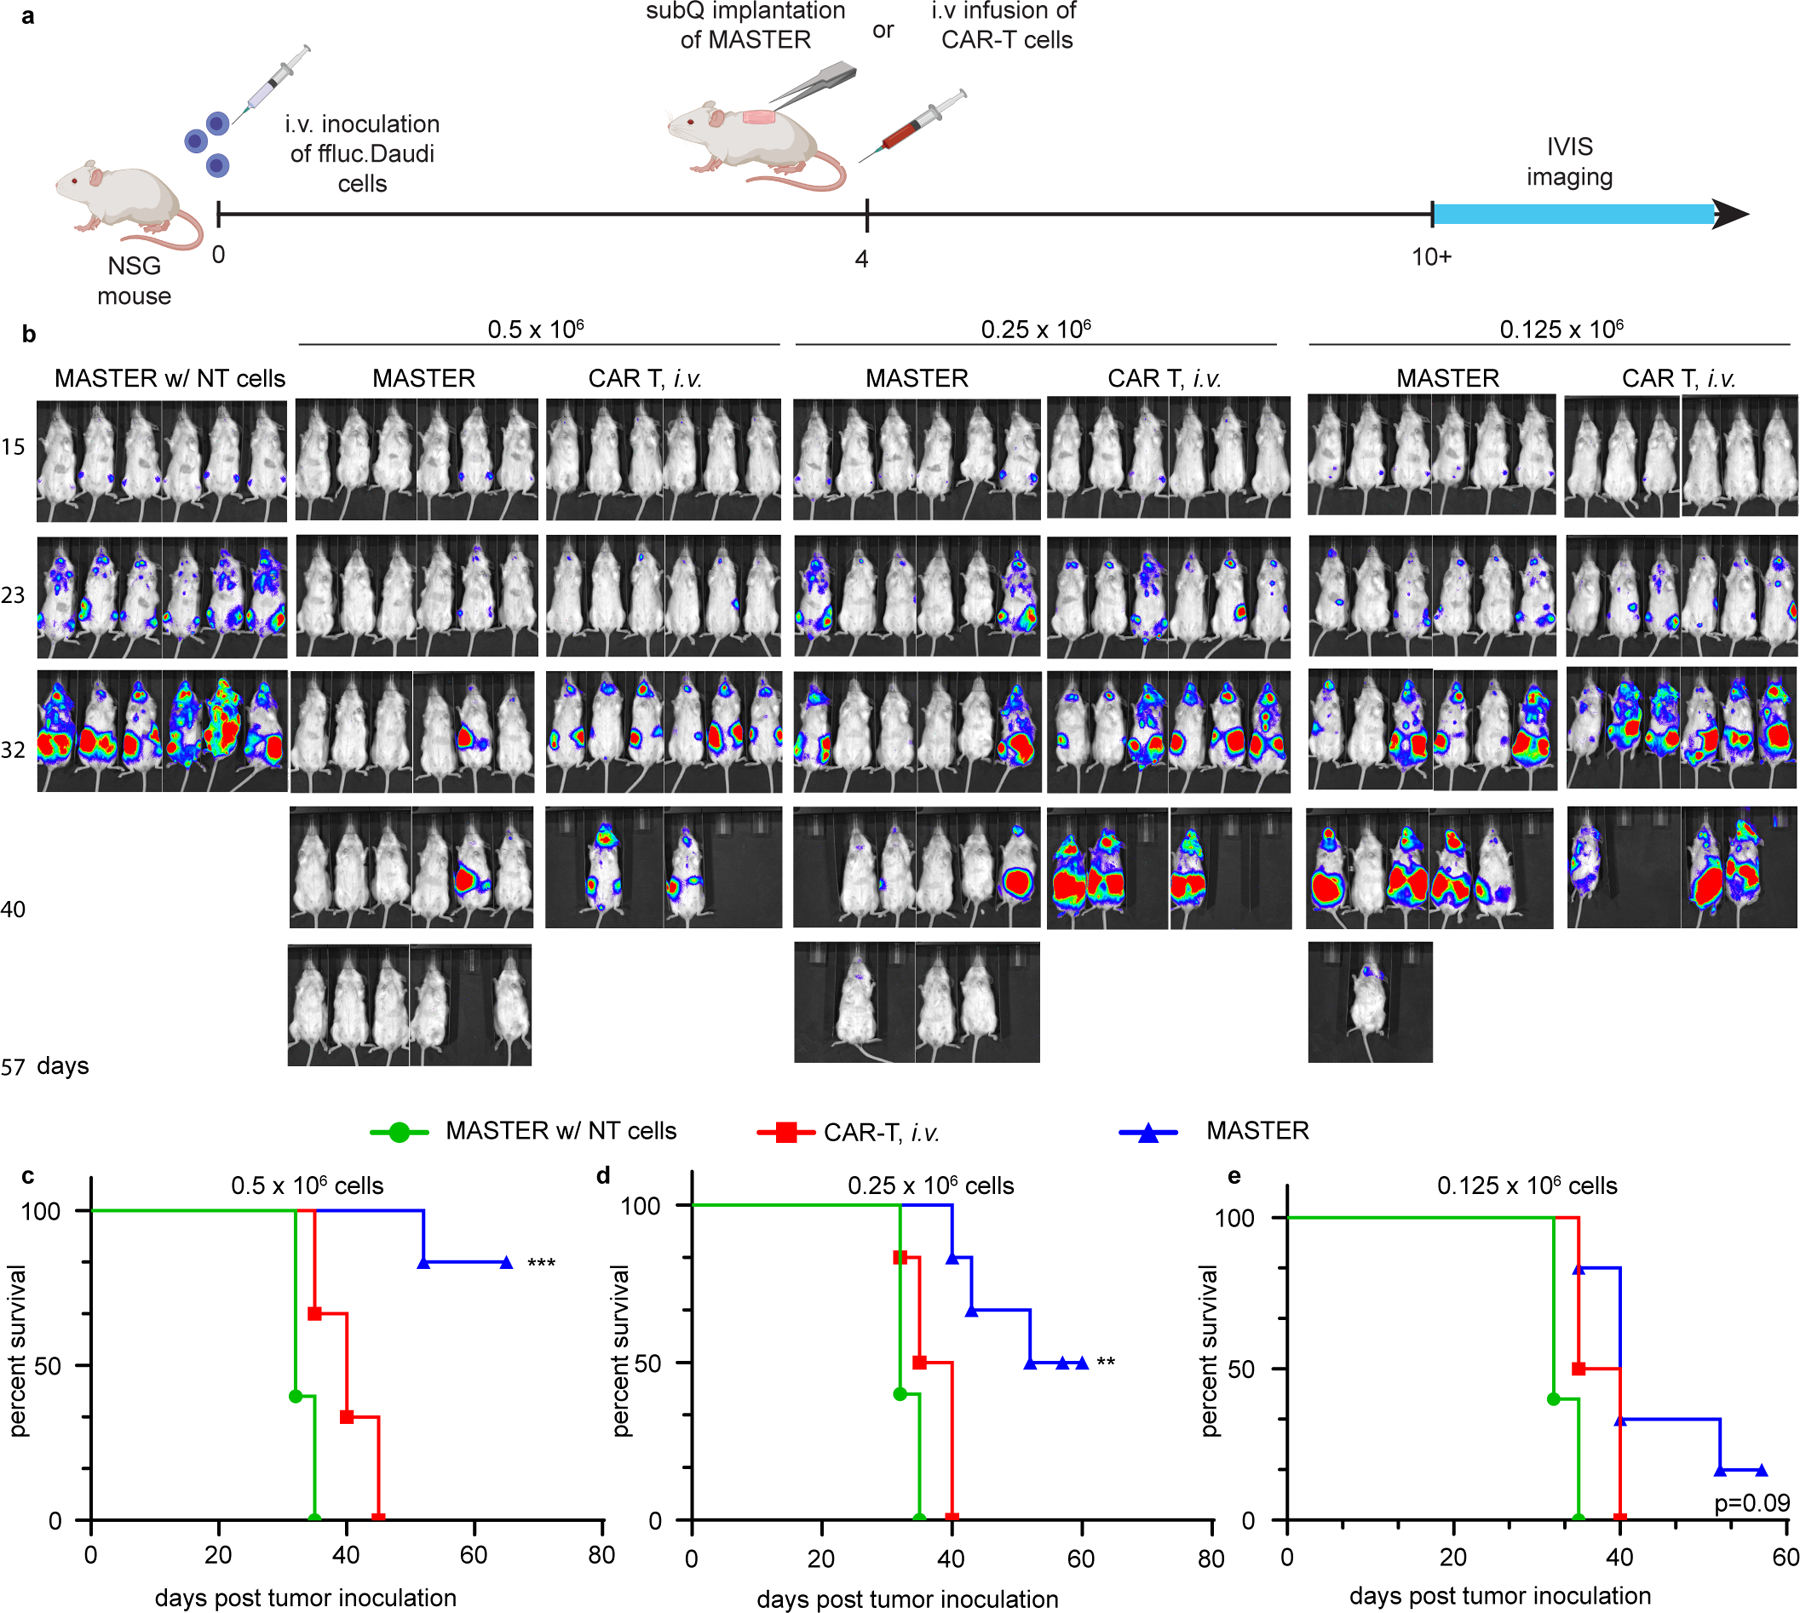
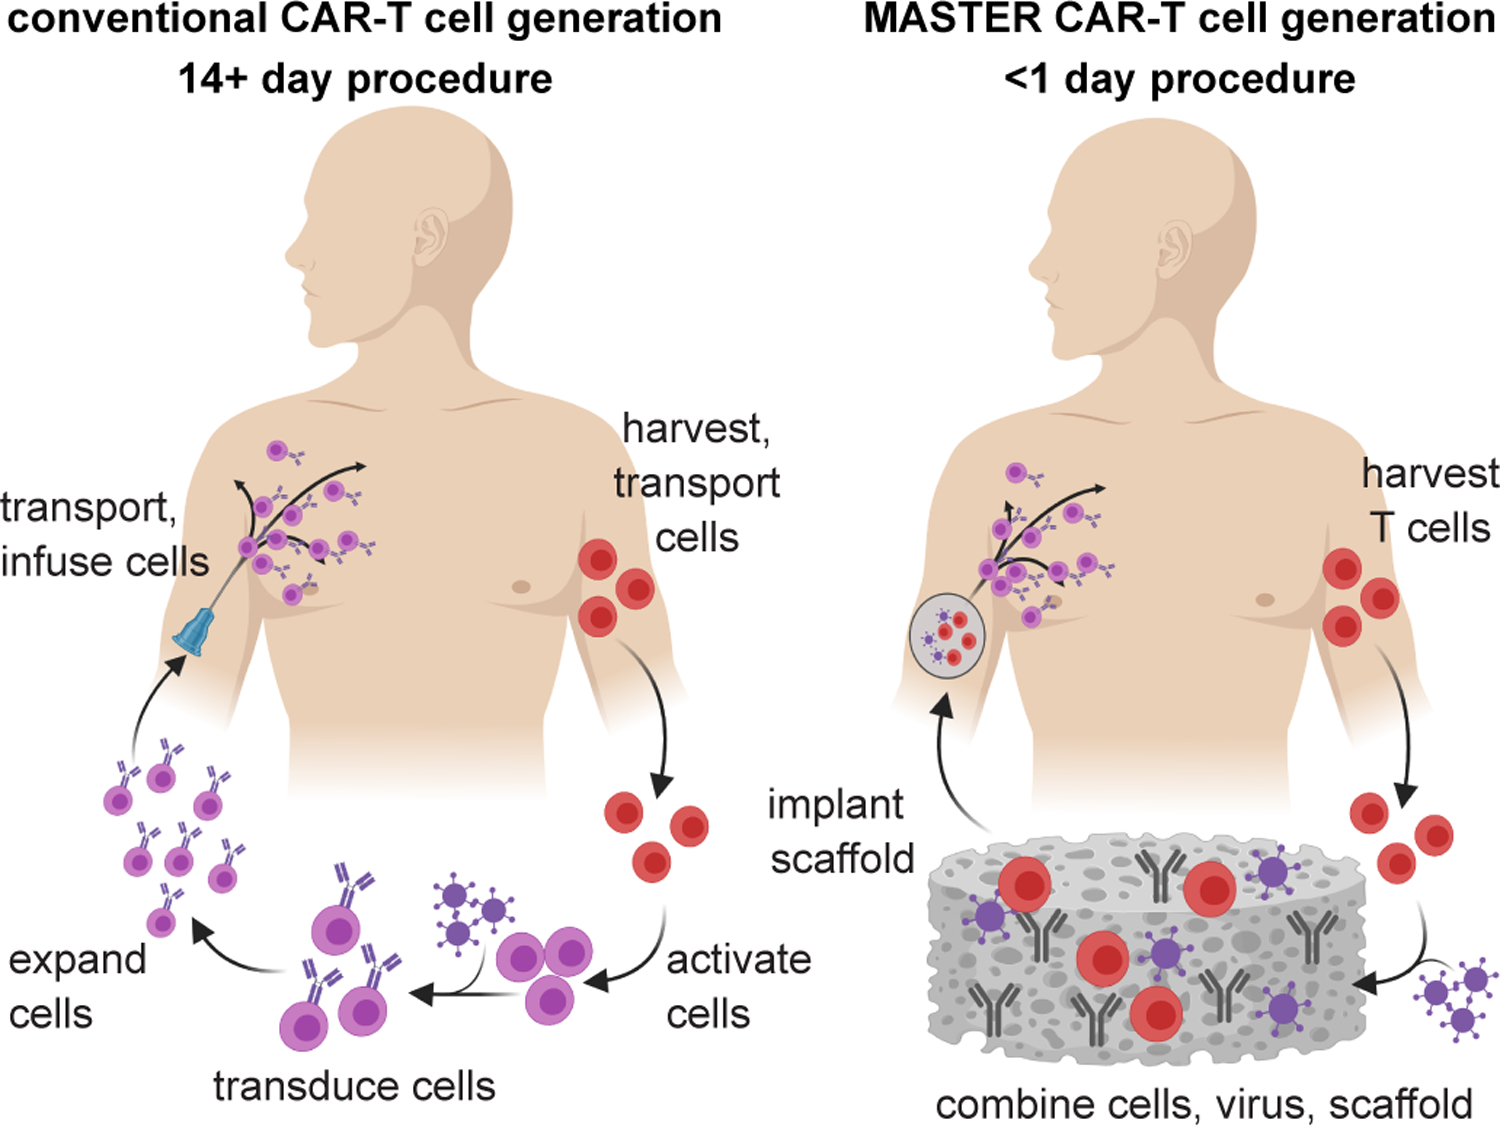
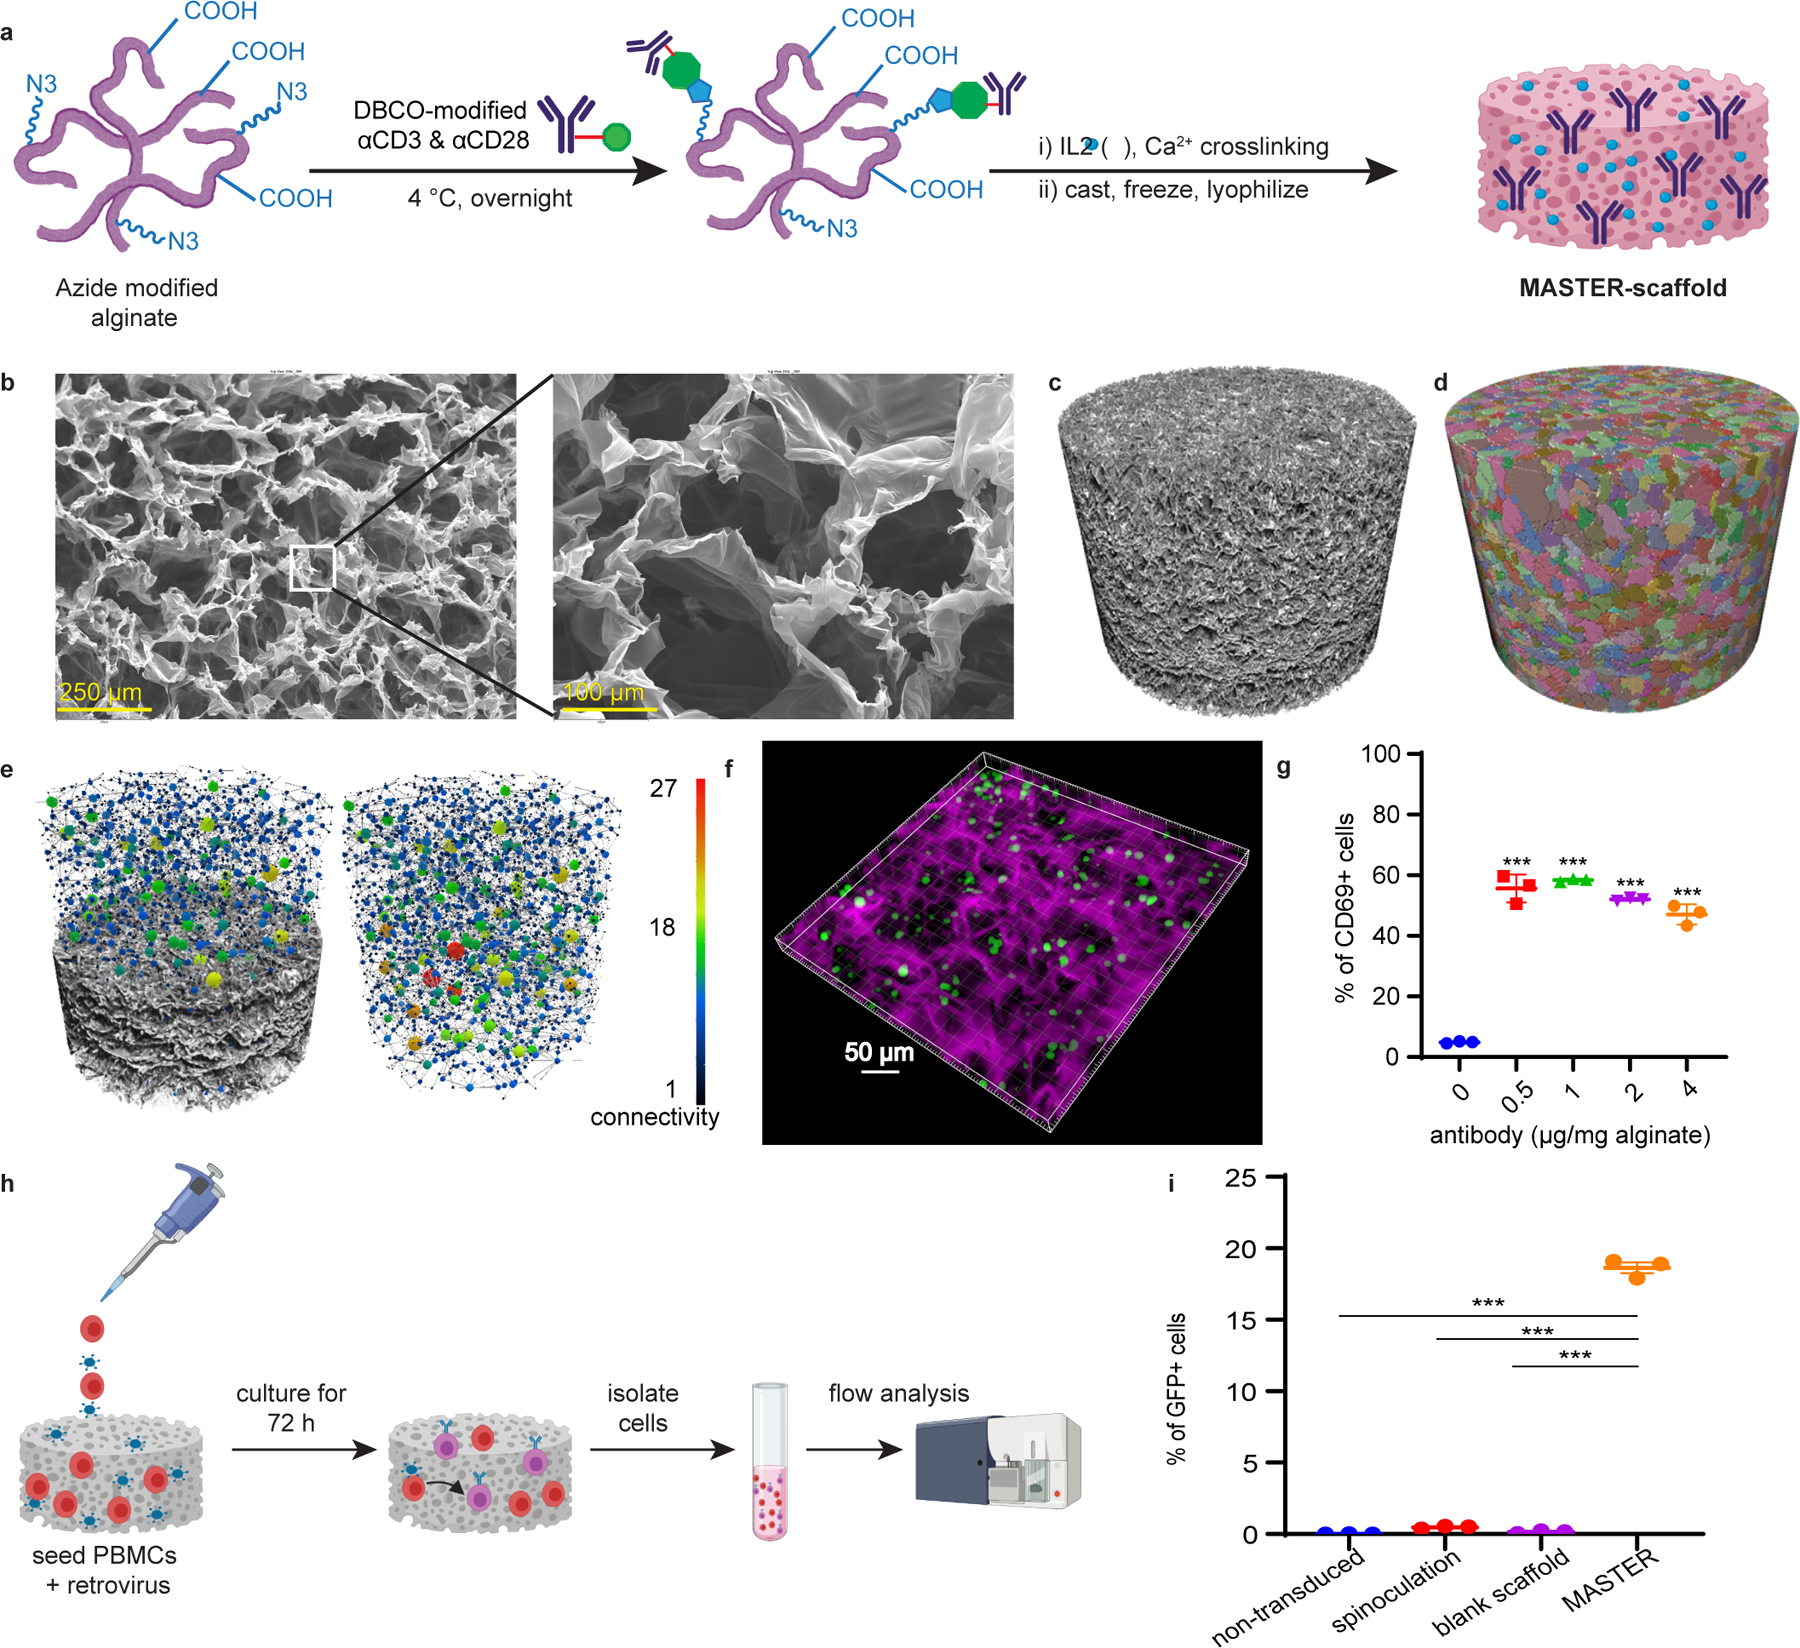
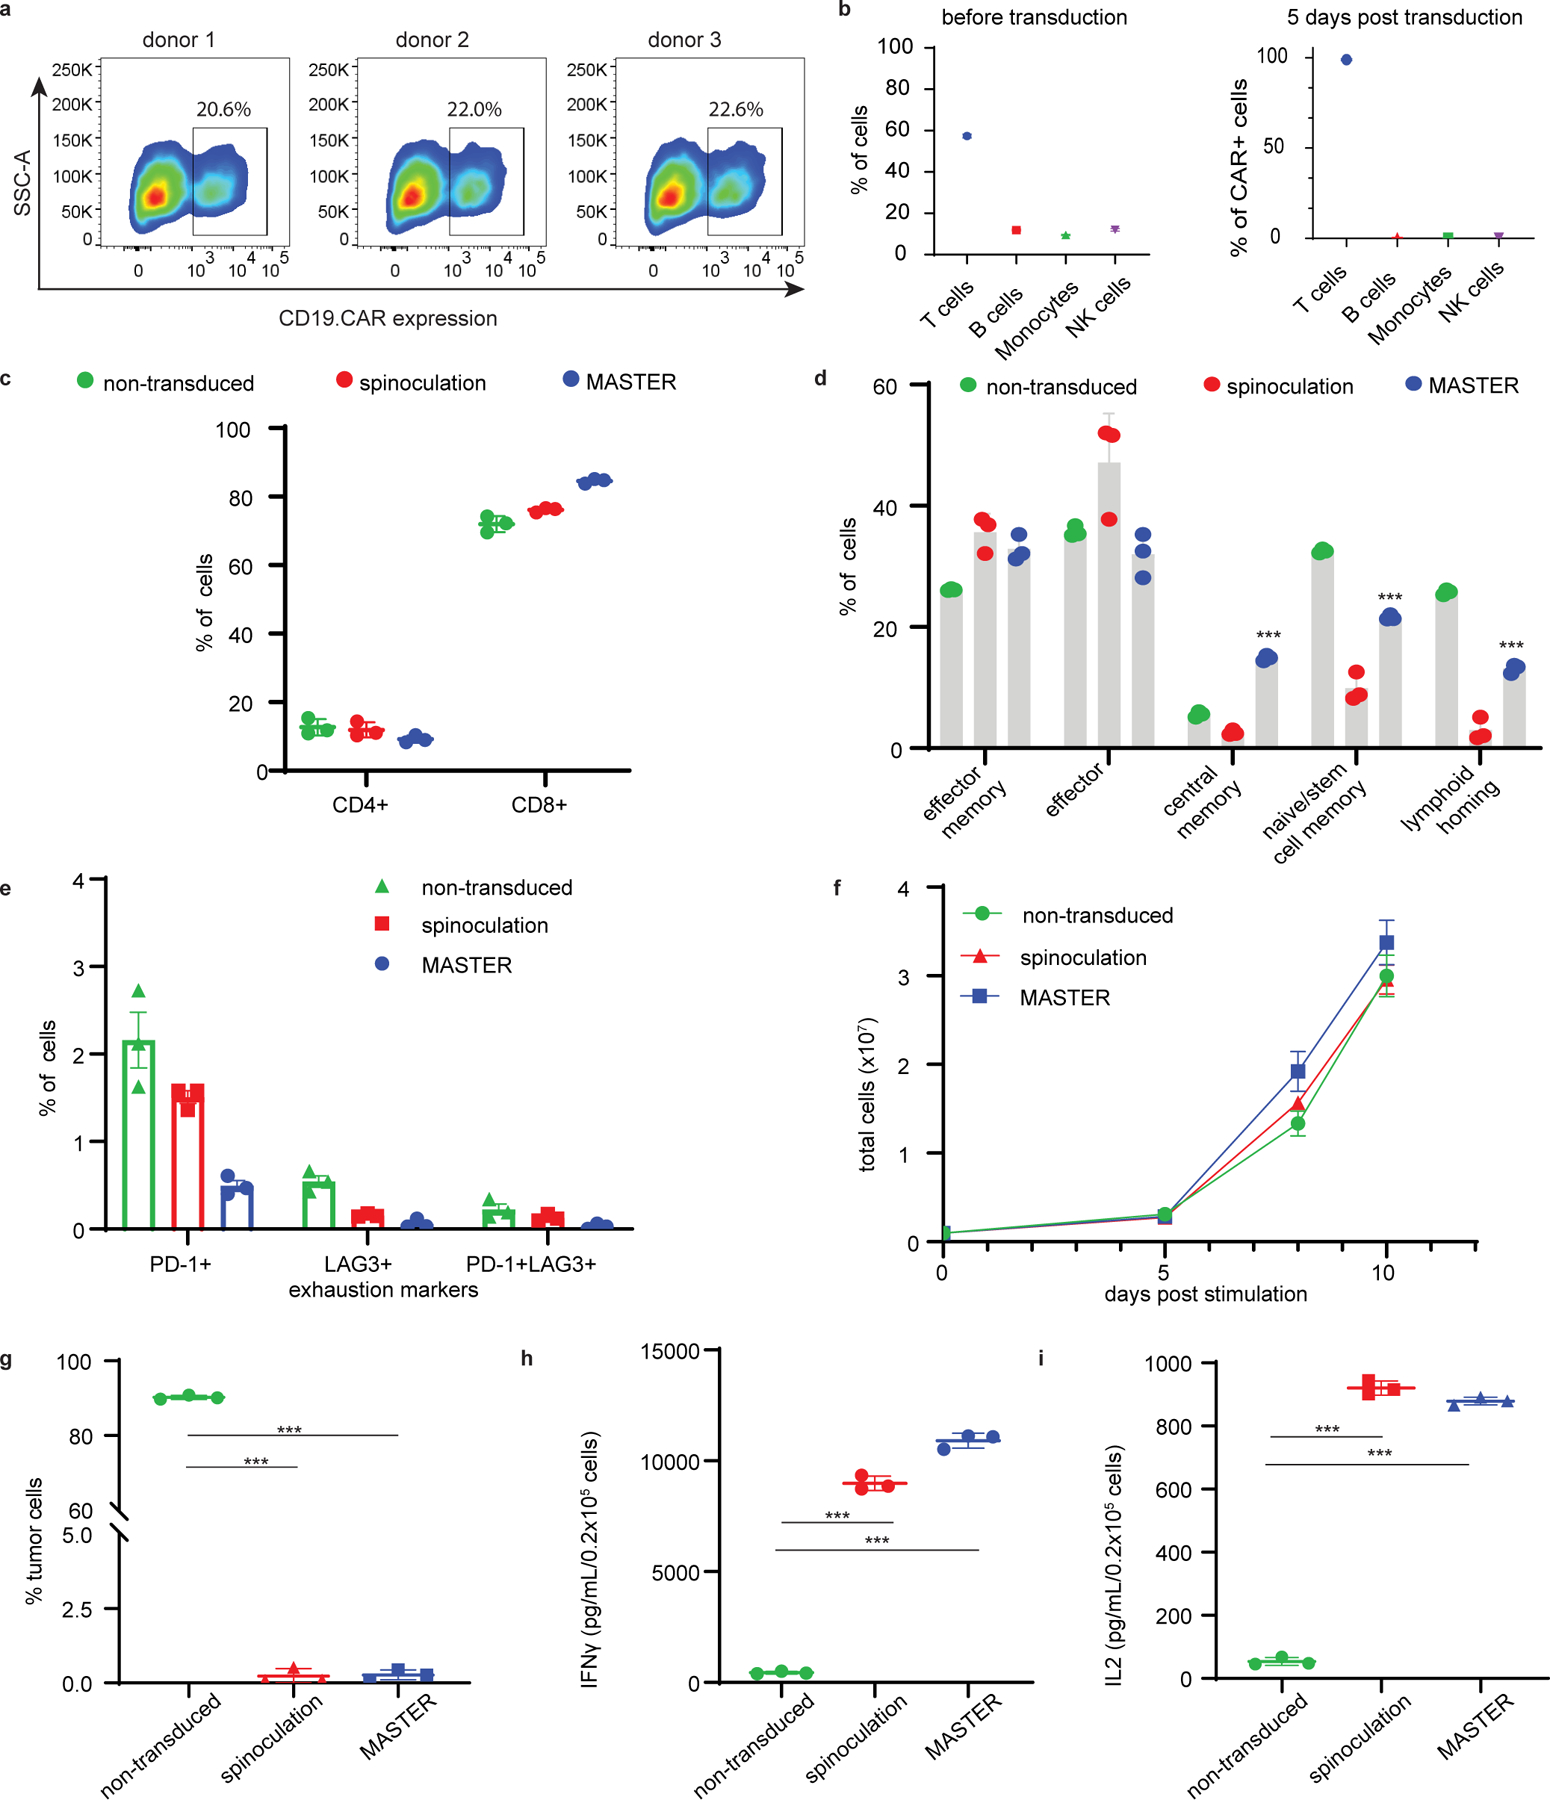
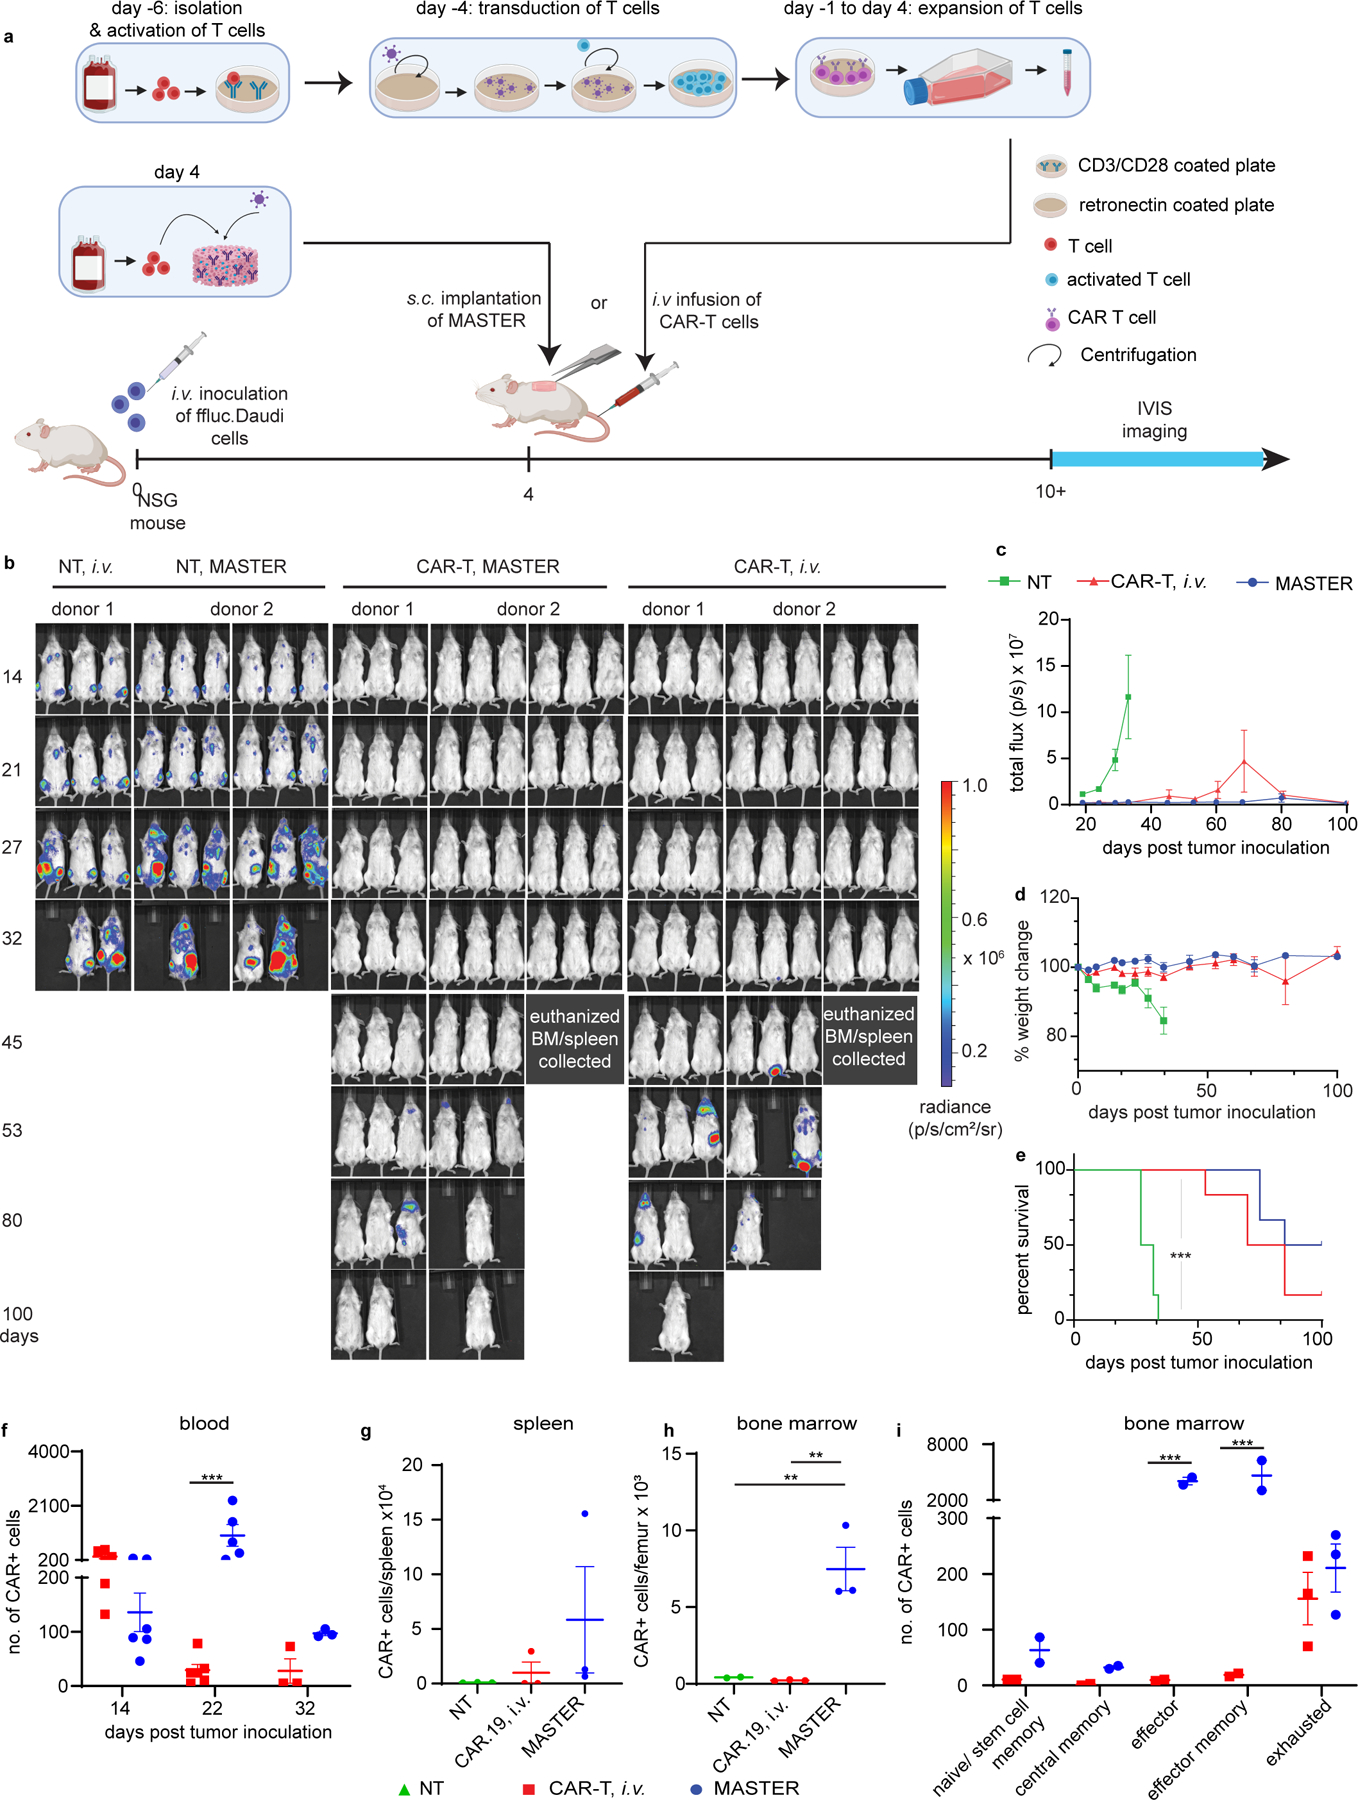
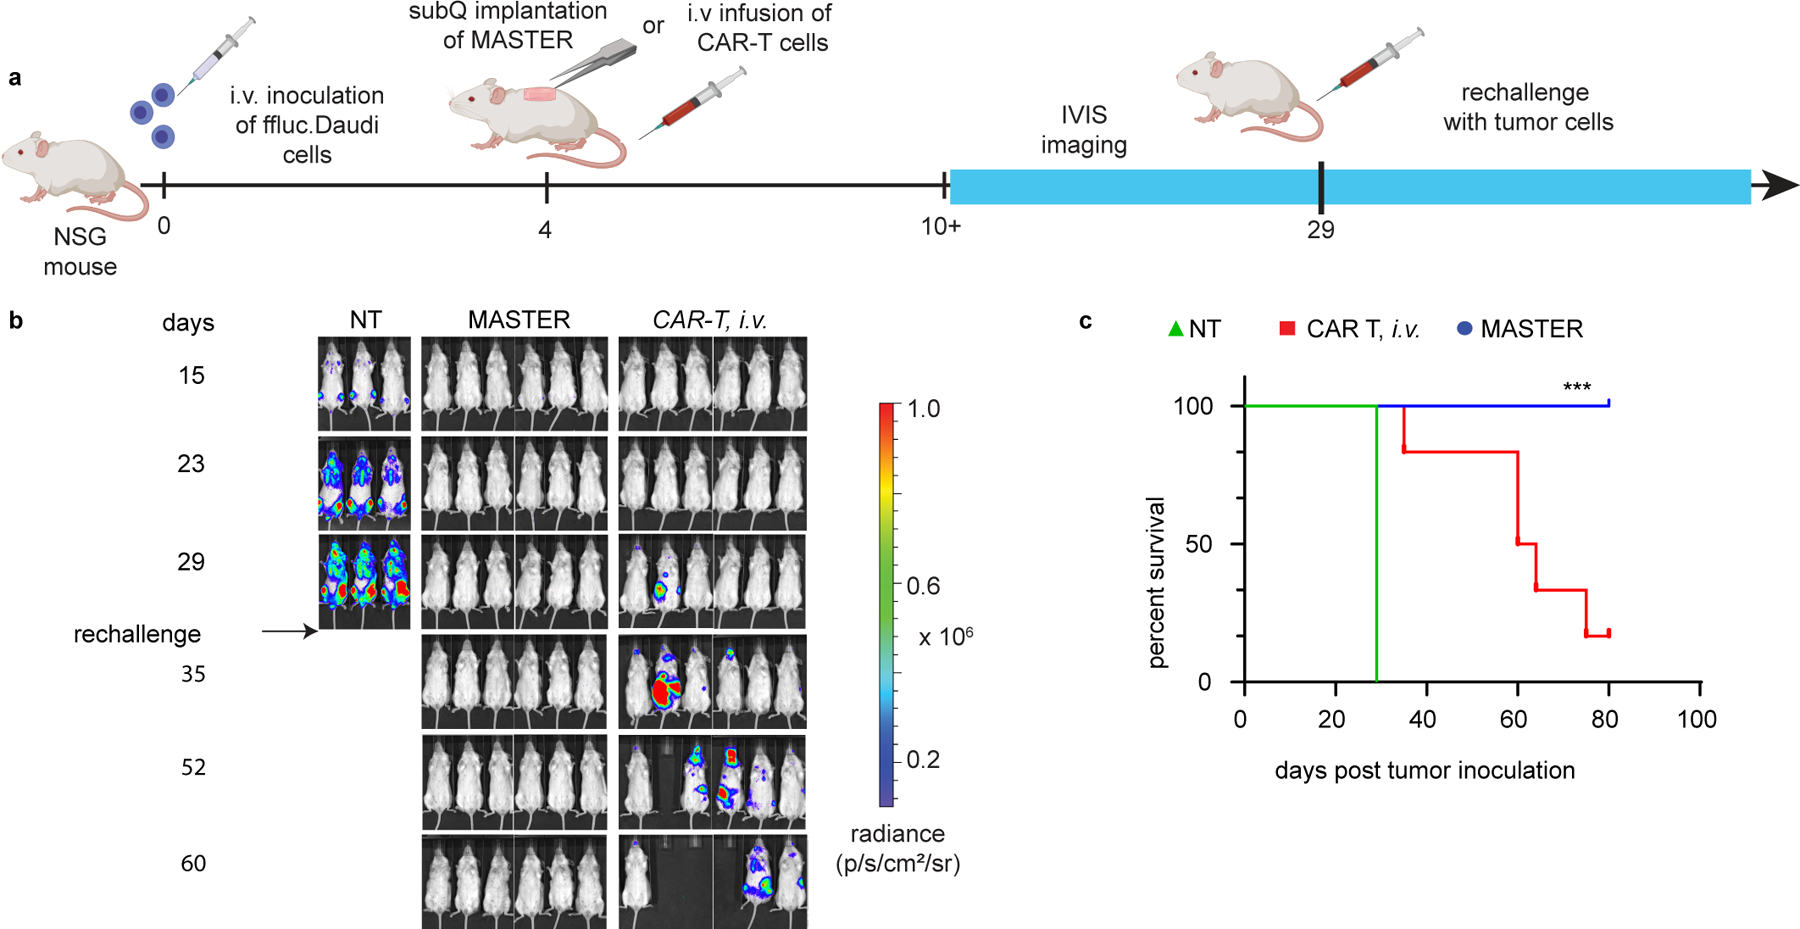
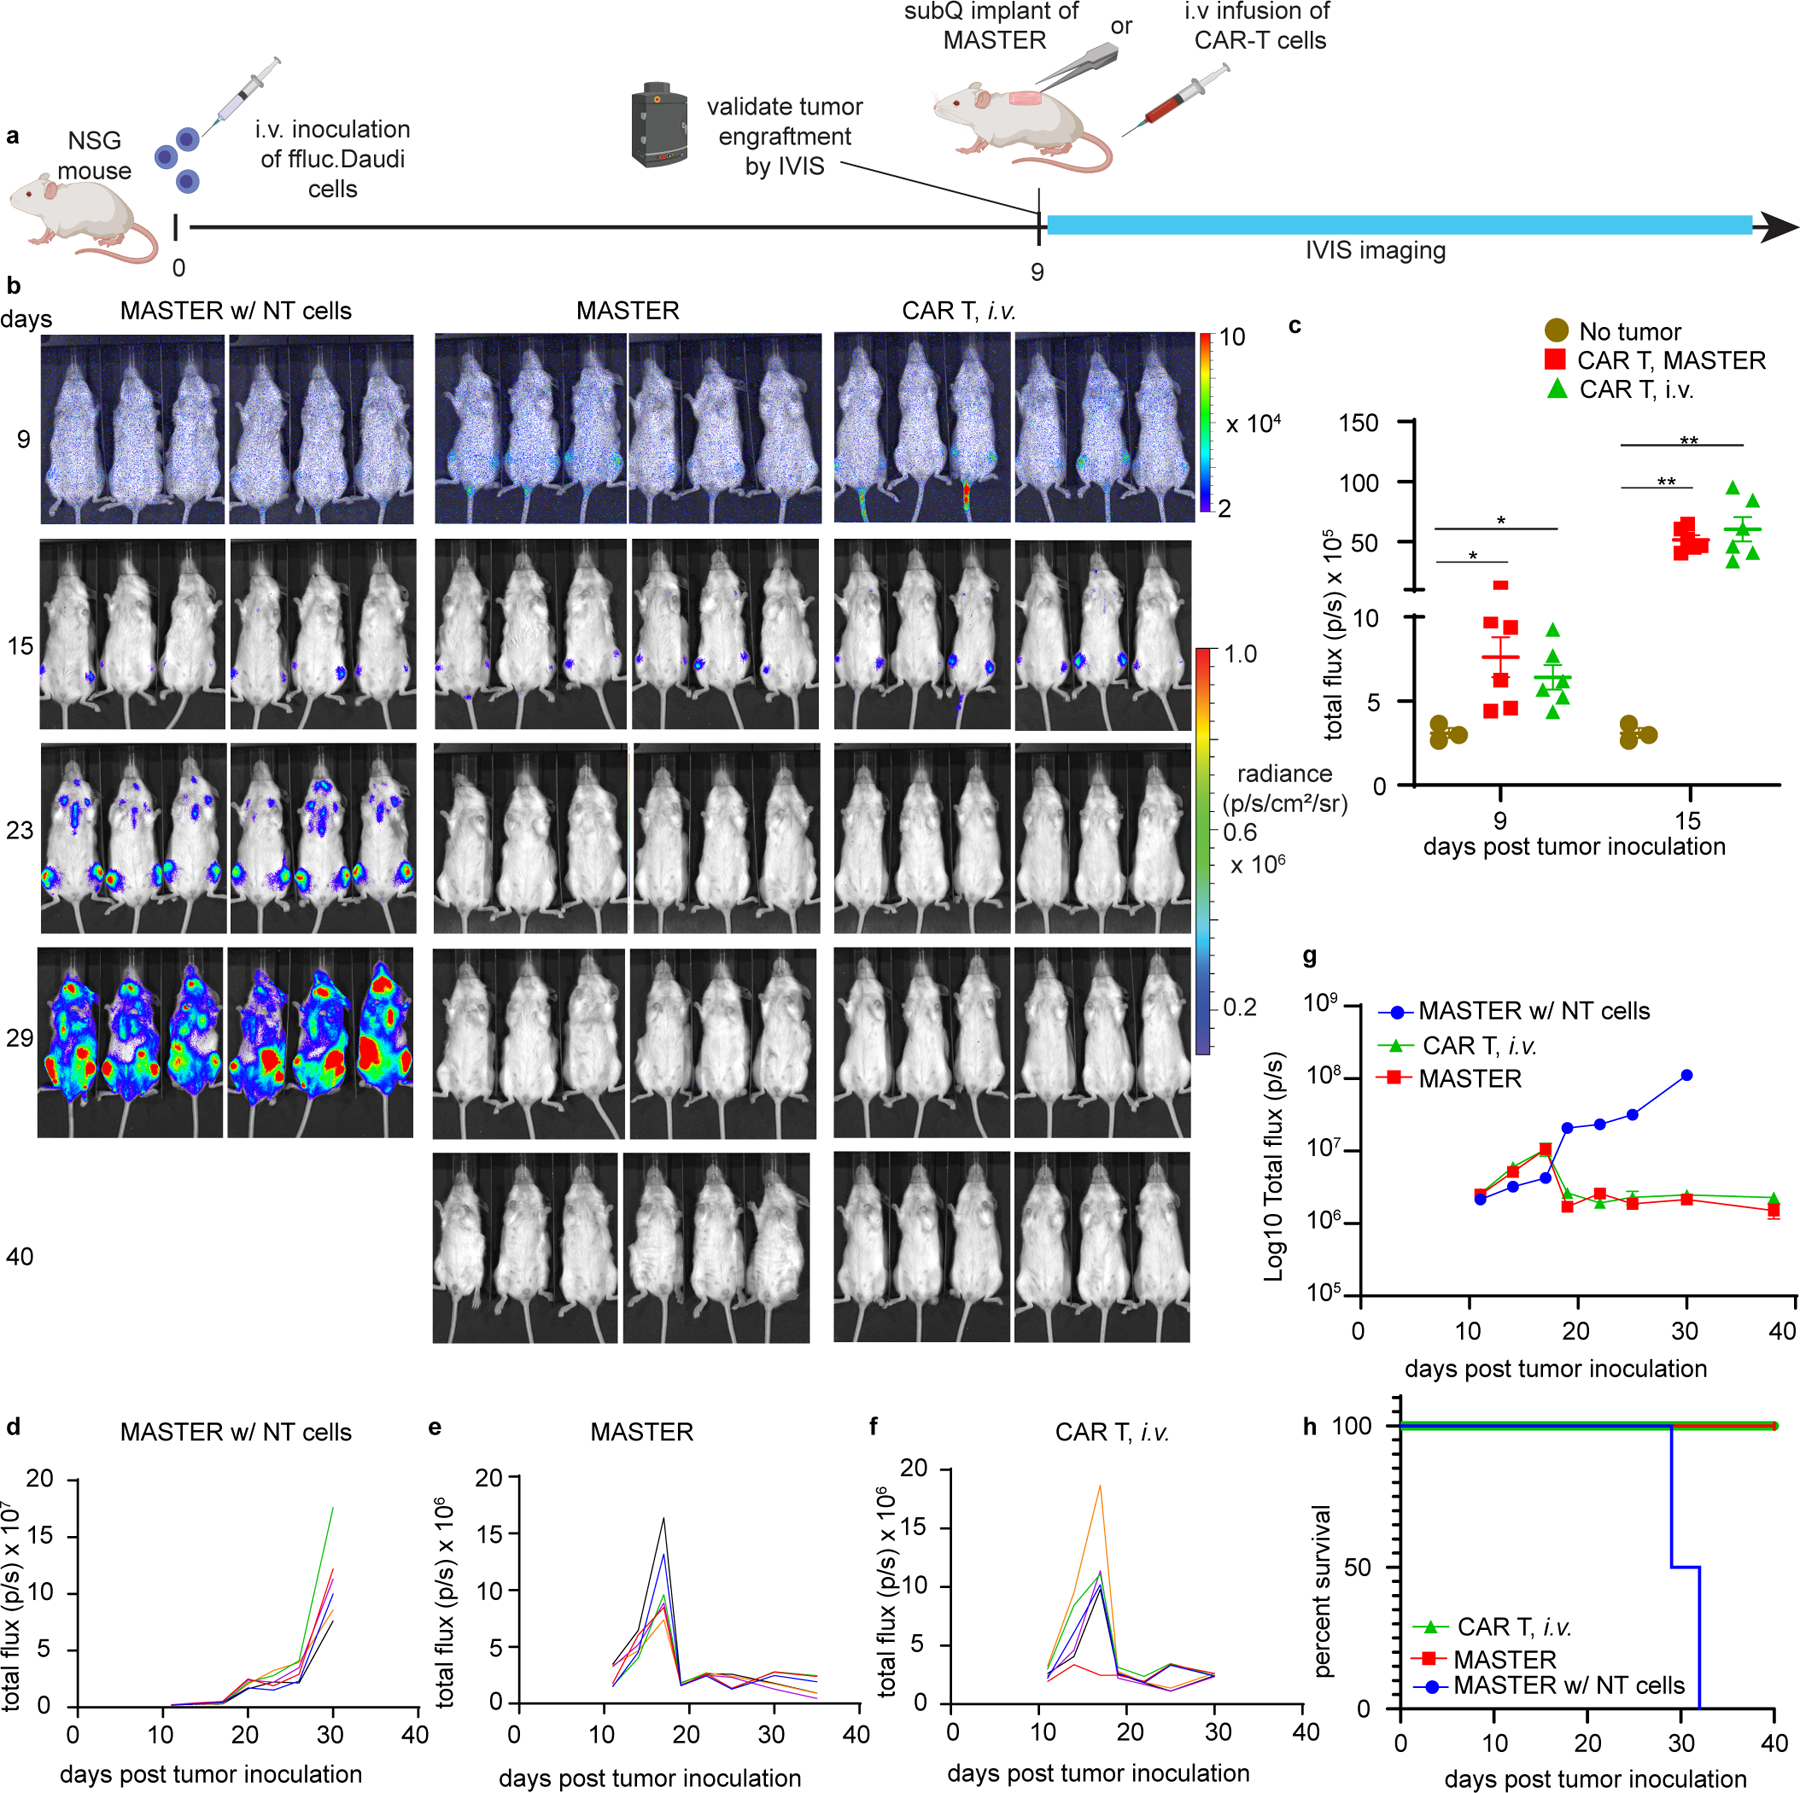
Despite their clinical success, chimeric antigen receptor (CAR)-T cell therapies for B cell malignancies are limited by lengthy, costly and labor-intensive ex vivo manufacturing procedures that might lead to cell products with heterogeneous composition. Here we describe an implantable Multifunctional Alginate Scaffold for T Cell Engineering and Release (MASTER) that streamlines in vivo CAR-T cell manufacturing and reduces processing time to a single day. When seeded with human peripheral blood mononuclear cells and CD19-encoding retroviral particles, MASTER provides the appropriate interface for viral vector-mediated gene transfer and, after subcutaneous implantation, mediates the release of functional CAR-T cells in mice. We further demonstrate that in vivo-generated CAR-T cells enter the bloodstream and control distal tumor growth in a mouse xenograft model of lymphoma, showing greater persistence than conventional CAR-T cells. MASTER promises to transform CAR-T cell therapy by fast-tracking manufacture and potentially reducing the complexity and resources needed for provision of this type of therapy.


Conflict of interest statement

Competing Interest Statement. P.A., G.D, and Y.B. are inventors on patents related to the use of biomaterials for generation of CAR-T cell therapeutics. Y.B. receives an industry-sponsored research grant related to CAR-T cell therapeutic technology (unrelated to this work). GD is a paid consultant for Bellicum Pharmaceuticals, Tessa Therapeutics and Catamaran. The other authors declare no competing interests.

Figures

Extended Data Fig. 1
Extended Data Fig. 1. Quantitative characterization of MASTER scaffold structure.
A) Scanned volume of MASTER (left) with a colored plane indicating the cross-section seen on the right. In the cross sections a brighter value indicates a higher density (scaffolds) and a darker value a lower density (air porosity). B) Relative frequency of pores of different dimensions. C) The aspect ratio of the pores showing most of the pores has an oblong shape. An aspect ratio of 1 corresponds to a sphere and close to 0 corresponds to a flat plane or stick. D) The surface area as a function of volume plotted. The total surface area inside of MASTER is roughly 810 mm2 E) Connectivity of sample showing most of the pores are connected to 0–3 other pores with a very few pores (around 6%) have more connections than 9.
Extended Data Fig. 2
Extended Data Fig. 2. Confocal images of CAR-T cells within MASTER scaffold.
3D confocal micrograph showing distribution of GFP+ T cells in AF647 labeled MASTER at 10X (A) and 40X (B) magnification. This experiment was repeated twice independently with similar results.
Extended Data Fig. 3
Extended Data Fig. 3. IL-2 loaded onto MASTER released in a sustained manner over five days in vitro and retained its bioactivity.
(A) Cumulative release of IL-2 from MASTER as quantified by ELISA assay. Data represent mean ± SD of three independent samples (B) Bioactivity of IL2 released at 24 hours as assessed by proliferation of CFSE stained T cells.
Extended Data Fig. 4
Extended Data Fig. 4. IL-2 promotes lymphocyte proliferation, but not transduction efficiency of MASTER.
(A) MASTER and MASTER without IL-2 was seeded with PBMCs and virus and number of cells were counted 5 days post transduction. *p<0.05, two tailed unpaired t test, (B) CAR.19 expression in T cells 72 h post transduction. *p<0.05, two-tailed unpaired t test. Data represent median of n=3 biologically independent samples.
Extended Data Fig. 5
Extended Data Fig. 5. MASTER functions as an efficient T cell-release system.
A) Schematic of in vitro release study. B) Percent of cells released from scaffold. Data in represent mean ± SD of n=3 independent samples.
Extended Data Fig. 6
Extended Data Fig. 6. Biocompatibility of MASTER and its components.
Representative images of H&E-stained sections of five major organs and implantation site four weeks after subcutaneous implant of MASTER, MASTER + mouse PBMCs + GFP-encoding gamma retrovirus and untreated controls in C57Bl6/J immunocompetent mice. Data is representative of three biologically independent animals.
Extended Data Fig. 7
Extended Data Fig. 7. MASTER loaded with PBMCs and retrovirus does not transduce host cells.
A) In vitro transwell model mimicking the in vivo system. B) GFP expression in fibroblast cells seeded on the bottom of transwell plate. Data represent mean ± SEM of n=3 biologically independent samples.
Extended Data Fig. 8
Extended Data Fig. 8. Characterization of host cells infiltrating MASTER.
Characterization of host cells infiltrating MASTER. A) Schematic of host cells migrating into scaffold and timeline of experiment B) Representative FACS plot showing efficient engraftment of human PBMCs (Hu-CD45+CD3+) in blood. C-D) Different subsets of mouse and human cells that infiltrated MASTER. Cells were gated on live cells. Data in d-e represent mean ± SEM and median of three biologically independent samples. E) Phenotype of the engrafted human T cells that infiltrated into the scaffold. Cells were gated on human-CD45+CD3+ cells. Data represent mean ± SEM of four biologically independent samples F) FACS plot showing no GFP expression in cells infiltrating MASTER, in blood and in the skin surrounding the scaffold.
Extended Data Fig. 9
Extended Data Fig. 9. Similar numbers of exhausted cells in blood of mice with conventional and MASTER-generated CAR-T cells.
Immunophenotypic composition of CAR-T cells in blood of mice treated with conventionally expanded CAR-T cells i.v. (A) or MASTER (B) at day 12 and 22 post tumor inoculation. Data in (A) represents mean ± SD of six experimental replicates. Data in (B) represent mean ± SEM of five experimental replicates.
Extended Data Fig. 10
Extended Data Fig. 10. Subcutaneously implanted MASTER exhibited better control of tumor growth and ex-tended survival compared under stressed dose conditions
A) Timeline of the study B) In vivo tumor biolumines-cence imaging (BLI) of NSG mice (n=6) treated with MASTER, conventional CAR-T cells, or control non-transduced (NT) cells. Mice were treated with 0.5 x 10⁶ (left), 0.25 x 10⁶ (middle), or 0.125 x 10⁶ (right) CAR T cells. PBMCs seeded onto MASTER were normalized to transduction efficiency and both groups (MASTER and CAR T, i.v) were treated with equivalent number of CAR T cells. C-E) Survival of mice shown as Kaplan- Meier curves. **p < 0.01; ***p < 0.001 Log-rank (Mantel-Cox) test, Gehan-Breslow-Wilcoxon test.
Figure 1:
Figure 1:
Schematic showing conventional CAR-T cell therapy (left, 2–4 weeks process) compared to rapid MASTER-mediated CAR T cell generation and therapy (right, <1 day process).
Figure 2.
Figure 2.. MASTER promotes activation and retrovirus-mediated transduction of primary human T cells.
A) Schematic for synthesis of MASTER. B) SEM image of MASTER showing homogenous macroporous structure throughout the scaffold. C) Xray-CT volume of MASTER. D) Individual pores were isolated and color labeled so that similar pore volumes have similar colors. E) Isolated pores can be analyzed individually to calculate porosity (75.8%) as well as to analyze connectivity between the pores. Connectivity maps display individual pore as spheres with lines signifying connections to neighbors. Sphere size and coloring signify connectivity. A partial cut into sample showing the connectivity (left) and full the connectivity in sample (right). F) 3D confocal fluorescence micrograph of GFP+ T cells in AlexaFluor-647 labeled MASTER, depicting cell distribution along the pores. G) Quantification of T cells expressing CD69, an early T cell activation marker. MASTER with increasing amounts of anti-CD3 and anti-CD28 antibodies were seeded with PBMCs and analyzed for CD69+ cells after 24 hours by flow cytometry. (***p<0.001, one-way ANOVA with Tukey’s correction). Data represent mean ± SD of n=3 biologically independent samples H) Overview of the process of MASTER-mediated T cell transduction in vitro. PBMCs and gamma retroviral particles are seeded on MASTER and incubated at 37°C. After seventy-two hours, cells are collected from the scaffold and analyzed by flow cytometry. I) FACS quantification of GFP+ cells (***p<0.001, one-way ANOVA with Tukey’s correction). Data represent mean ± SEM of n=3 biologically independent samples.
Figure 3.
Figure 3.. MASTER-mediated gene transfer generates highly functional CAR-T cells.
A) Flow cytometric plots depicting CD19.CAR expression in T cells transduced on MASTER. B) MASTER mediated retroviral transduction of PBMCs results in T cell enriched cell population. PBMC fractions before transduction (left) and PBMC fraction 5 days post transduction (right). C,D) Immunophenotypic composition of CAR-T cells obtained via MASTER-mediated transduction of PBMCs or by conventional spinoculation of activated T cells at day 12 of culture. Non-transduced cells were used as control. Analysis was performed gating on CAR-expressing T cells except for non-transduced cells. E) FACS quantification of CAR+ cells expressing exhaustion markers PD-1 and/or LAG-3. F) Ex vivo expansion of non-transduced T cells or T cells transduced on MASTER or by spinoculation. G) Percentage of viable CD19+ Daudi cells when co-cultured with non-transduced cells, CAR-T cells obtained by MASTER or by spinoculation. Tumor cells and CAR-T cells were plated at 1:5 effector to target ratio. T cells and tumor cells were quantified by flow cytometry at day 5 of co-culture. H, I) IFN-γ and IL-2 released into the co-culture supernatant by MASTER-generated, spinoculation-generated CAR-T cells and non-transduced cells after 24 hours as assessed by ELISA. ***P < 0.001; one-way ANOVA with Tukey correction. All data represented as the mean ± SD from three experiments, each derived from a different PBMC donor.
Figure 4:
Figure 4:. Subcutaneously implanted MASTER generates and release fully functional CAR-T cells in a xenograft model of lymphoma.
A) Experimental timeline of the lymphoma xenograft model in NSG mice engrafted with FFLuc- labeled CD19+ human Daudi tumor cells. B) In vivo tumor bioluminescence imaging (BLI) of NSG mice treated with MASTER, conventional CAR-T cells or control non-transduced (NT) cells. C) Kinetics of tumor growth measured by quantification of BLI. D) Percentage change in body weight (BW) of treated mice. Data in c-d represent mean ± SEM of nine biologically independent animals examined over two independent experiments. E) Survival of mice shown as Kaplan- Meier curves. Six mice per treatment group are shown. ***p<0.001, Log-rank (Mantel-Cox) test, Gehan-Breslow-Wilcoxon test. F) Flow cytometric quantification of CD3+CAR+ cells in peripheral blood of mice described in (A). ***p<0.001, two-way ANOVA with Sidak’s multiple comparison test G, H) Quantification of CD3+CAR+ cells in bone marrow and spleen of mice euthanized on day 32 in the model described in (A) determined by flow cytometry **p<0.01, one-way ANOVA with Tukey’s correction Data in f-h represent mean ± SEM of three biologically independent samples I) Analysis of memory and exhaustion markers in CAR T cells isolated from the bone marrow of mice treated as described in (A). Data in i represent mean ± SEM of two biologically independent samples.
Figure 5:
Figure 5:. Subcutaneously implanted MASTER outperforms i.v. administered CAR-T cells in a rechallenge model of lymphoma
A) Experimental timeline of the lymphoma xenograft model in NSG mice engrafted and rechallenged with FFLuc labeled CD19+ human Daudi tumor cells. B) In vivo tumor bioluminescence imaging of NSG mice treated with MASTER, conventional CAR-T cells or control non-transduced (NT) cells. C) Survival of mice shown as Kaplan-Meier curves. Six mice per treatment group are shown. ***p<0.001 w.r.t CAR T, MASTER, Log-rank (Mantel-Cox) test, Gehan-Breslow-Wilcoxon test.
Figure 6:
Figure 6:. MASTER and conventional CAR T cells exhibit equal anti-tumor efficacy against established tumor in vivo.
A) Experimental timeline of the lymphoma xenograft model in NSG mice engrafted with FFLuc-labeled CD19+ human Daudi tumor cells. B) In vivo tumor bioluminescence imaging of NSG mice treated with MASTER, conventional CAR-T cells or control non-transduced (NT) cells. Cells were normalized to transduction efficiency and mice were treated with equivalent number of CAR T cells (2 x 10⁶ CAR T cells/mouse). C) Engraftment of the established tumor as confirmed on day 9 and day 15 by comparing luminescent intensity of healthy mice (background, n = 3 biologically independent animals) and tumor bearing mice (n = 6 biologically independent animals). (*p<0.05, **p<0.01, two-tailed unpaired t test). Data represent mean ± SEM D-F) Kinetics of tumor growth measured by quantification of luminescence. G) Combine tumor growth kinetics shown on logarithmic plot (n = 6 biologically independent animals). Data represent mean ± SEM H) Survival of mice shown as Kaplan- Meier curves. Six mice per treatment group are shown.

References

    1. Lee DW et al. T cells expressing CD19 chimeric antigen receptors for acute lymphoblastic leukaemia in children and young adults: a phase 1 dose-escalation trial. Lancet 385, 517–528 (2015). - PMC - PubMed
    1. Maude SL et al. Chimeric antigen receptor T cells for sustained remissions in leukemia. N. Engl. J. Med 371, 1507–1517 (2014). - PMC - PubMed
    1. Enblad G et al. A Phase I/IIa Trial Using CD19-Targeted Third-Generation CAR T Cells for Lymphoma and Leukemia. Clin. Cancer Res 24, 6185–6194 (2018). - PubMed
    1. Ramos CA, Savoldo B & Dotti G CD19-CAR trials. Cancer J 20, 112–118 (2014). - PMC - PubMed
    1. Prasad V Immunotherapy: Tisagenlecleucel - the first approved CAR-T-cell therapy: implications for payers and policy makers. Nat. Rev. Clin. Oncol 15, 11–12 (2018). - PubMed

Publication types