. 2022 Dec;36(6):1869-1879.
doi: 10.1007/s10877-022-00840-2. Epub 2022 Mar 25.

Assessment of neonatal respiratory rate variability

Affiliations

Assessment of neonatal respiratory rate variability

Jesse Coleman et al. J Clin Monit Comput. 2022 Dec.

Abstract

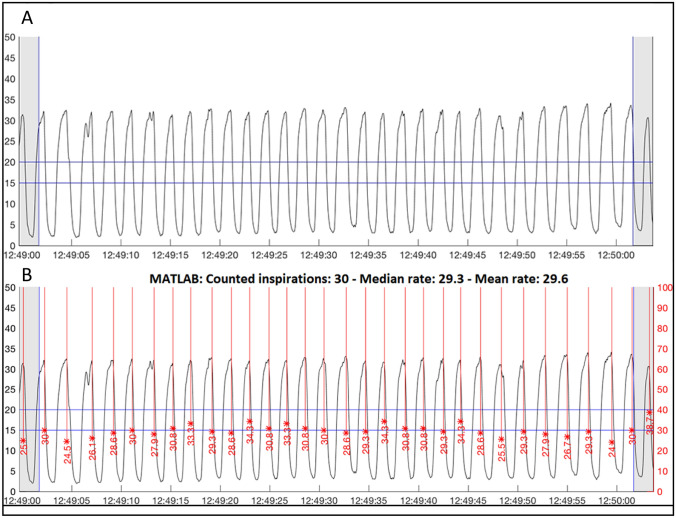
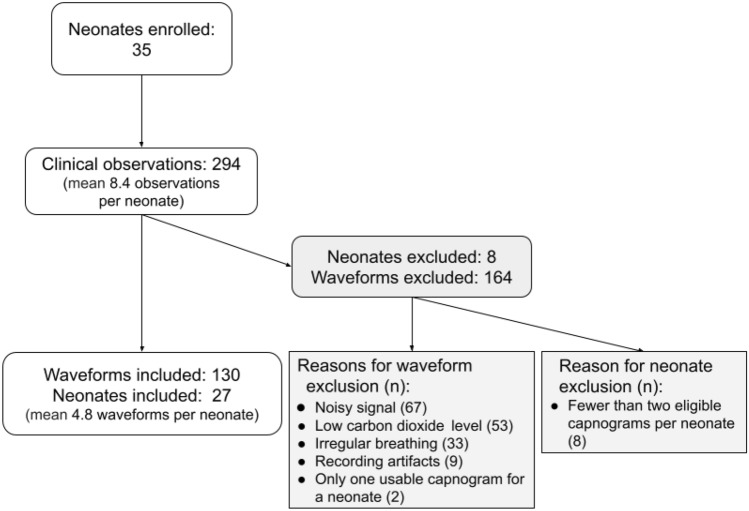
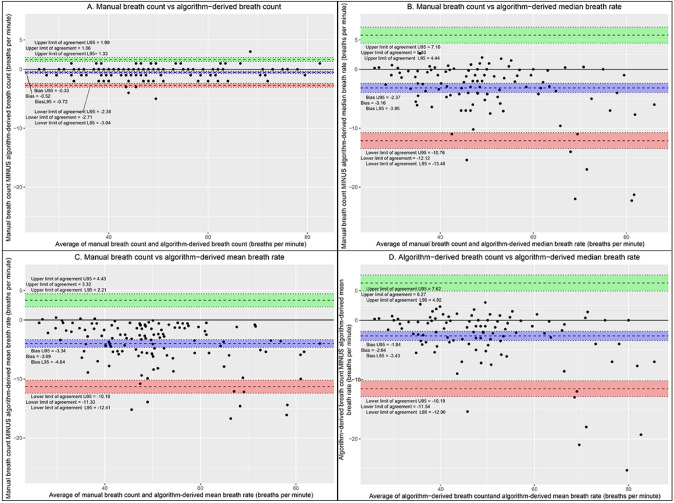
Accurate measurement of respiratory rate (RR) in neonates is challenging due to high neonatal RR variability (RRV). There is growing evidence that RRV measurement could inform and guide neonatal care. We sought to quantify neonatal RRV during a clinical study in which we compared multiparameter continuous physiological monitoring (MCPM) devices. Measurements of capnography-recorded exhaled carbon dioxide across 60-s epochs were collected from neonates admitted to the neonatal unit at Aga Khan University-Nairobi hospital. Breaths were manually counted from capnograms and using an automated signal detection algorithm which also calculated mean and median RR for each epoch. Outcome measures were between- and within-neonate RRV, between- and within-epoch RRV, and 95% limits of agreement, bias, and root-mean-square deviation. Twenty-seven neonates were included, with 130 epochs analysed. Mean manual breath count (MBC) was 48 breaths per minute. Median RRV ranged from 11.5% (interquartile range (IQR) 6.8-18.9%) to 28.1% (IQR 23.5-36.7%). Bias and limits of agreement for MBC vs algorithm-derived breath count, MBC vs algorithm-derived median breath rate, MBC vs algorithm-derived mean breath rate were - 0.5 (- 2.7, 1.66), - 3.16 (- 12.12, 5.8), and - 3.99 (- 11.3, 3.32), respectively. The marked RRV highlights the challenge of performing accurate RR measurements in neonates. More research is required to optimize the use of RRV to improve care. When evaluating MCPM devices, accuracy thresholds should be less stringent in newborns due to increased RRV. Lastly, median RR, which discounts the impact of extreme outliers, may be more reflective of the underlying physiological control of breathing.

Keywords: Child health; Critical care; Delivery of health care; Diagnosis; Patient care.


Conflict of interest statement

All authors declare no competing interests.

Figures

Fig. 1
Fig. 1
Example capnograms (carbon dioxide (CO2) waveform plots) before (A) and after (B) algorithm processing. The plotted CO2 waveform shows the breathing pattern of a neonate and algorithm-derived identification of breaths (red, vertical lines). Only peaks on the white background were included; peaks that fell within the grey zone were ignored as they were outside the 60-s epoch. A Plotted waveform from example epoch before processing by the algorithm. Each peak within the 60-s epoch was counted by one to three trained observers. The horizontal blue 15 and 20 lines were used to assist observers during irregular or incomplete breaths (not shown). B Plotted waveform after processing by algorithm. The red vertical lines show identified peaks, with the length and label of the red line representing the calculated breath rate based on the breath duration
Fig. 2
Fig. 2
Recruitment flow diagram
Fig. 3
Fig. 3
Graphic representations of respiratory rate variability in all epochs (n = 130). A Histogram showing respiratory rate variability of all epochs. B Manual breath count for all epochs, grouped by neonate. Within-neonate variability is identified in each individual boxplot identifying the mean manual breath count and interquartile range. Between-neonate variability is identified by comparing the boxplots. C Graphical representations of the within-neonate respiratory rate variability trends over time for epochs at 10-min and 60-min intervals. Each line represents a neonate’s trend line showing the normalized within-epoch coefficient of variation or respiratory rate variability over time across subsequent epochs
Fig. 4
Fig. 4
Bland–Altman plots comparing manual breath count vs algorithm-derived breath count (A), manual breath count vs algorithm-derived median breath rate (B), manual breath count vs algorithm-derived mean breath rate (C), and algorithm-derived breath count vs algorithm-derived median breath rate (D)

References

    1. Palafox M, Guiscafré H, Reyes H, Munoz O, Martínez H. Diagnostic value of tachypnoea in pneumonia defined radiologically. Arch Dis Child. 2000;82:41–45. doi: 10.1136/adc.82.1.41. - DOI - PMC - PubMed
    1. Amirav I, Lavie M. Rethink respiratory rate for diagnosing childhood pneumonia. EClinicalMedicine. 2019;12:6–7. doi: 10.1016/j.eclinm.2019.06.013. - DOI - PMC - PubMed
    1. Fieselmann JF, Hendryx MS, Helms CM, Wakefield DS. Respiratory rate predicts cardiopulmonary arrest for internal medicine inpatients. J Gen Intern Med. 1993;8:354–360. doi: 10.1007/BF02600071. - DOI - PubMed
    1. World Health Organization. Integrated management of childhood illness: caring for newborns and children in the community; 2011.
    1. Simoes EA, Roark R, Berman S, Esler LL, Murphy J. Respiratory rate: measurement of variability over time and accuracy at different counting periods. Arch Dis Child. 1991;66:1199–1203. doi: 10.1136/adc.66.10.1199. - DOI - PMC - PubMed

Publication types

LinkOut - more resources