. 2022 Oct;22(5):952-968.
doi: 10.3758/s13415-022-00992-3. Epub 2022 Mar 24.

The PRO model accounts for the anterior cingulate cortex role in risky decision-making and monitoring

Affiliations

The PRO model accounts for the anterior cingulate cortex role in risky decision-making and monitoring

Jae Hyung Woo et al. Cogn Affect Behav Neurosci. 2022 Oct.

Abstract

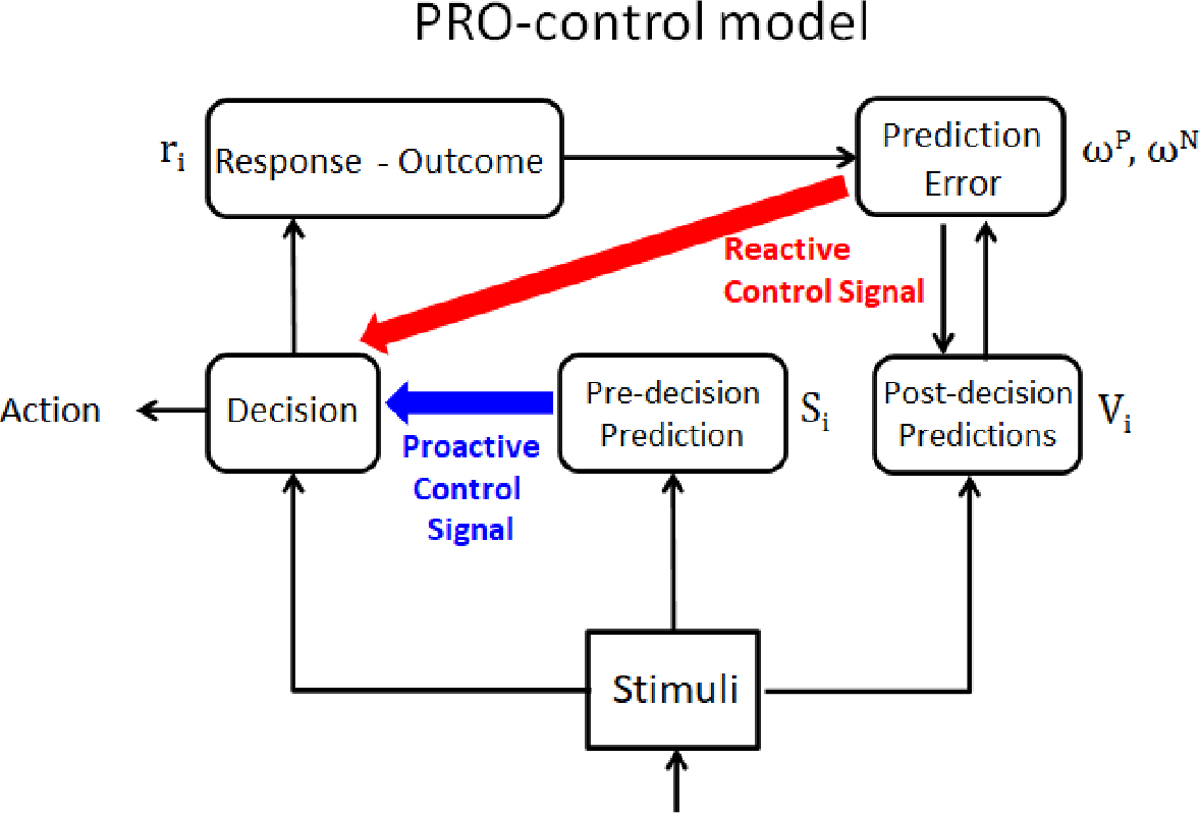
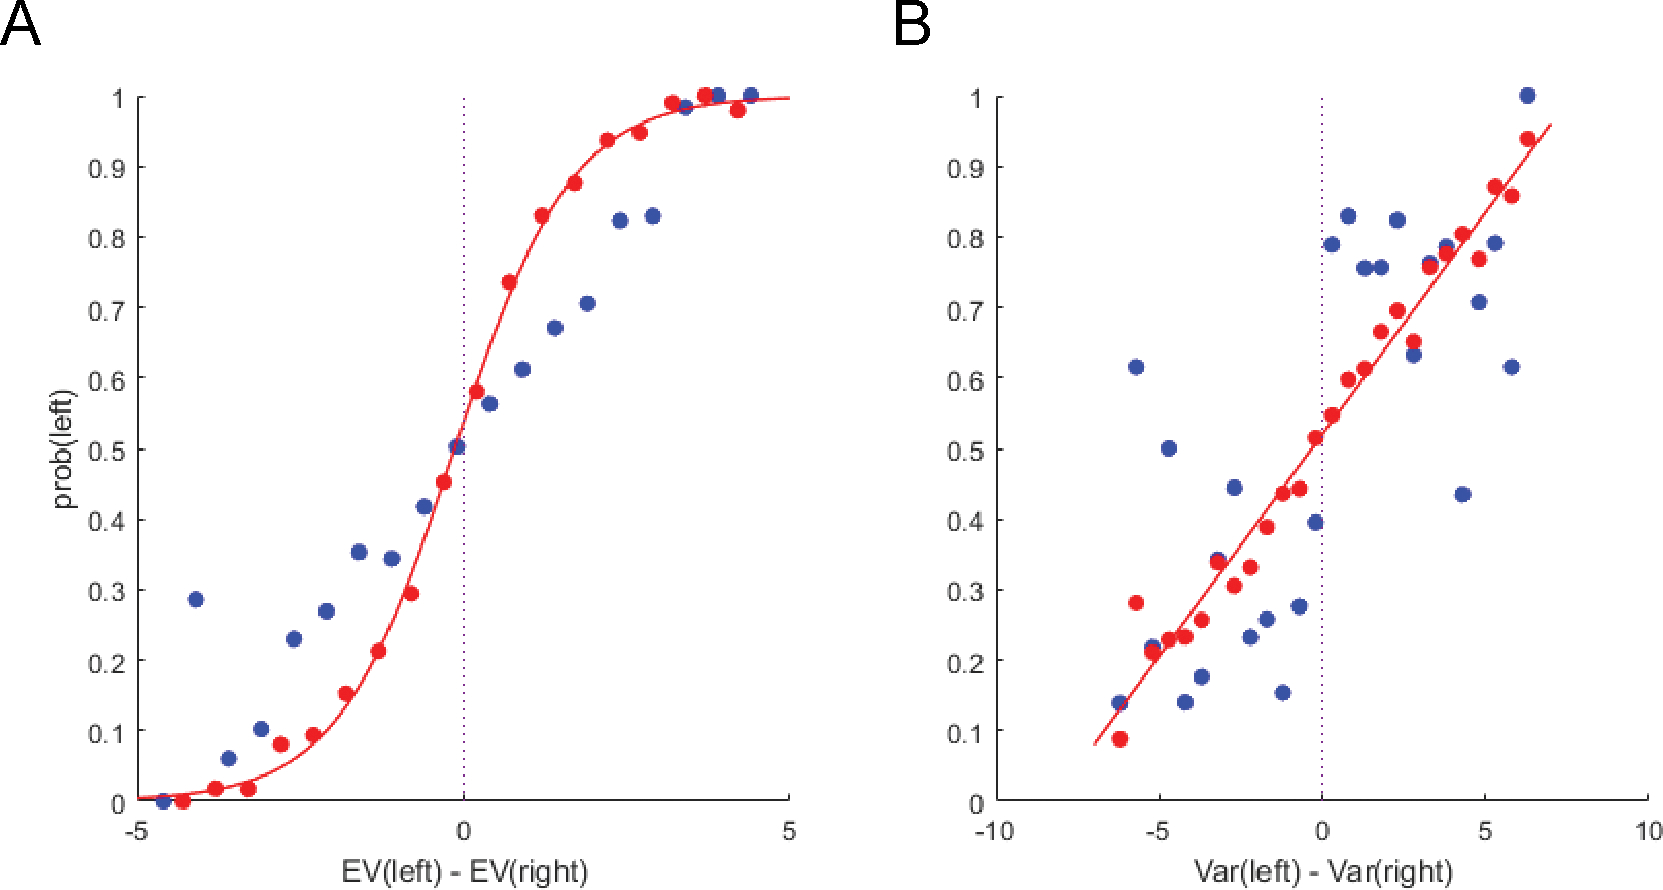
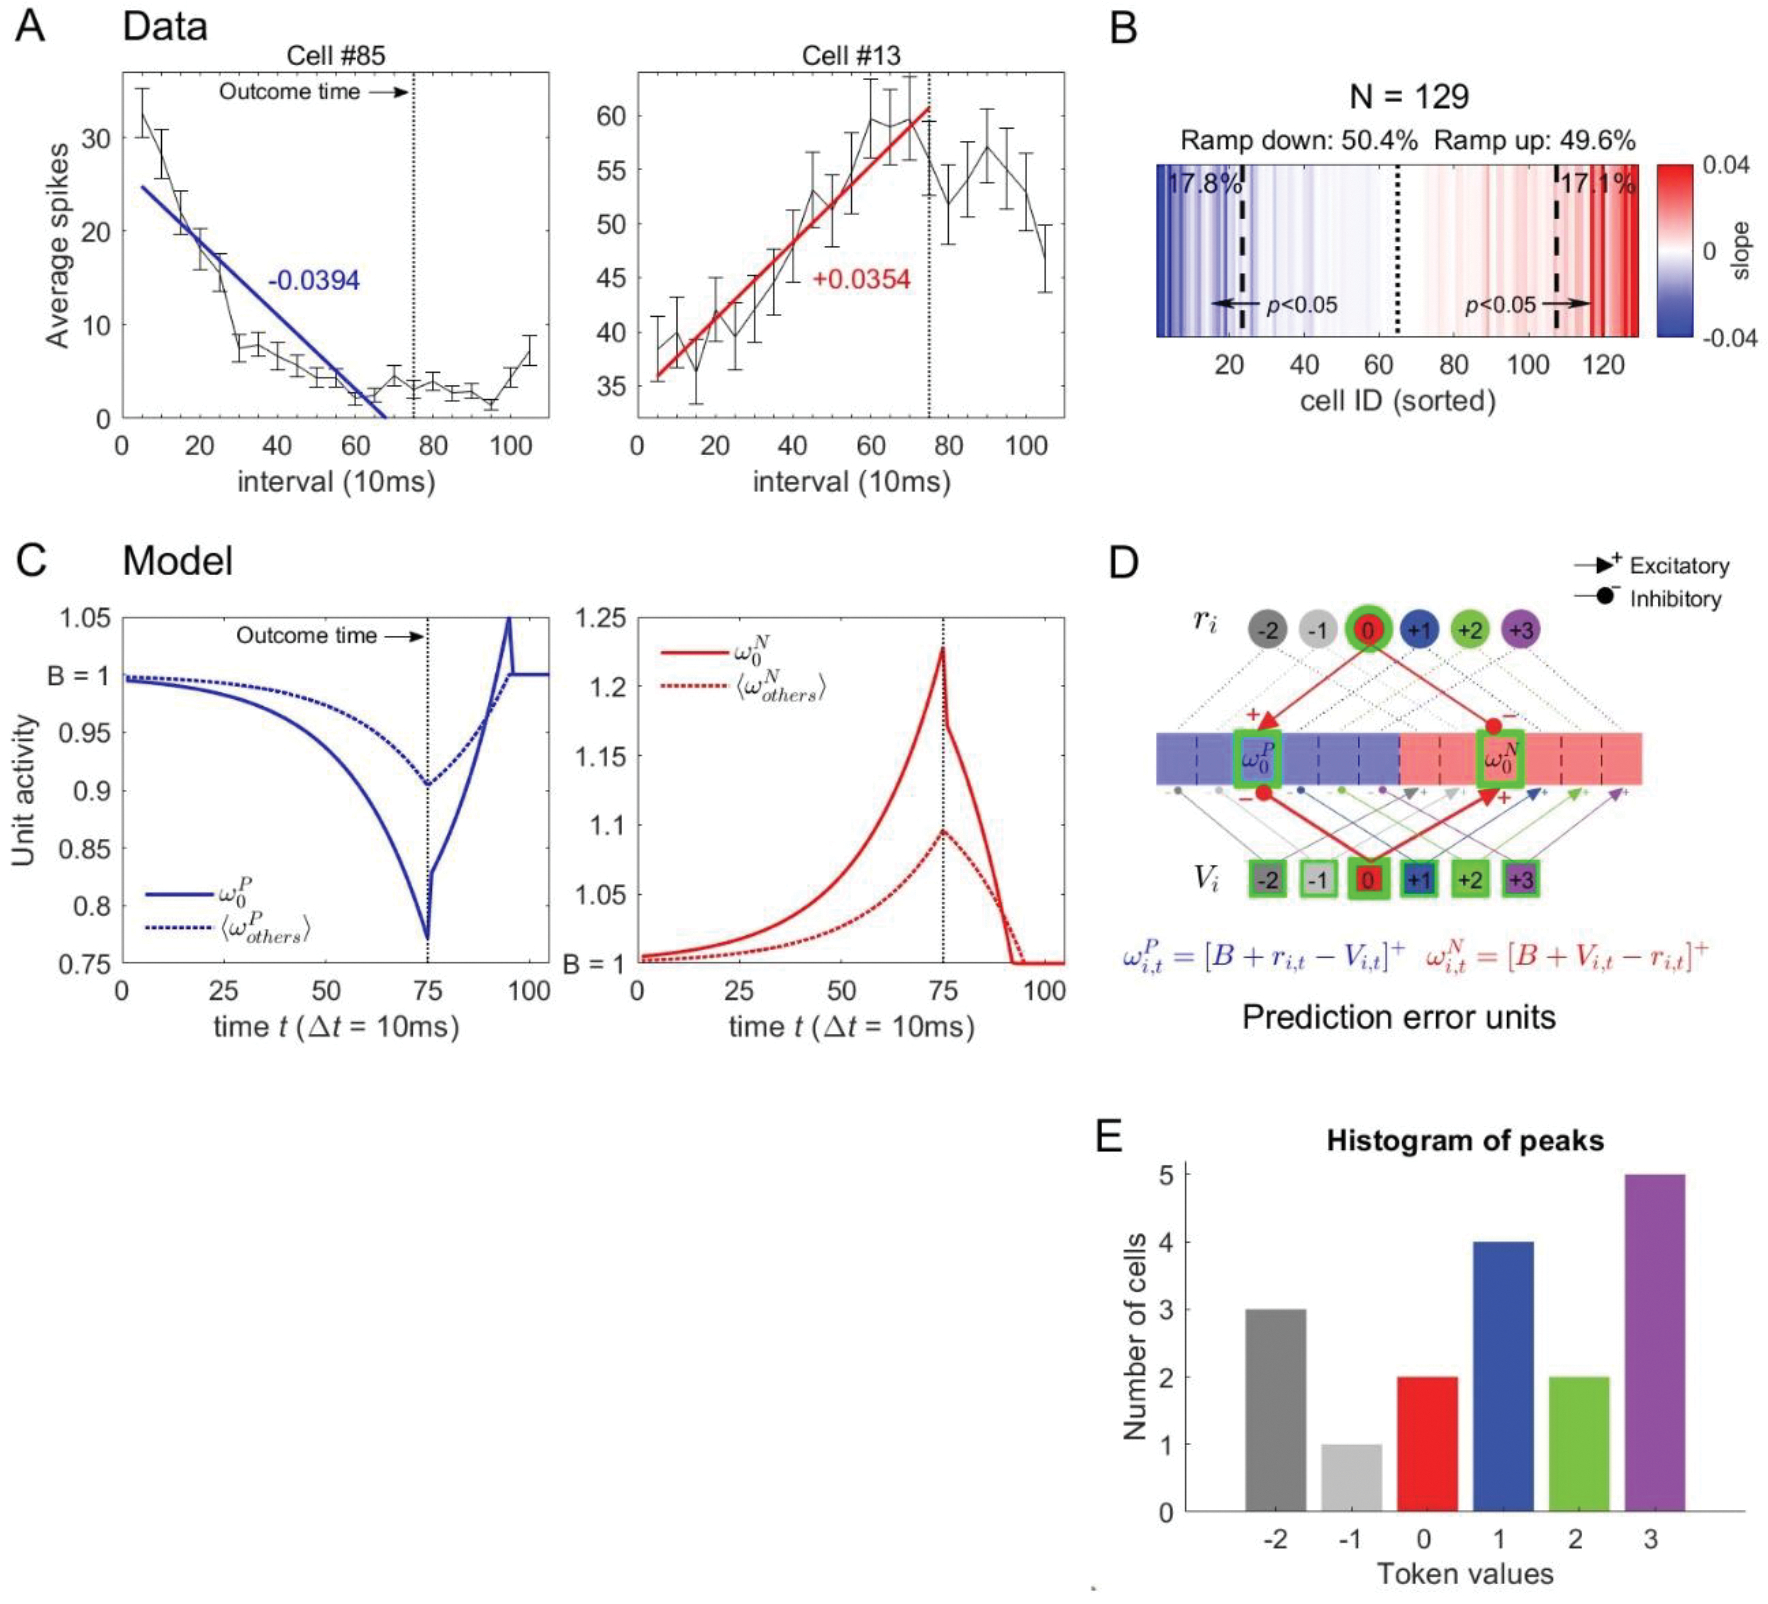
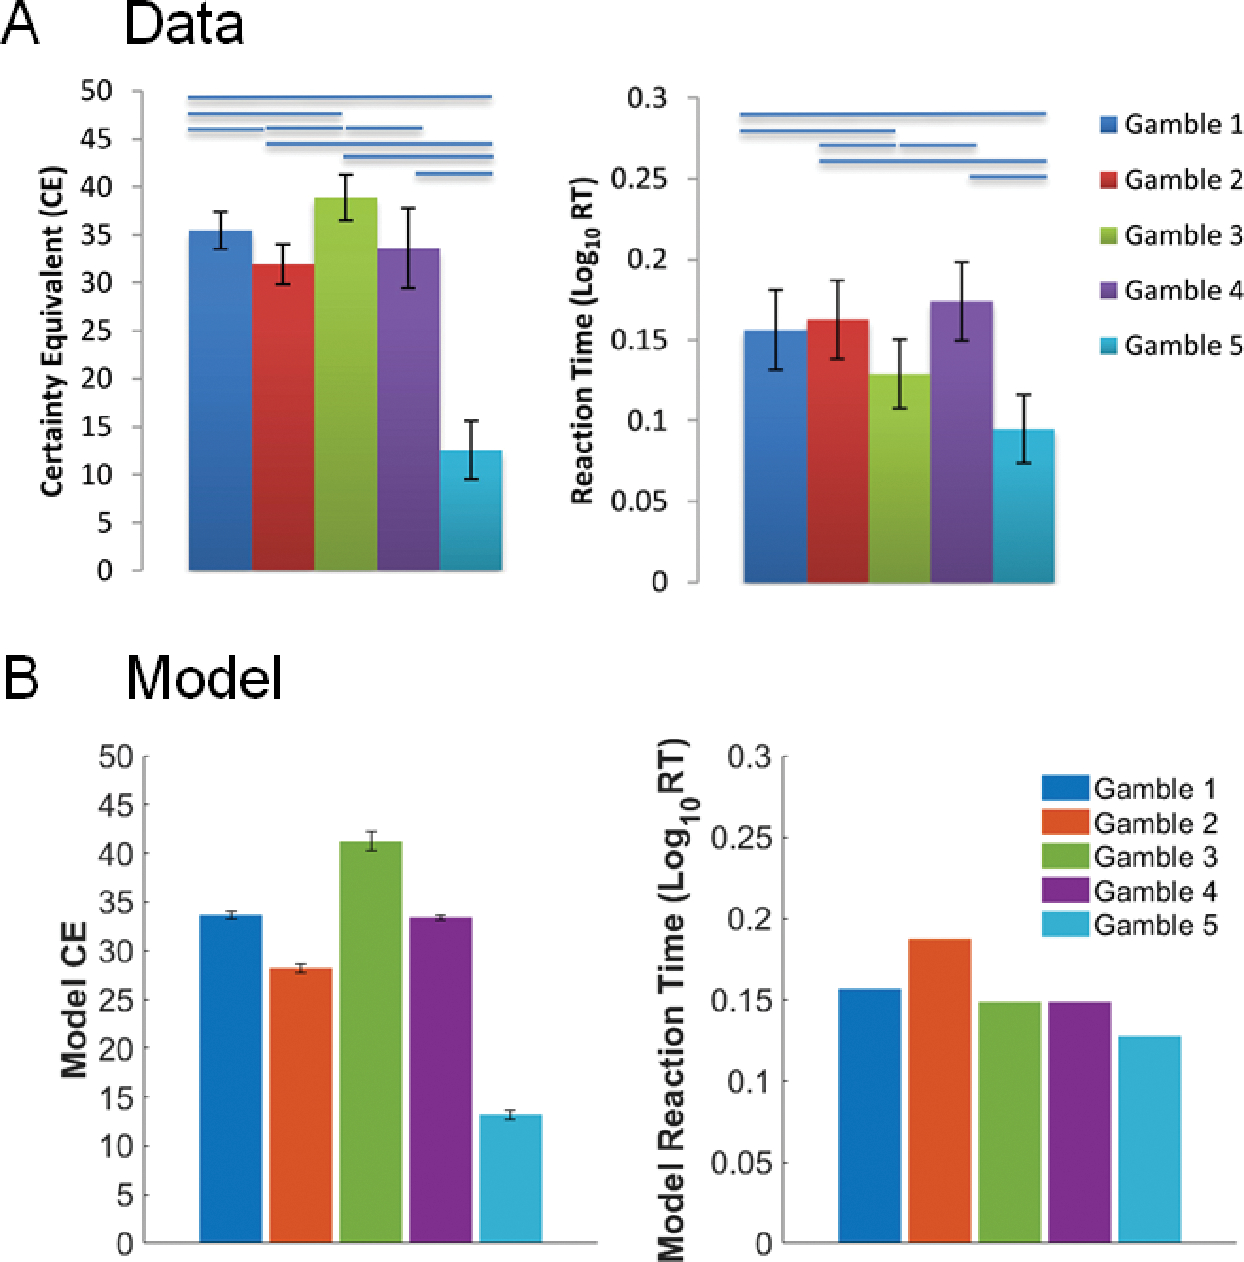
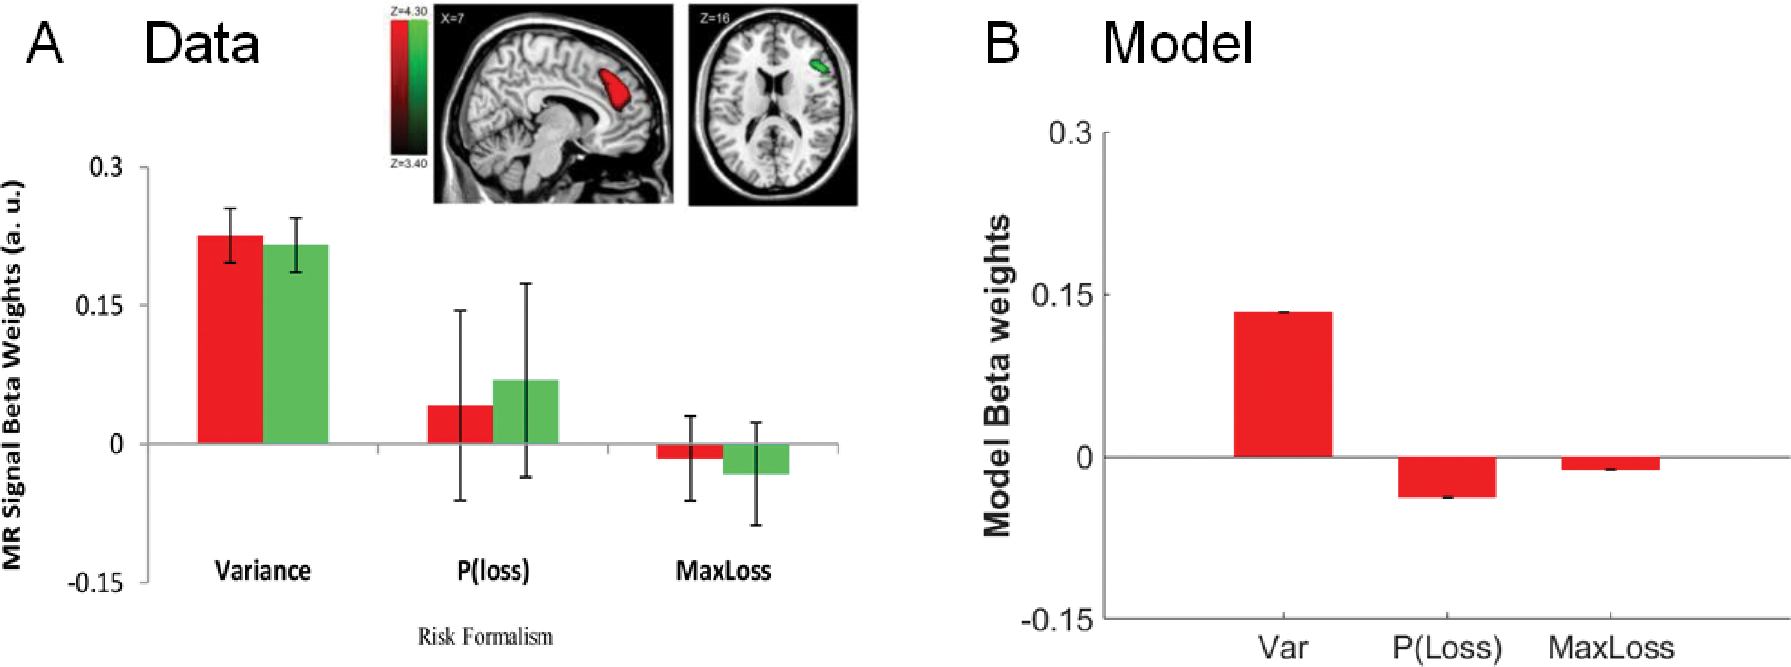
The anterior cingulate cortex (ACC) has been implicated in a number of functions, including performance monitoring and decision-making involving effort. The prediction of responses and outcomes (PRO) model has provided a unified account of much human and monkey ACC data involving anatomy, neurophysiology, EEG, fMRI, and behavior. We explored the computational nature of ACC with the PRO model, extending it to account specifically for both human and macaque monkey decision-making under risk, including both behavioral and neural data. We show that the PRO model can account for a number of additional effects related to outcome prediction, decision-making under risk, gambling behavior. In particular, we show that the ACC represents the variance of uncertain outcomes, suggesting a link between ACC function and mean-variance theories of decision making. The PRO model provides a unified account of a large set of data regarding the ACC.

Keywords: Computational model; Control; Decision-making; Prefrontal cortex.


Figures

Figure 1A.
Figure 1A.. Overview of the PRO-control model.
The model (Brown & Alexander, 2017) builds on the previous PRO model by specifying two distinct processes within mPFC, namely the proactive control (blue) prior to decision and the reactive control (red) after a decision. The proactive control signal facilitates a desired response based on pre-decision prediction, while the reactive control signal inhibits an undesired response based on prediction error.
Figure 1B.
Figure 1B.. Experiment 1 task: Monkey gambling task structure to test mechanisms of post-choice outcome prediction.
Monkeys were presented with each option sequentially (in a randomized order) and were made to make a choice by fixating their gaze on the desired option. The red box indicates our interval of interest: 750ms delay period right after the choice has been made, followed by 300ms of reward feedback period. (Figure adapted with permission from Azab & Hayden (2016).)
Figure 1C.
Figure 1C.. Experiment 2 task: Human gambling task design to test mechanisms of pre-choice proactive control.
Each gamble is presented with its corresponding SureThing (ST) option specified by the linear control algorithm (see text for details). The red box indicates the pre-choice period during which a proactive control signal is generated. Middle row shows five gamble types, specifically designed to mutually decorrelate the formal properties of risk (variance of outcome, probability of loss, maximum possible loss). Each gamble is presented in each trial in a sequential order. Bottom row shows an example model input for Gamble 1 and SureThing options shown inside the red box. Each token value is represented by log-scaled discrete units (Nieder, 2002) (See Supplementary Materials).
Figure 2.
Figure 2.. Monkey choice behavior (red) and PRO model simulation (blue).
(A) Empirical choice behavior in red based on expected value difference between two options, fit to a sigmoid function. Subjects chose the left option more often as its expected value increased relative to the right option. Model simulation in blue. (B) Empirical choice behavior in red based on variance difference between two options, fit to a linear function. Subjects chose the left option more often as its variance increased relative to the right option, suggesting that the subjects were risk-seeking. Model simulation in blue.
Figure 3.
Figure 3.. Monkey single-unit neurophysiology and the PRO model simulation of the cell behavior.
(A) Example activities of dACC cells during the anticipatory period. The vertical dotted line represents the time in which the outcome is revealed. (B) The population of the cell types is represented by the heat map indicating the slope of the spiking rate (red for positive, blue for negative), showing a fairly even split between upward and downward ramping cells. (C) Example model prediction error unit activities during the anticipatory period, after which token ‘0’ is revealed. (D) Overview of the prediction error units of the PRO model. Here, the structure of the model requires the same number of positive and negative surprise units, corresponding to each possible response-outcome conjunction. (E) Histogram of the numerical receptive field peaks among monkey dACC cells, showing a range of numerical receptive fields as posited in the model.
Figures 4.
Figures 4.. Percentage of significantly correlated cells to each trial statistics.
(A) Monkey neurophysiology. The red dotted line indicates the threshold for significance correlation in the Fisher’s exact test. Four trial statistics—EV, maxWin, variance, and entropy—were shown to be significantly correlated with prediction cell activity (p = 0.05). Blue stack indicates positively correlated cells, red stack negatively correlated. (B) Results from the model prediction error units (ωP and ωN). The units show approximately the same pattern seen in the monkey data, with the strongest correlations among EV, maxWin, and variance.
Figures 5.
Figures 5.. Homology between monkey and human dACC.
(A) Monkey recording sites for Experiment 1. dACC, dorsal anterior cingulate cortex. Figure adapted with permission from Azab & Hayden (2017) (B) Prediction Error related to pain processing task (PEpain, red) and cognitive control task (PEcog, green), and their overlap (yellow). The PEcog effect shows regions that were more active when a more difficult incongruent task was unexpectedly present or absent. Likewise, the PEpain contrast shows regions that were more active when mild electrical shock pain to the middle and index fingers was greater or less than expected. For task details, see Jahn et al. (2016). Depicted at voxelwise threshold of p < 0.01 uncorrected, p < 0.05 cluster-corrected. Figure adapted with permission from Jahn et al. (2016). Note that both sites are from the region dorsal to the cingulate sulcus.
Figure 6.
Figure 6.. Empirical and model Certainty Equivalence (CE) and reaction times (RT).
(A) Human behavioral data (N = 25). Left: Average Certainty Equivalence (CE) values for each gamble. Right: Average Reaction Times (RT) for each gamble. The fifth gamble, which has the largest variance, had both the lowest CE and RT. (B) Model results. Parameters were fitted to the average CE values only. Panel A adapted with permission from Fukunaga et al. (2018). Horizontal bars above panel A bars represent significant pairwise differences.
Figure 7.
Figure 7.. Significant loading during choice period.
Risk formalism regressor during choice. (A) Human neural data. Top left (red) indicates ACC region defined by significant loading on variance regressor (Var). Top right (green) indicates IFG/AI also loading on the variance regressor. Other regressors were not significant. The ACC and IFG/AI regions of interest were defined with a separate data set (Fukunaga et al., 2012). The vertical bar chart reflects the ROIs shown, not just the peak voxel. The inset shows the respective brain regions defined by significant loading on Variance regressor (voxel-wise min Z = 3.40, max Z = 4.30). (B) Simulation results also showed significant loading to variance only. Panel A adapted with permission from Fukunaga et al (2018).

Similar articles

Cited by

References

    1. Alexander WH, & Brown JW (2011). Medial prefrontal cortex as an action-outcome predictor. Nature Neuroscience, 14(10). 10.1038/nn.2921 - DOI - PMC - PubMed
    1. Alexander WH, & Brown JW (2014). A general role for medial prefrontal cortex in event prediction. Frontiers in Computational Neuroscience, 8. 10.3389/fncom.2014.00069 - DOI - PMC - PubMed
    1. Alexander WH, & Brown JW (2015). Reward salience and risk aversion underlie differential ACC activity in substance dependence. NeuroImage: Clinical 8:59–71. - PMC - PubMed
    1. Alexander WH, & Brown JW (2019). The Role of the Anterior Cingulate Cortex in Prediction Error and Signaling Surprise. Topics in Cognitive Science, 11(1). 10.1111/tops.12307 - DOI - PubMed
    1. Amador N, Schlag-Rey M, & Schlag J (2000). Reward-Predicting and Reward-Detecting Neuronal Activity in the Primate Supplementary Eye Field. Journal of Neurophysiology, 84(4). 10.1152/jn.2000.84.4.2166 - DOI - PubMed

Publication types

MeSH terms