. 2022 May;82(4):288-307.
doi: 10.1002/dneu.22873. Epub 2022 Apr 22.

Re-evaluating the actin-dependence of spectraplakin functions during axon growth and maintenance

Affiliations

Re-evaluating the actin-dependence of spectraplakin functions during axon growth and maintenance

Yue Qu et al. Dev Neurobiol. 2022 May.

Abstract

Axons are the long and slender processes of neurons constituting the biological cables that wire the nervous system. The growth and maintenance of axons require loose microtubule bundles that extend through their entire length. Understanding microtubule regulation is therefore an essential aspect of axon biology. Key regulators of neuronal microtubules are the spectraplakins, a well-conserved family of cytoskeletal cross-linkers that underlie neuropathies in mouse and humans. Spectraplakin deficiency in mouse or Drosophila causes severe decay of microtubule bundles and reduced axon growth. The underlying mechanisms are best understood for Drosophila's spectraplakin Short stop (Shot) and believed to involve cytoskeletal cross-linkage: Shot's binding to microtubules and Eb1 via its C-terminus has been thoroughly investigated, whereas its F-actin interaction via N-terminal calponin homology (CH) domains is little understood. Here, we have gained new understanding by showing that the F-actin interaction must be finely balanced: altering the properties of F-actin networks or deleting/exchanging Shot's CH domains induces changes in Shot function-with a Lifeact-containing Shot variant causing remarkable remodeling of neuronal microtubules. In addition to actin-microtubule (MT) cross-linkage, we find strong indications that Shot executes redundant MT bundle-promoting roles that are F-actin-independent. We argue that these likely involve the neuronal Shot-PH isoform, which is characterized by a large, unexplored central plakin repeat region (PRR) similarly existing also in mammalian spectraplakins.

Keywords: Drosophila; actin; axons; microtubules; neurons.


Conflict of interest statement

The authors declare no conflict of interest.

Figures

FIGURE 1
FIGURE 1
Different Shot constructs and their localization. (a) Illustration of different Shot isoforms as a function of different start sites (A*–D*) and splice‐in of different exons (X, PRR); different domains and motifs are color‐coded (CH, calponin homology; PD, plakin domain; PRR, plakin repeat region; SRR, spectrin repeat region; EFH, EF‐hand; GRD, Gas2‐related domain; MtLS, MT tip localization sequence which forms the Eb1‐binding motifs); positions of the epitope used to generate the Shot‐C antibody (Strumpf & Volk, 1998), the kakP2 P‐element insertion (blocking the a* and b* start sites) and the break‐point of the V104 inversion (deleting the Ctail) are indicated in red. (b–j) Different UAS‐constructs expressing modified Shot versions, color‐coded as in (A) and GFP indicated by a yellow star; newly generated constructs are indicated by asterisks, origins of all other constructs are provided in the Methods section. (b’–j’) Primary neurons at 6–8 h in vitro (HIV) cultured on glass which express the respective constructs on the left and are stained for actin (red), tubulin (green), and GFP (blue); wild‐type reference neurons are not shown but can take on any of the shapes displayed in B’‐J’ (see examples in Figures 2a, 4b, 6a, 8a, 8g, and Figure S1a). (b″–j″) GFP channel are shown in grayscale. In all images, asterisks indicate cell bodies, arrow heads the axon tips; scale bar in (A) represents 10 μm in all images. (k and l) Graphs display the distribution of axon length phenotypes (K) and frequency of spools in neuronal growth cones (GCs) (L) taken from neuron populations expressing the same constructs as displayed in b″–j″. Number of neurons analyzed are shown in orange, median values in blue (k only), black numbers within columns in (L) indicate the percentage of neurons with spool‐containing GCs; black/gray numbers on the right of each plot/bar indicate the p‐values obtained via Mann–Whitney rank sum tests in (K) (Kruskall–Wallis analysis of variance [ANOVA] test results shown above) and chi‐square tests in (l). Data were normalized to wild‐type controls performed in parallel to all experiments (red dashed lines)
FIGURE 2
FIGURE 2
Impact of drug‐induced F‐actin inhibition on Shot‐PE function. (a–c) Primary neurons at 6–8 h in vitro (HIV) on glass treated with DMSO (control), LatA or CK666 as indicated and stained for GFP (green), tubulin (red), and actin (blue); grayscale images below show single channels as indicated; asterisks indicate cell bodies, arrowheads the tips of axons; scale bar in (a) represents 10 μm in all images. (d) Frequency of neurons with growth cones (GCs) that contain spools (examples of neurons in a–c are assigned to their respective data columns via color‐coded squares); orange numbers indicate the sample numbers (number of neurons analyzed), white numbers within columns the percentage of neurons with GCs that contain no spools; numbers on the right of each graph indicate the p‐values obtained via chi‐squared tests. Data were normalized to wild‐type controls performed in parallel to all experiments (dashed red line)
FIGURE 3
FIGURE 3
Characteristic phenotypes induced by Shot‐PE‐Life::GFP expression. (a–d) Primary neurons at 6–8 h in vitro (HIV) on glass with scabrous‐Gal4‐induced expression of Shot‐PE‐Life::GFP, stained for tubulin (green), actin (red), and GFP (blue); boxed areas are shown as twofold magnified single channel grayscale images on the right, as indicated. (e and f) Shot‐PE‐Life::GFP‐expressing neurons treated with vehicle (e) or latrunculin A (LatA; f), stained for the same markers as above but color‐coded differently (as indicated); grayscale images below show single channels. Asterisks in (a–f) indicate cell bodies, arrowheads tips of axons, chevrons in (e and f) indicate areas of high GFP concentration, and the scale bar in (a) represents 10 μm in all RGB images of (a–d), 5 μm in grayscale images of (a–d), and 20 μm in (e). (g) Percentage of Shot‐PE‐Life::GFP‐expressing neurons showing spools (black) when treated with vehicle or LatA; number of analyzed neurons in orange, percentage shown in bars, the chi‐squared test result on the right
FIGURE 4
FIGURE 4
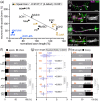
Microtubule (MT) loops correlate with axon lengths, but Shot has additional axon shaft phenotypes. (a) Spearman correlation analysis comparing axon length and spool frequency. Black dots represent data from Figure 1k plotted against data from Figure 1l, and orange/blue dots match data from (f) and (g); significant negative correlation (r‐ and p‐values) for orange and black dots are shown in box at top. (b–e) Primary neurons at 6–8 h in vitro (HIV) on glass which are either wild‐type (b), shot3/3 (c), chic221/221 (d) or shot3/3 chic221/221 (e), stained for tubulin (magenta) and actin (green); asterisks indicate cell bodies, arrowheads tips of axons, curved arrows areas of MT curling, and white/open arrows normal/short filopodia (see quantifications in Figure S5); yellow‐boxed areas presented as twofold magnified insets showing the tubulin channel in grayscale; the scale bar in (b) represents 10 μm in all RGB images and 5 μm in insets. (f–h) Quantification of neurons displaying MT spools in growth cones (GCs; f), of axon lengths (g), and of neurons displaying MT curling in axonal shafts (h); numbers of analyzed neurons are indicated in orange; median values in blue (g), percentages as white numbers within columns (f and h); p‐values obtained via Mann–Whitney rank sum tests (g) or chi‐squared tests (f and h) are shown in black/gray above bars or plotted data; all data were normalized to wild‐type controls performed in parallel to all experiments (dashed red lines)
FIGURE 5
FIGURE 5
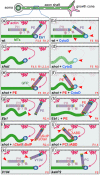
Schematic overview of existing experiments addressing Shot roles in microtubule (MT) bundle organization. (a) Schematic section of the axonal surface including cortical actin (magenta) anchoring the Shot N‐terminus of CH1‐containing isoforms (here PE) and promotes MT polymerization (dashed magenta arrow; Qu et al., 2017); via its C‐terminus, Shot‐PE binds EB1 (dark blue) and MTs (green) thus cross‐linking polymerizing MT tips to the cortex and guiding their extension into parallel bundles (Alves‐Silva et al., 2021); the plakin repeat region (PRR)‐containing PH isoforms (shown in pale) does not bind F‐actin but we propose that it contributes to MT bundle formation/maintenance through yet unknown mechanisms (‘‘?’’; see Discussion). (b–l) Different experimental conditions and their impact on MT behaviors; red numbers at bottom right indicate the information source: ‘‘F’’ refers to figure numbers in this publication, ‘‘R’’ indicates external references: (R1) (Sánchez‐Soriano et al., 2009), (R2) (Alves‐Silva et al., 2012), (R3) (Qu et al., 2017), (R4) (Hahn et al., 2021); red arrow heads point at specific functional lesions in the different conditions. Explanations: in wild‐type neurons, CytoD eliminates cortical actin and weakens MT polymerization (pale Eb1 with dashed outline), not strong enough to affect parallel MT arrangements but leading to MT gaps (interrupted green line; b); in the absence of Shot, MTs curl (c) and MT networks shrink (they become vulnerable to lack of actin‐promoting effects causing more severe loss of MTs; stippled green line; d); guiding function is fully re‐instated by targeted expression of Shot‐PE (e; expression constructs red encircled with a green GFP dot at their ends); Shot‐PE fails to guide MTs in the absence of actin, but it protects MT polymerization (f); Eb1 deficiency eliminates the F‐actin/MT/Eb1 guidance mechanism, and might even be involved in the alternative mechanism of Shot (arrow of pale PH toward MT plus end; g; see Discussion); MT curling upon reduced Eb1 levels (Eb1↓) can be rescued with Shot‐PE expression (h); MT curling caused by loss of Shot (or Eb1; see Ref. 4) cannot be rescued with Shot‐PE variants that lack Ctail or Eb1‐binding SxIP motifs (i; see Figure 7c) or the CH1 domain (j); absence of the same domains in shotV104 (k) or shotkakP2 (l) does not cause MT curling. We propose that the presence of the Shot‐PH isoform (faintly shown in a, b, k, and l) protects axons against loss of actin or F‐actin/MT/Eb1 guidance mechanism, that is, conditions which cause severe curling in the other experimental settings (c, f, g, i, and j)
FIGURE 6
FIGURE 6
Cytochalasin D (CytoD) experiments confirming the F‐actin‐dependent guidance mechanism of Shot. Left side: Primary neurons of different genotypes (as indicated: wt, wild‐type; shot, shot3/3 ; shot + PE, shot3/3 expressing Shot‐PE) at 6–8 h in vitro (HIV) on ConA, treated with vehicle (DMSO) or CytoD as indicated, and stained for tubulin (green), actin (red), or GFP (blue); asterisks indicate cell bodies, arrowheads the tip of axons, white dashed lines demarcate the axon shaft, open arrows gaps in axonal tubulin bundles, and white/open curved arrows areas of normal/fractured microtubule (MT) curling; scale bar in (b) represents 10 μm in all images. Right side: Quantification of the degree of MT curling in the axon shafts (between white dashed lines or dashed line and arrowhead in images on the left) of each genotype, measured in MT disorganization index (MDI) and normalized to wildtype controls (red dashed line); numbers of neurons analyzed are indicated in orange, mean ± SEM in blue and results of Mann–Whitney rank sum tests are shown in black/gray. Further explanations are given in Figure 5
FIGURE 7
FIGURE 7
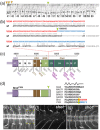
The shotV104 breakpoint removes the Ctail. (a) View of the 2R polytene chromosome (Lindsley & Zimm, 1992) indicating the mapped breakpoint in 50C (orange arrow) and potential sites of the second breakpoint in the centromeric region of 2R (orange arrowheads) suggested by the mapping positions of several clones with matching sequences (when using the BLAST function in flybase.org and the blue sequence in (b) as query); clones with matching sequences: DS03708 (42A4‐42A5), BACR04E10 (41C‐41D), BACR07J16 (41C‐41C), BACR05A24 (41C‐41D), BACR05A24 (41C‐41D), and BACR03D04 (40D‐40D). (b) Alignment of the wild‐type and V104 mutant genomic sequences of shot indicating the breakpoint (yellow arrow) in position 13,868,412 (primary assembly 2R: 13,864,237‐13,925,503 reverse strand) and the newly fused sequence in shotV104 (blue) likely derived from the other end of the inversion that would usually be situated near the position of the second breakpoint (orange arrows in a). (c) Schematic of the Shot‐PE protein (FBtr0087618) drawn to scale and indicating domain/motif borders (colored numbers below; compare Figure 1a) as well as exon borders (stippled vertical lines, gray numbers, exon numbers indicated between lines); the V104 breakpoint is situated in intron 22/23. (d) The predicted V104 protein is truncated behind the GRD (yellow arrow) potentially reading into intronic sequences (gray). Comparison of the V104 sequence at the breakpoint (highlighted yellow) with sequences of GRDs from normal Shot and other GRD‐containing proteins (listed in gray; taken from Alves‐Silva et al., 2012) strongly suggest that the truncation does not affect the final α‐helix and amino acid changes occur behind the GRD. (e–g) Ventral nerve cords of stage 16 embryos (cx, cortex containing cell bodies; np, neuropile containing synapses and as‐/descending tracts; dashed yellow lines demarcate outlines of the ventral nerve cord; t, trachea) stained with the Shot‐C antibody against the C‐terminal part of the spectrin repeat rod (Figure 1a; Strumpf & Volk, 1998); staining reveals the presence of protein in wild‐type (e), absence in homozygous shot null mutant embryos (f) and presence in hemizygous shotV104/MK1 mutant embryos where reduced expression is due to the absence of one gene copy (V104 is over the MK1 deficiency); scale bar in E represents 20 μm in (E–G)
FIGURE 8
FIGURE 8
Phenotypes of shotkakP2 and shotV104 mutant primary neurons. (a–d, g, h) Images of neurons at 6–8 h in vitro (HIV) of different genotypes (wt, wild‐type; 3, shot3/3 ; kakP2, shotkakP2/kakP2 ; V104, shotV104/Df(MK1) ) cultured on glass (a–d) or ConA (g and h) and stained for tubulin (green), actin (magenta) or GFP (blue); grayscale images on the right show only the tubulin channel; asterisks indicate cell bodies, arrowheads the tips of axons, dashed white lines demarcate axon shafts, curved arrows areas of MT curling; scale bar in (a) represents 20 μm in (a–d) and 10 μm in (g) and (h). (e, f, i, and j) Quantifications of axon length (e and i) and microtubule (MT) curling (measured in MT disorganization index [MDI]; f and j), both normalized to wild‐type controls (red dashed line); numbers of neurons analyzed are indicated in orange, mean ± SEM in blue and results of Mann–Whitney rank sum tests are shown in black/gray

Similar articles

Cited by

References

    1. Alves‐Silva, J. , Hahn, I. , Huber, O. , Mende, M. , Reissaus, A. , & Prokop, A. (2008). Prominent actin fibre arrays in Drosophila tendon cells represent architectural elements different from stress fibres. Molecular Biology of the Cell, 19, 4287–4297. 10.1091/mbc.e08-02-0182 - DOI - PMC - PubMed
    1. Alves‐Silva, J. , Sánchez‐Soriano, N. , Beaven, R. , Klein, M. , Parkin, J. , Millard, T. , Bellen, H. , Venken, K. J. T. , Ballestrem, C. , Kammerer, R. A. , & Prokop, A. (2012). Spectraplakins promote microtubule‐mediated axonal growth by functioning as structural microtubule‐associated proteins and EB1‐dependent +TIPs (Tip Interacting Proteins). Journal of Neuroscience, 32, 9143–9158. 10.1523/JNEUROSCI.0416-12.2012 - DOI - PMC - PubMed
    1. Amieva, M. R. , & Furthmayr, H. (1995). Subcellular localization of moesin in dynamic filopodia, retraction fibers, and other structures involved in substrate exploration, attachment, and cell‐cell contacts. Experimental Cell Research, 219, 180–196. 10.1006/excr.1995.1218 - DOI - PubMed
    1. Aumailley, M. , Has, C. , Tunggal, L. , & Bruckner‐Tuderman, L. (2006). Molecular basis of inherited skin‐blistering disorders, and therapeutic implications. Expert Reviews in Molecular Medicine, 8, 1–21. 10.1017/s1462399406000123 - DOI - PubMed
    1. Bischof, J. , Maeda, R. K. , Hediger, M. , Karch, F. , & Basler, K. (2007). An optimized transgenesis system for Drosophila using germ‐line‐specific varphiC31 integrases. PNAS, 104, 3312–3317. 10.1073/pnas.0611511104 - DOI - PMC - PubMed

Publication types

LinkOut - more resources