A DNA Biosensor Based on a Raspberry-like Hierarchical Nano-structure for the Determination of the Anticancer Drug Nilotinib
- PMID: 35333006
- PMCID: PMC8950773
- DOI: 10.1002/open.202100261
A DNA Biosensor Based on a Raspberry-like Hierarchical Nano-structure for the Determination of the Anticancer Drug Nilotinib
Abstract
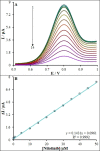
It is crucial to design fast, sensitive and affordable deoxyribonucleic acid (DNA) recognition instruments, and elucidate changes in DNA structure, for studying the interaction between DNA and chemotherapy drugs. Therefore, a DNA biosensor, based on a carbon paste electrode (CPE), modified with raspberry-like indium(III)/nickel oxide hierarchical nano-structures (In3+ /NiO RLHNSs) was constructed. An electrochemical readout should then give information on the interactions between anticancer drugs and double-stranded (ds)-DNA. The morphology as well as the electrochemical description of this new biosensor is described. Based on experimentally determined optimal conditions, ds-DNA modified with In3+ /NiO RLHNSs/CPE was used to evaluate the binding interaction of nilotinib, as an anti-cancer drug, with DNA through differential pulse voltammetry (DPV), UV-Vis spectroscopy, viscosity measurements and a computational docking process. The analyses indicated the linearity of the guanine oxidation signal at nilotinib concentration is given between 0.01 and 50.0 μm, with the limit of detection (LOD) equal to 0.62 nm. Additionally, the equilibrium constant (K) for the binding was determined to 1.5×10⁴ m-1 . Through the quantitative measurement of nilotinib in serum samples with a high recovery rate of 101.3-98.0 %, the applicability of this approach was demonstrated. As a whole, this DNA biosensor may be promising for various bio-interactions.
Keywords: carbon paste electrode; hierarchical nanostructure; indium; nilotinib; sensor.
© 2022 The Authors. Published by Wiley-VCH GmbH.
Conflict of interest statement
The authors declare that they have no known competing financial interests or personal relationships that could have appeared to influence the work reported in this paper.
Figures


References
-
- Miguel C., Leif S., Anders F. C., Magnus B., JACC: CardioOncology 2020, 2, 123–126. - PubMed
-
- Goda A. E., Elisisi A. E., Noha S. S., Abdelrazik M., Toxicol. Appl. Pharmacol. 2020, 404, 115185. - PubMed
-
- Davies A., Hayes A. K., Knight K., Watmough S. J., Pirmohamed M., Clark R. E., Leuk. Res. 2010, 34, 702–707. - PubMed
-
- Bouchet S., Chauzit E., Ducint D., Castaing N., Canal Raffin M., Moore N., Titier K., Molimard M., Clin. Chim. Acta 2011, 412, 1060. - PubMed
MeSH terms
Substances
LinkOut - more resources
Full Text Sources
Research Materials
Miscellaneous

