Review
. 2022 Apr;15(4):e010435.
doi: 10.1161/CIRCEP.121.010435. Epub 2022 Mar 25.

P Wave Parameters and Indices: A Critical Appraisal of Clinical Utility, Challenges, and Future Research-A Consensus Document Endorsed by the International Society of Electrocardiology and the International Society for Holter and Noninvasive Electrocardiology

Affiliations
Review

P Wave Parameters and Indices: A Critical Appraisal of Clinical Utility, Challenges, and Future Research-A Consensus Document Endorsed by the International Society of Electrocardiology and the International Society for Holter and Noninvasive Electrocardiology

Lin Yee Chen et al. Circ Arrhythm Electrophysiol. 2022 Apr.

Abstract

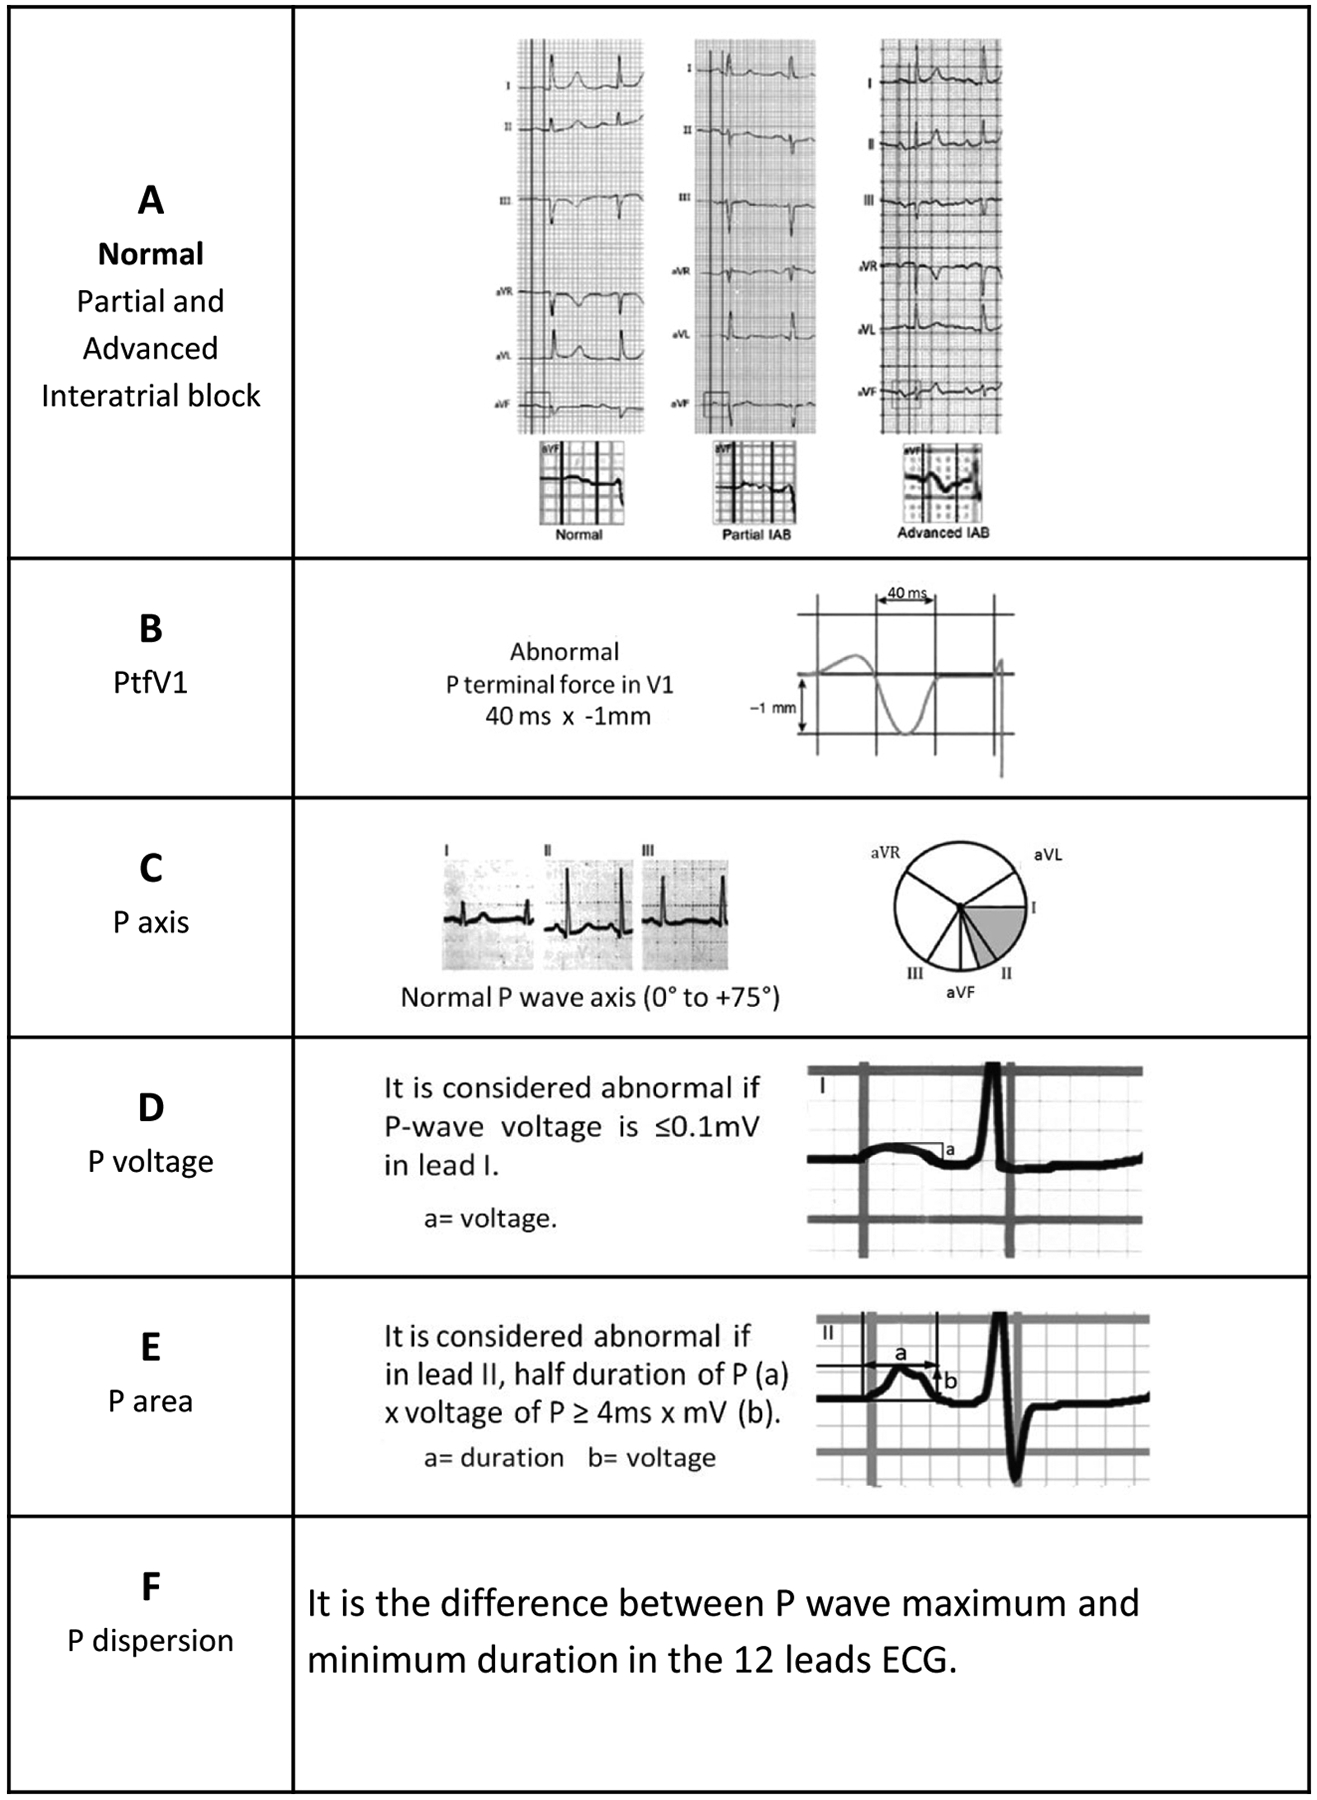
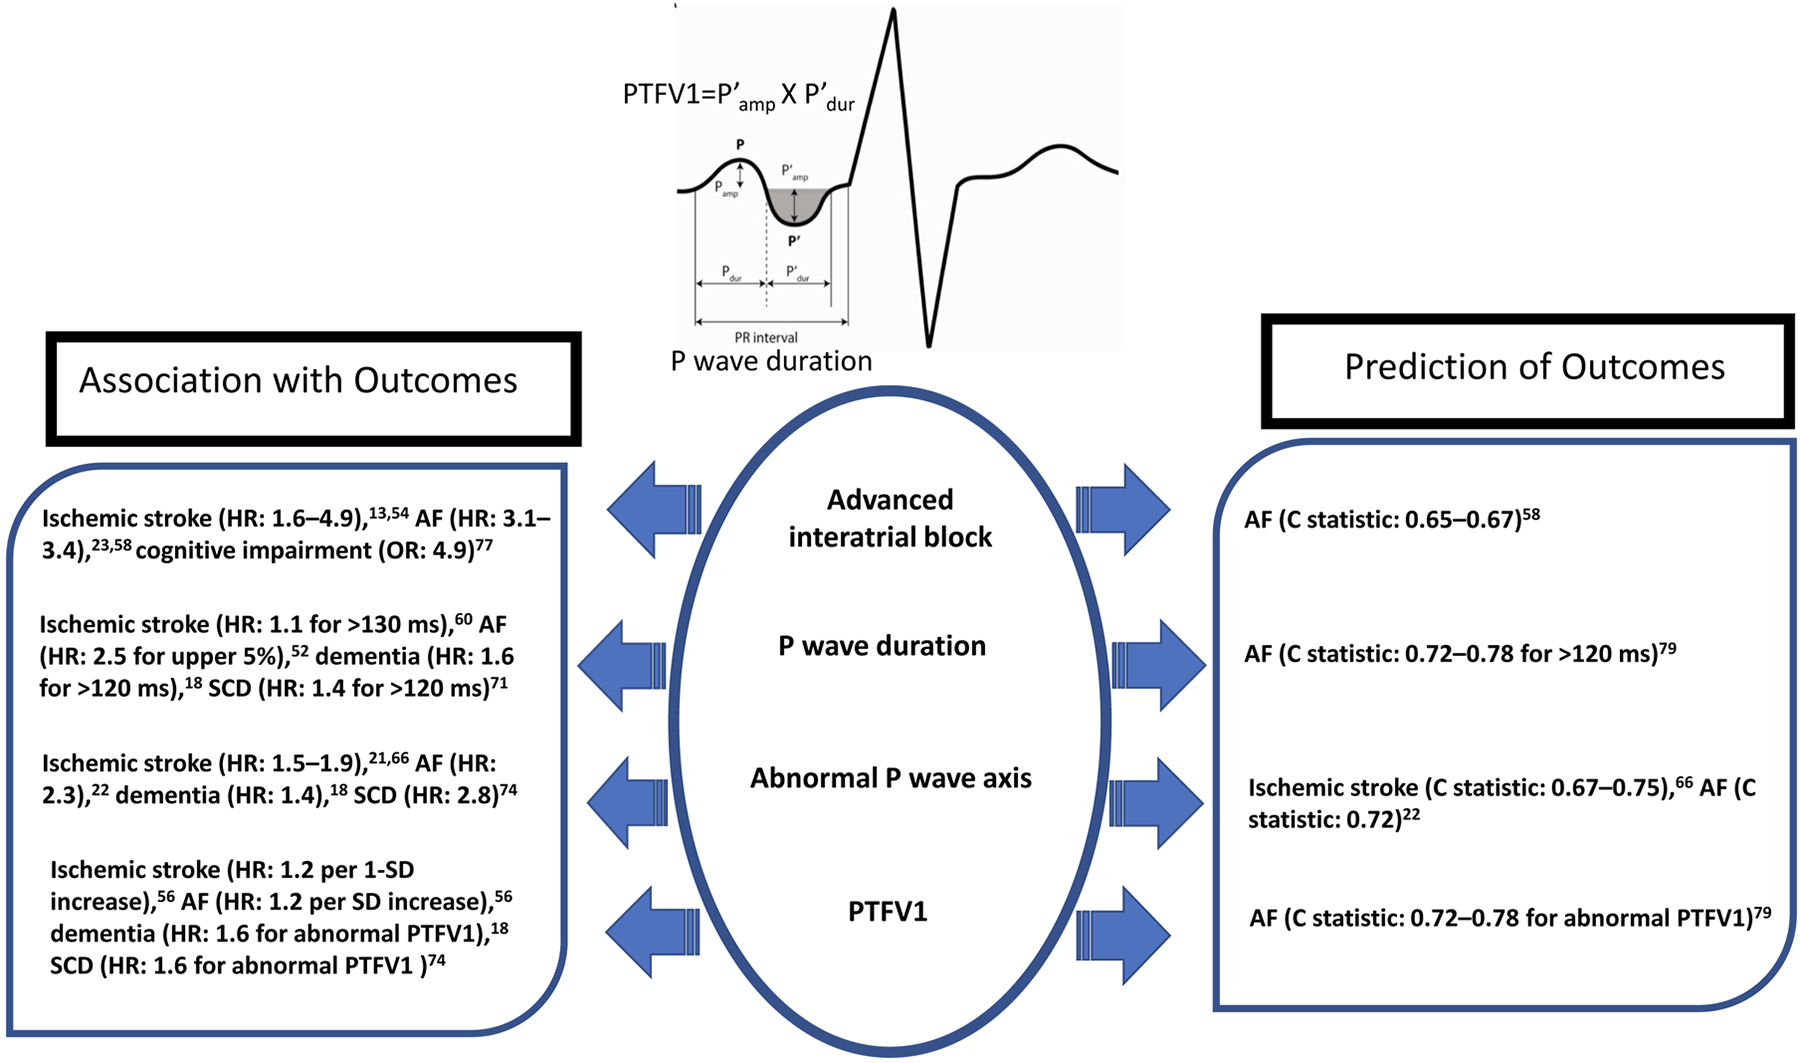
Atrial cardiomyopathy, characterized by abnormalities in atrial structure and function, is associated with increased risk of adverse cardiovascular and neurocognitive outcomes, independent of atrial fibrillation. There exists a critical unmet need for a clinical tool that is cost-effective, easy to use, and that can diagnose atrial cardiomyopathy. P wave parameters (PWPs) reflect underlying atrial structure, size, and electrical activation; alterations in these factors manifest as abnormalities in PWPs that can be readily ascertained from a standard 12-lead ECG and potentially be used to aid clinical decision-making. PWPs include P wave duration, interatrial block, P wave terminal force in V1, P wave axis, P wave voltage, P wave area, and P wave dispersion. PWPs can be combined to yield an index (P wave index), such as the morphology-voltage-P-wave duration ECG risk score. Abnormal PWPs have been shown in population-based cohort studies to be independently associated with higher risks of atrial fibrillation, ischemic stroke, sudden cardiac death, and dementia. Additionally, PWPs, either individually or in combination (as a P wave index), have been reported to enhance prediction of atrial fibrillation or ischemic stroke. To facilitate translation of PWPs to routine clinical practice, additional work is needed to standardize measurement of PWPs (eg, via semiautomated or automated measurement), confirm their reliability and predictive value, leverage novel approaches (eg, wavelet analysis of P waves and machine learning algorithms), and finally, define the risk-benefit ratio of specific interventions in high-risk individuals. Our ultimate goal is to repurpose the ubiquitous 12-lead ECG to advance the study, diagnosis, and treatment of atrial cardiomyopathy, thus overcoming critical challenges in prevention of cardiovascular disease and dementia.

Keywords: atrial fibrillation; cardiomyopathy; cardiovascular disease; interatrial block; ischemic stroke.


Figures

Figure 1:
Figure 1:
Measurement of different P wave parameters
Figure 2:
Figure 2:
Orthogonal P wave morphology. The main atrial depolarization vectors underlying the three P wave morphologies are presented in schematic illustrations of human atria in the top row (anterior view) and the second row (superior view). The three lowest rows present P waves from leads X, Y, and Z, with P wave onsets and ends marked by red lines. Atrial depolarization begins in the sinus node and the depolarization propagates anteriorly, downwards, and leftwards in the right atrium leading to a positive initial deflection in the P wave in leads X and Y, and a negative initial deflection in lead Z. Type 1 morphology (Column A) is associated with interatrial propagation of activation wavefront through posterior fibres near the fossa ovalis, leading to left atrial depolarization directed forward resulting a negative terminal portion in lead Z. Type 2 morphology (Column B) is associated with the interatrial conduction occurring exclusively through the anteriorly and superiorly located Bachmann’s bundle, which leads to inferiorly and posteriorly directed left atrial depolarization, resulting in a positive terminal portion of the P wave in lead Z. Type 3 morphology (Column C) results from left atrial breakthrough occurring near the coronary sinus, without involvement of the Bachmann’s bundle in the interatrial conduction, as in the case of advanced interatrial block, which results in the left atrial activation directed upwards leading to a negative terminal portion of the P wave in lead Y. Reprinted from reference .
Figure 3:
Figure 3:
Transverse section of heart showing propagation of sinus node depolarization impulses from the right atrium to the left atrium. The upper panel shows the normal situation whereby atrial impulses conduct from the right atrium to the left atrium both via the Bachmann’s bundle and posteriorly located myocardial connections. The left atrial depolarization vector projection on the lead V1 results in either isoelectric or positive polarity of the terminal P wave component. The lower panel shows interatrial conduction over the Bachmann’s bundle only with no or minimal contribution from the posterior connections with resultant anterior-posterior activation of the left atrium resulting in a negative component in the terminal portion of the P wave in V1. Reprinted from reference .
Figure 4:
Figure 4:
(A) This is V1 lead of a healthy patient with normal left atrial size by echocardiography. V1 electrode placed in normal location (4th ICS) (A), 3rd ICS (B), and in 2nd ICS (C). It is clear that the normal P wave in the 4th ICS becomes progressively more negative (B and C) as the electrode of V1 is placed in higher ICS. ICS, intercostal space
Figure 5:
Figure 5:
A graphical summary of the key findings from association and prediction studies that link P wave parameters to cardiovascular and dementia outcomes. Hazard ratios and odds ratio are multivariable adjusted. C statistic are based on addition of P wave parameters to conventional benchmarks. AF, atrial fibrillation; HR, hazard ratio; OR, odds ratio; PTFV1, P wave terminal force in V1; SCD, sudden cardiac death; SD, standard deviation

References

    1. Goette A, Kalman JM, Aguinaga L, Akar J, Cabrera JA, Chen SA, Chugh SS, Corradi D, D’Avila A, Dobrev D, et al. EHRA/HRS/APHRS/SOLAECE expert consensus on atrial cardiomyopathies: Definition, characterization, and clinical implication. Heart Rhythm. 2017;14:e3–e40. - PMC - PubMed
    1. Goldberger JJ, Arora R, Green D, Greenland P, Lee DC, Lloyd-Jones DM, Markl M, Ng J, Shah SJ. Evaluating the Atrial Myopathy Underlying Atrial Fibrillation Identifying the Arrhythmogenic and Thrombogenic Substrate. Circ. 2015;132:278–291. - PMC - PubMed
    1. Kamel H, Okin PM, Longstreth WT Jr., Elkind MS, Soliman EZ. Atrial cardiopathy: a broadened concept of left atrial thromboembolism beyond atrial fibrillation. Future Cardiol. 2015;11:323–31. - PMC - PubMed
    1. Donal E, Lip GY, Galderisi M, Goette A, Shah D, Marwan M, Lederlin M, Mondillo S, Edvardsen T, Sitges M, et al. EACVI/EHRA Expert Consensus Document on the role of multi-modality imaging for the evaluation of patients with atrial fibrillation. Eur Heart J Cardiovasc Imaging. 2016;17:355–83. - PubMed
    1. Tiffany Win T, Ambale Venkatesh B, Volpe GJ, Mewton N, Rizzi P, Sharma RK, Strauss DG, Lima JA, Tereshchenko LG. Associations of electrocardiographic P-wave characteristics with left atrial function, and diffuse left ventricular fibrosis defined by cardiac magnetic resonance: The PRIMERI Study. Heart Rhythm. 2015;12:155–62. - PMC - PubMed

Publication types