. 2022 Apr 15;149(8):dev200237.
doi: 10.1242/dev.200237. Epub 2022 Mar 25.

A kinase-dead Csf1r mutation associated with adult-onset leukoencephalopathy has a dominant inhibitory impact on CSF1R signalling

Affiliations

A kinase-dead Csf1r mutation associated with adult-onset leukoencephalopathy has a dominant inhibitory impact on CSF1R signalling

Jennifer Stables et al. Development. .

Abstract

Amino acid substitutions in the kinase domain of the human CSF1R gene are associated with autosomal dominant adult-onset leukoencephalopathy with axonal spheroids and pigmented glia (ALSP). To model the human disease, we created a disease-associated mutation (pGlu631Lys; E631K) in the mouse Csf1r locus. Homozygous mutation (Csf1rE631K/E631K) phenocopied the Csf1r knockout, with prenatal mortality or severe postnatal growth retardation and hydrocephalus. Heterozygous mutation delayed the postnatal expansion of tissue macrophage populations in most organs. Bone marrow cells from Csf1rE631K/+mice were resistant to CSF1 stimulation in vitro, and Csf1rE631K/+ mice were unresponsive to administration of a CSF1-Fc fusion protein, which expanded tissue macrophage populations in controls. In the brain, microglial cell numbers and dendritic arborisation were reduced in Csf1rE631K/+ mice, as in patients with ALSP. The microglial phenotype is the opposite of microgliosis observed in Csf1r+/- mice. However, we found no evidence of brain pathology or impacts on motor function in aged Csf1rE631K/+ mice. We conclude that heterozygous disease-associated CSF1R mutations compromise CSF1R signalling. We speculate that leukoencephalopathy associated with dominant human CSF1R mutations requires an environmental trigger and/or epistatic interaction with common neurodegenerative disease-associated alleles.

Keywords: CSF1R; Kinase-dead; Leukoencephalopathy; Macrophage.


Conflict of interest statement

Competing interests The authors declare no competing or financial interests.

Figures

Fig. 1.
Fig. 1.
Effect of Csf1r-E631K mutation on the mouse embryo. (A) Comparison of the gross morphology of a Csf1rE631K/+ embryo and two Csf1rE631K/E631K littermates. (B) Representative midline sections of each genotype stained with H&E. (C,D) Representative IBA1 staining in the foetal liver (C) and E12.5 head (D) of each genotype. (E,F) Morphometric analysis of IBA1 immunolabelling in foetal liver (E) and E12.5 head (F) of each genotype. Graphs shows mean±s.e.m. for Csf1r+/+ (n=3), Csf1rE631K/+ (n=4) and Csf1rE631K/E631K (n=6). ***P<0.001; **P<0.01 (unpaired Student's t-test). CP, choroid plexus; FL, foetal liver; FV, fourth ventricle; HB, hindbrain; LV, left ventricle; MB, midbrain; S, striatum. Scale bars: 1 mm (B); 100 µm (C); 500 µm (D).
Fig. 2.
Fig. 2.
Effect of heterozygous Csf1r-E631K mutation on murine bone development and postnatal growth. (A) Representative 3D reconstruction of the left hindlimb from micro-CT images of 3-week-old male Csf1r+/+, Csf1rE631K/+ and Csf1rE631K/E631K mice. (B) Weights of female and male mice at 3 and 6 weeks of age. (C) Representative 3D reconstruction of femurs from micro-CT images of 6-week-old female and male Csf1r+/+ and Csf1rE631K/+ mice. Scans were performed in 10 μm slices, and a depth of 1500 μm (or 150 slices) was analysed for both the trabecular (Tb) region (start identified as point of fusing of growth plates) and cortical region (start identified as last point of Tb bone). Regions analysed are highlighted in red. (D-I) Micro-CT analysis of (D) percentage Tb bone volume over tissue volume (BV/TV); (E) Tb bone surface-to-volume ratio (BS/TV); (F) Tb thickness (Tb. Th); (G) cortical (Ct.) bone area (Ar); (H) Ct thickness (Ct. Th.); and (I) marrow area in the cortical region analysed (Ct. Ma. Ar.). Data derived from four to six mice of each sex for each genotype at 6 weeks of age. Data are mean±s.d.; *P<0.05, **P<0.001, ***P<0.0001 (unpaired Student's t-tests).
Fig. 3.
Fig. 3.
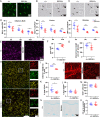
Effect of heterozygous Csf1r-E631K mutation on murine resident tissue macrophage populations at 3 weeks of age. (A-H) Images of tissues harvested from 3-week-old male Csf1r-EGFP transgenic Csf1r+/+ and Csf1rE631K/+ littermates. Images show the same depth of MIPs for each tissue. The lung (C) and liver (D) projections include stellate subcapsular populations (see insets). Comparable images from 7-week-old males of both genotypes are shown in Fig. S2. Images are representative of at least three mice of each genotype. WAT, white adipose tissue.
Fig. 4.
Fig. 4.
Age-dependent effect of heterozygous Csf1r-E631K mutation on murine resident renal macrophage populations. (A) Representative IBA1 staining from Csf1r+/+ and Csf1rE631K/+ kidneys at 3 weeks of age. Arrows indicate IBA1+ cells. G, glomeruli. (B) Number of IBA1+ cells in the cortex, based on the average number of cells from four field of views (area=0.25 μm2) per animal. Data derived from four to six mice of each genotype at 3, 7 and 9 weeks of age. Data are mean±s.d.; *P<0.05, **P<0.001, ***P<0.0001 (unpaired Student's t-tests).
Fig. 5.
Fig. 5.
Impact of heterozygous Csf1r-E631K mutation on murine BM and peritoneal macrophage populations and CSF1R expression. (A-F) Representative flow cytometry plots of (A) HSPCs (purple gate) and CPs (pink gate) and (B) mature myeloid cells of WT (+/+) and E631K heterozygous (E631K/+) mice. Note the left shift of anti-CD115 staining in monocytes in Csf1rE631K/+ mice (top right panel in B). Inset values are the percentages of these cell populations in proportion to total live cells as in the flow cytometry panel in Table S1. (C-E) CD115 MFIs for the CD115+ subset of (C) HSPCs, (D) CPs and (E) Ly6C+CD115+ monocytes. (F) Overlaid representative histograms (normalised to mode) for each genotype and the fluorescence −1 (FMO) control. (G-J) Flow cytometry analysis of CD45+ peritoneal (PT) cells from each genotype. (G) Representative flow cytometry gating strategy of PT cells stained for F4/80 and CD11b. CD115 MFI in (H) LPMs and (I) SPMs. (J) Overlaid representative histograms (normalised to mode) for CD115 staining for each F4/80+ population and each genotype and FMO control. (K-M) Proportional quantification of (K) LPMs, (L) SPMs and (M) F4/80intCD11b cells as a percentage of total CD45+ cells. Data derived from four to six mice for each genotype at 3 weeks of age. Data are mean±s.d.; *P<0.05, **P<0.001, ***P<0.0001 (unpaired Student's t-tests).
Fig. 6.
Fig. 6.
Effect of heterozygous Csf1r-E631K mutation on microglia and other cell populations in the murine brain. (A) Representative MIPs of confocal z-stack series of whole-mount cortex from 7-week-old mice transgenic for Csf1r-EGFP. Images show the same depth of MIP. (B,C) Representative IBA1 staining in the cortex (B) and striatum (C) of 9-week-old mice. Individual and merged staining for the insets is shown on the right. (D) Quantitative analysis of IBA1+ cells in the olfactory bulb, cortex and striatum of 3-, 9- and 43-week-old mice. (E-G) Analysis of microglia density and morphology. (E) MIP of confocal z-stack series showing IF localisation of IBA1+ cells in dentate gyrus of 7-week-old mice. (F,G) Quantitative analysis of IBA1+ cells in the dentate gyrus performed on microglial cell body area (average of 20 cells/animal) (F) and average total process length per cell (average of three fields of view per animal) (G). (H) Representative MIP of immunofluorescent localisation of P2RY12, TMEM119 and merged staining in the cortex of 7-week-old mice showing complete overlap. (I) Quantitative analysis of the percentage area of colocalised P2RY12 and TMEM119 staining in the cortex of 7-week-old mice. (J) Representative MIP of confocal z-stack series showing GFAP staining in the dentate gyrus (DG) of 7-week-old mice. (K,L) Quantitative analysis of the percentage area of GFAP+ staining (average of three areas) of 7-week-old brains using immunofluorescence histochemistry (K) and 43-week-old brains using IHC (L). (M) Quantitative analysis of the number of DCX+ cells/mm of DG (average of three DG/animal). (N) Representative Luxol Fast Blue with Cresyl Fast Violet counter stain in 9-week-old brains. (O) Quantitative analysis of the area of half of the corpus callosum (CC) as a percentage area of the cerebral hemisphere at 9 weeks of age. n=5 or 6/group. Data are mean±s.d.; *P<0.05, **P<0.01, ***P<0.001, (unpaired Student's t-tests).
Fig. 7.
Fig. 7.
Effect of Csf1r genotype on sensorimotor parameters in aged mice. (A) Quantification of the Von Frey test as a measurement of mechanical allodynia in rodents. The vertical axis shows the threshold force at which the mouse withdrew its paw, a measure of pain sensitivity. (B-D) Quantification of the parallel rod floor test as a measure of balance and coordination, quantified as distance covered (B), number of foot slips (C) and ataxia index score (D). (E-G) Quantification of the CatWalk XT gait analysis showing results for step regularity index (E), cadence (F) or stride length of either the left front (LF) or right front (RF) paw (G). Data derived from 10-14 mice for each genotype at 43 weeks of age. Data are mean±s.d. No significant differences were detected between genotypes (unpaired Student's t-tests).
Fig. 8.
Fig. 8.
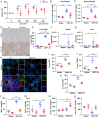
Effect of heterozygous Csf1r-E631K mutation on responses to CSF1 in vitro and in vivo. (A) In vitro response of BM cells from Csf1r+/+ and Csf1rE631K/+ mice to recombinant human CSF1 or mouse GM-CSF (CSF2), expressed as optical density (OD) relative to the unstimulated cultures in each case. n=5/group; four technical replicates per animal. (B-O) In vivo response. Weight of the liver (B) and spleen (C) of all animals following acute CSF1-Fc treatment. (D) Representative images of F4/80 IHC staining of liver sections from all treatment groups. (E) Percentage area stained for F4/80 in liver sections (average of four areas/animal). (F,G) qPCR analysis showed upregulation of CSF1R target genes, including Mmp9 (F) and Plau (G). (H) Representative images of GFP, CD169 and F4/80 staining of spleen sections from all treatment groups. (I-K) Quantification of the percentage area stained for GFP (I), CD169 (J) and F4/80 (K) in spleen sections (average of two depths/animal, with least 50% of each spleen on the sagittal sections analysed). (L,M) Quantitative analysis of IBA1+ cells in the (L) kidney and (M) heart. (N,O) Serum CSF1 (N) and IGF1 (O) in control and treated mice as indicated; n=4-9 per group. *P<0.05, **P<0.01, ***P<0.001, ****P<0.0001 [two-way ANOVA with multiple comparisons (A) or Mann–Whitney U test (B,C,E-G,I-O)]. Scale bars: 200 μm (H); 50 μm (D, inset H).

References

    1. Arreola, M. A., Soni, N., Crapser, J. D., Hohsfield, L. A., Elmore, M. R. P., Matheos, D. P., Wood, M. A., Swarup, V., Mortazavi, A. and Green, K. N. (2021). Microglial dyshomeostasis drives perineuronal net and synaptic loss in a CSF1R(+/−) mouse model of ALSP, which can be rescued via CSF1R inhibitors. Sci. Adv. 7, eabg1601. 10.1126/sciadv.abg1601 - DOI - PMC - PubMed
    1. Bain, C. C., Hawley, C. A., Garner, H., Scott, C. L., Schridde, A., Steers, N. J., Mack, M., Joshi, A., Guilliams, M., Mowat, A. M.et al. (2016). Long-lived self-renewing bone marrow-derived macrophages displace embryo-derived cells to inhabit adult serous cavities. Nat. Commun. 7, ncomms11852. 10.1038/ncomms11852 - DOI - PMC - PubMed
    1. Bennett, F. C., Bennett, M. L., Yaqoob, F., Mulinyawe, S. B., Grant, G. A., Hayden Gephart, M., Plowey, E. D. and Barres, B. A. (2018). A combination of ontogeny and CNS environment establishes microglial identity. Neuron 98, 1170-1183.e78. 10.1016/j.neuron.2018.05.014 - DOI - PMC - PubMed
    1. Biundo, F., Chitu, V., Shlager, G. G. L., Park, E. S., Gulinello, M. E., Saha, K., Ketchum, H. C., Fernandes, C., Gökhan, Ş., Mehler, M. F.et al. (2020). Microglial reduction of colony stimulating factor-1 receptor expression is sufficient to confer adult onset leukodystrophy. Glia. 69:779-791. 10.1002/glia.23929 - DOI - PMC - PubMed
    1. Bohlen, C. J., Friedman, B. A., Dejanovic, B. and Sheng, M. (2019). Microglia in brain development, homeostasis, and neurodegeneration. Annu. Rev. Genet. 53, 263-288. 10.1146/annurev-genet-112618-043515 - DOI - PubMed

Publication types

Substances