. 2022 Jun;82(9):957-969.
doi: 10.1002/pros.24342. Epub 2022 Mar 25.

PLK4 is upregulated in prostate cancer and its inhibition reduces centrosome amplification and causes senescence

Affiliations

PLK4 is upregulated in prostate cancer and its inhibition reduces centrosome amplification and causes senescence

Chandra K Singh et al. Prostate. 2022 Jun.

Abstract

Background: Identification of novel molecular target(s) is important for designing newer mechanistically driven approaches for the treatment of prostate cancer (PCa), which is one of the main causes of morbidity and mortality in men. In this study, we determined the role of polo-like kinase 4 (PLK4), which regulates centriole duplication and centrosome amplification (CA), in PCa.

Materials and methods: Employing human PCa tissue microarrays, we assessed the prevalence of CA, correlated with Gleason score, and estimated major causes of CA in PCa (cell doubling vs. centriole overduplication) by staining for mother/mature centrioles. We also assessed PLK4 expression and correlated it with CA in human PCa tissues and cell lines. Further, we determined the effects of PLK4 inhibition in human PCa cells.

Results: Compared to benign prostate, human PCa demonstrated significantly higher CA, which was also positively correlated with the Gleason score. Further, most cases of CA were found to arise by centriole overduplication rather than cell doubling events (e.g., cytokinesis failure) in PCa. In addition, PLK4 was overexpressed in human PCa cell lines and tumors. Moreover, PLK4 inhibitors CFI-400945 and centrinone-B inhibited cell growth, viability, and colony formation of both androgen-responsive and androgen-independent PCa cell lines. PLK4 inhibition also induced cell cycle arrest and senescence in human PCa cells.

Conclusions: CA is prevalent in PCa and arises predominantly by centriole overduplication as opposed to cell doubling events. Loss of centrioles is cellular stress that can promote senescence and suggests that PLK4 inhibition may be a viable therapeutic strategy in PCa.

Keywords: CFI-400945; PLK4; centriole overduplication; centrosome; prostate cancer.


Conflict of interest statement

The authors declare no conflicts of interest.

Figures
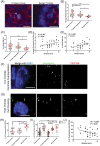
Figure 1
Figure 1
Centrosome amplification occurs in PCa, correlates with a higher Gleason score, and arises predominantly by centriole overduplication. (A) Micrographs of centrosomes (pericentrin, green) in PCa (left) and benign prostate specimen (right). Tissues were also stained for cytokeratins (red) and DNA (blue). The white arrowhead denotes a mitotic cell in the middle of PCa image. Scale bars = 10 μm. (B) The average centrosome number (assessed by pericentrin foci) in each tumor and benign sample is plotted. Individual cell data for each specimen are shown in Figure S1A. (C) CA was defined as >2 pericentrin foci in a cell. At least 50 cells were assessed in each tumor. Each dot represents one PCa or benign specimen. (D) Correlation of average pericentrin foci per cell versus Gleason score. (E) Correlation of the percent of cells with >2 pericentrin foci versus Gleason score. (F, G) Micrographs of pericentrin (green) and CEP164 (red) staining in PCa demonstrating either low overlap (F) or high overlap (G) of pericentrin and CEP164, suggesting CA via centriole overduplication or cell doubling, respectively. Pericentrin = green, CEP164 = red, and DNA/DAPI = blue. Scale bars = 5 μm. (H) A dot‐plot comparing the percent of centrosomes (defined by pericentrin staining) that costained for a mother/mature centriole marker (CEP164). Each dot represents the average of cells within one tumor/sample. (I) The cells within each PCa and hyperplastic specimen with >2 pericentrin foci (CA) were further analyzed to determine the cause of CA in these cells. The dot‐plot shows the percent of pericentrin foci in these cells that costained with CEP164 (black‐outlined squares). For comparison, the percent of pericentrin foci costaining for CEP164 is also shown for cells with 1–2 pericentrin foci in PCa and hyperplastic specimens (black‐filled circles). Only non‐CA cells are shown for benign specimens, as the number of cells with CA is very low. Each point represents the average of each specimen. Individual cell data for each specimen are shown in Figure S1B. (J) The percent of centrosomes costaining for CEP164 was plotted against tumor's Gleason score. In all panels, bars represent means ± SD. *p < 0.05 and ***p < 0.001. CA, centrosome amplification; DAPI, 4′,6‐diamidino‐2‐phenylindole; PCa, prostate cancer.[Color figure can be viewed at wileyonlinelibrary.com]
Figure 2
Figure 2
PLK4 is overexpressed in human PCa and its overexpression correlates with worse survival. (A) The representative micrographs of PCa and benign prostate specimen showing PLK4 immunostaining. TMA #PR956 (US Biomax) was immunostained using PLK4 antibody and ABC‐alkaline phosphatase reagent followed by incubation with Vector Red chromogen and then hematoxylin as a nuclear counterstain. Images were taken at ×20 magnification. Dotted areas were zoomed‐in using Nuance software. (B) The PLK4‐stained slide was scanned using Vectra system and analyzed using the inForm software for PLK4 optical density (OD) as a measure of the stain in each tissue core. The graph was plotted and t tests was used for statistical comparison. (C) PLK4 level was also plotted as per Gleason grade in PCa. Next, (D) disease‐free survival (DFS) and (E) overall survival (OS) were analyzed based on PLK4 mRNA expression from the 497 PCa patients with available survival data from TCGA; cBioPortal (33) was used to query the data. PLK4 mRNA Z score of 0 was used as a cutoff for “low” versus “high” PLK4 expression. (F) PLK4 expression levels based on Gleason score. (G,H) CA20 was calculated as described by Ogden et al. CA20 incorporates PLK4 along with AURKA, CCNA2, CCND1, CCNE2, CDK1, CEP63, CEP152, E2F1, E2F2, LMO4, MDM2, MYCN, NDRG1, NEK2, PIN1, PLK1, SASS6, STIL, and TUBG1 genes. Patients were stratified into two groups using the median CA20 score. The Kaplan–Meier method was employed to plot the survival curves, and p values shown on the survival curves were determined by log‐rank tests. (I) CA20 scores based on Gleason score. ANOVA was used for statistical comparisons of groups in panels (C,F, and I), and bars represent means ± SD. *p < 0.05; **p < 0.01, and ***p < 0.001. ABC, avidin/biotin complex; ANOVA, analysis of variance; CA20, centrosome amplification 20; mRNA, messenger RNA; PCa, prostate cancer; PLK4, polo‐like kinase 4; TMA, tissue microarray. [Color figure can be viewed at wileyonlinelibrary.com]
Figure 3
Figure 3
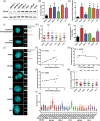
PLK4 overexpression correlates with CA in PCa cell lines and is reversed by PLK4 inhibition. (A) Immunoblotting for PLK4 and actin in PCa cell lines (DU145, 22Rν1, PC3, LNCaP, and C4‐2) compared to normal prostate epithelial cells (HPrEC) (B) Quantification of protein bands (ratio of PLK4:actin) from immunoblotting. Bars represent means ± SD from three blots. (C) RT‐qPCR analysis of PLK4 in PCa cell lines compared to HPrEC. GAPDH was used as an endogenous control. (D) Quantification of centrioles in each of prostate cell lines. (E) The percentage of cells with CA (defined as >4 centrin foci) is plotted for each cell line. (F) Correlation of PLK4 protein and mRNA levels in prostate cell lines. Pearson r = 0.513, p = 0.298. (G) Correlation of centrioles with PLK4 protein expression from immunoblotting. (H) Correlation of centrioles with PLK4 mRNA. (I) Examples of HPrEC cells exhibiting centriole overduplication (low percentage of centrosomes with mother centrioles; induced by PLK4 overexpression) and cell doubling (high percentage of centrosomes with mother centrioles; induced by cytochalasin D). Scale bar = 10 µm. (J) Representative images of prostate cell lines stained with centrin and CEP164. Scale bar = 10 µm. (K) Quantification of the percentage of centrioles with CEP164. Each dot represents one cell. (L) Number of centrioles in each cell line treated with CFI‐400945 (50 nM for 48 h) or centrinone‐B (50, 100, or 500 nM for 48 h). Each dot represents a single cell. Bars represent means ± SD and statistical significance is indicated as *p < 0.05; **p < 0.01, and ***p < 0.001. CA, centrosome amplification; HPrEC, human primary prostate epithelial cell; PCa, prostate cancer; PLK4, polo‐like kinase 4; RT‐qPCR, reverse transcription‐quantitative real‐time PCR. [Color figure can be viewed at wileyonlinelibrary.com]
Figure 4
Figure 4
PLK4 inhibition with small‐molecule inhibitor CFI‐400945 significantly reduces cell growth, viability and colony formation of human PCa cells. (A,B) PCa cells were treated at specified concentrations of CFI‐400945 (0, 25, 50, 100 nM) for 72 h, followed by cell growth and viability analyses using Trypan blue exclusion assay. The data were analyzed with GraphPad Prism 5 software using one‐way ANOVA followed by Dunnett's multiple comparison tests. The data are presented as means ± SEM with statistical significance (*p < 0.05; **p < 0.01, and ***p < 0.001). The statistical significance represents for all the PCa cell lines compared to HrPEC at specified CFI‐400945 concentrations (except for DU145 cell growth at 25 nM, which is not significant). (C) For colony formation analysis, PCa cells were treated for 72 h with CFI‐400945 at specified concentrations. These treated cells were then harvested and replated equally (500 cells) in six‐well plates and allowed to grow for approximately 2 weeks. Colonies were stained with 1% crystal violet, washed, and air‐dried followed by digital photography. CA, centrosome amplification; DMSO, dimethyl sulfoxide; PCa, prostate cancer; PLK4, polo‐like kinase 4. [Color figure can be viewed at wileyonlinelibrary.com]
Figure 5
Figure 5
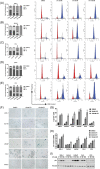
PLK4 inhibition by CFI‐400945 induces cell cycle arrest in the G2/M phase and senescence‐like phenotypes in human PCa cells. (A–E) PCa cell lines DU145, 22Rν1, PC3, LNCaP, and C4‐2 were treated with CFI‐400945, stained with propidium iodide, and analyzed by flow cytometry. The data were analyzed using one‐way ANOVA followed by Dunnett's multiple comparison tests and presented as means ± SEM with statistical significance (**p < 0.01; ***p < 0.001) for G2/M cell cycle arrest. (F) HPrEC and PCa cell lines were treated with CFI‐400945 and stained for β‐galactosidase. The representative images at 40x magnification from each treatment group are presented. (G) SA‐β‐Gal‐positive cells were scored in four different fields. Results are expressed as the mean percentage of SA‐β‐Gal‐positive cells (mean ± SEM). (H,I) CDKN1A (p21) mRNA and protein levels in PCa cells. GAPDH was used as an endogenous control for CDKN1A mRNA analysis. Vinculin was used as a protein loading control. The data represent three biological replicates. ANOVA, analysis of variance; CA, centrosome amplification; DMSO, dimethyl sulfoxide; HPrEC, human primary prostate epithelial cell; mRNA, messenger RNA; PCa, prostate cancer; PLK4, polo‐like kinase 4; SA‐β‐Gal, senescence‐associated β‐galactosidase. [Color figure can be viewed at wileyonlinelibrary.com]

Similar articles

Cited by

References

    1. Denu RA, Zasadil LM, Kanugh C, Laffin J, Weaver BA, Burkard ME. Centrosome amplification induces high grade features and is prognostic of worse outcomes in breast cancer. BMC Cancer. 2016;16(1):47. - PMC - PubMed
    1. Siegel RL, Miller KD, Fuchs HE, Jemal A. Cancer statistics, 2021. CA Cancer J Clin. 2021;71(1):7‐33. - PubMed
    1. Pihan GA, Purohit A, Wallace J, et al. Centrosome defects and genetic instability in malignant tumors. Cancer Res. 1998;58(17):3974‐3985. - PubMed
    1. Pihan GA, Purohit A, Wallace J, Malhotra R, Liotta L, Doxsey SJ. Centrosome defects can account for cellular and genetic changes that characterize prostate cancer progression. Cancer Res. 2001;61(5):2212‐2219. - PubMed
    1. Toma MI, Friedrich K, Meyer W, et al. Correlation of centrosomal aberrations with cell differentiation and DNA ploidy in prostate cancer. Anal Quant Cytol Histol. 2010;32(1):1‐10. - PubMed

Publication types