. 2022 Apr;20(3):111-124.
doi: 10.1089/adt.2021.128. Epub 2022 Mar 23.

Development of a High-Throughput Screening Assay for Small-Molecule Inhibitors of Androgen Receptor Splice Variants

Affiliations

Development of a High-Throughput Screening Assay for Small-Molecule Inhibitors of Androgen Receptor Splice Variants

Amy E Monaghan et al. Assay Drug Dev Technol. 2022 Apr.

Abstract

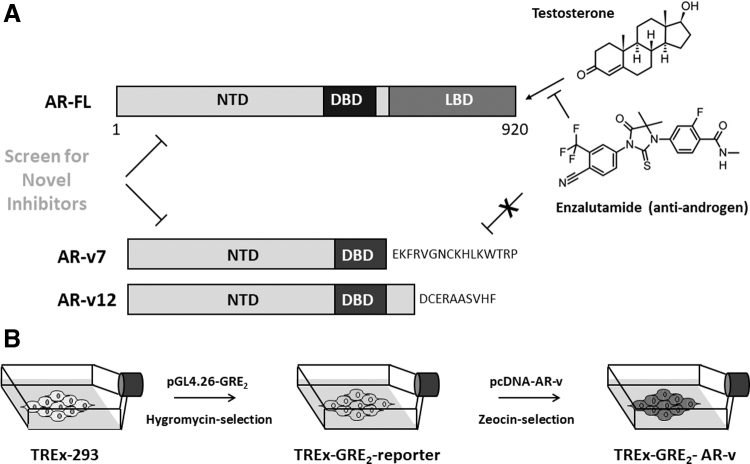
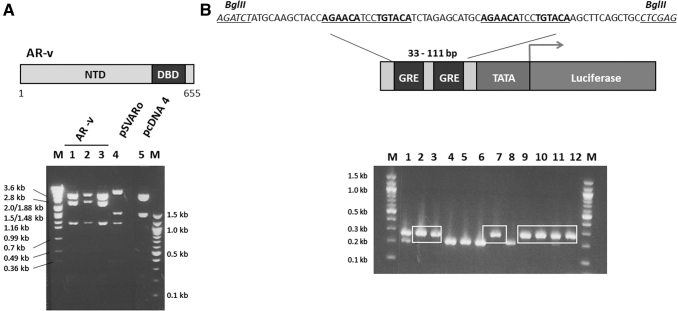
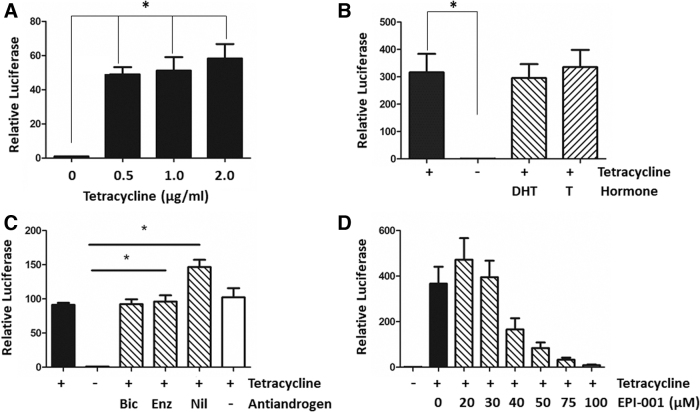
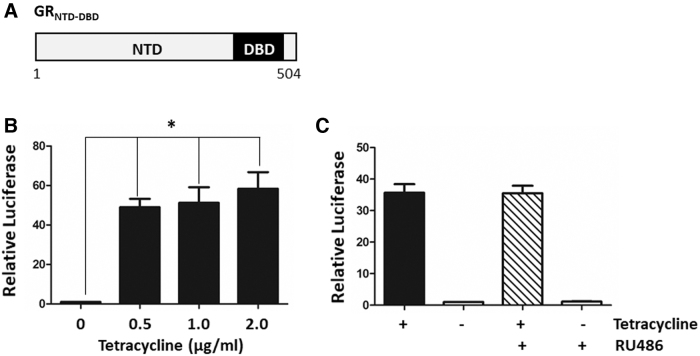
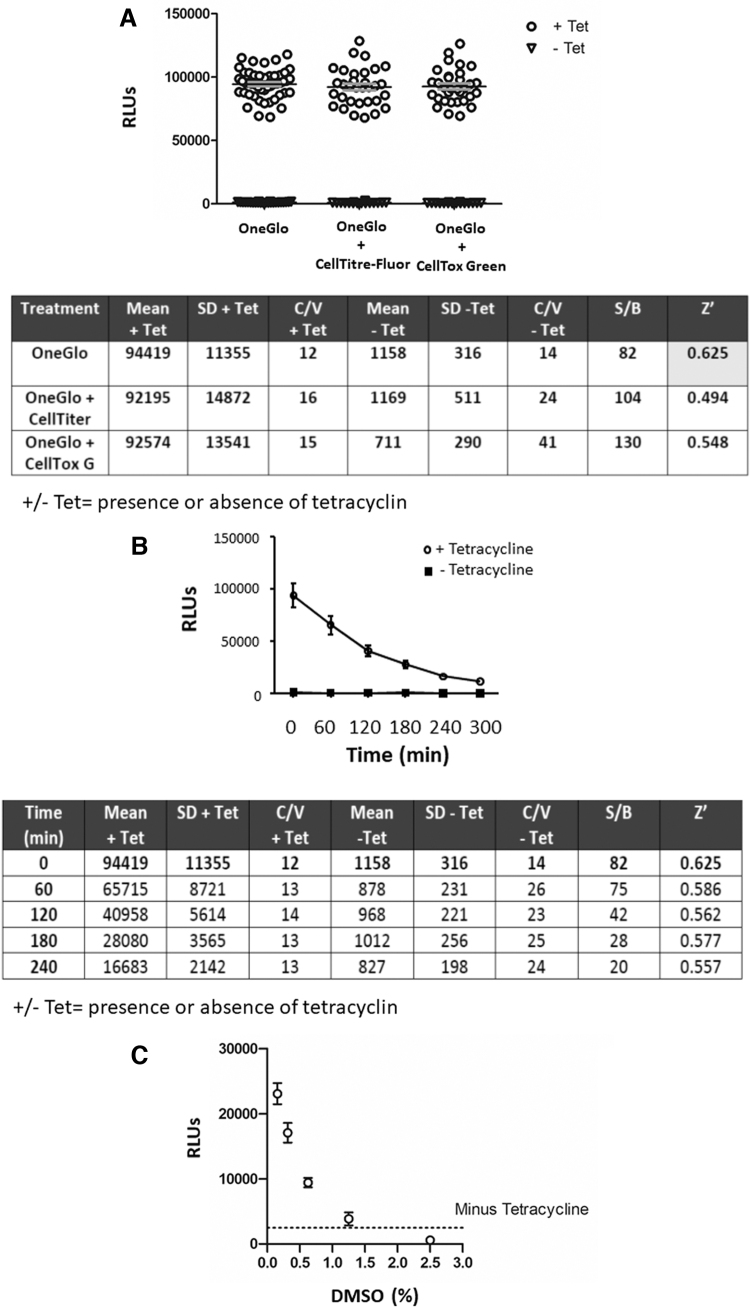
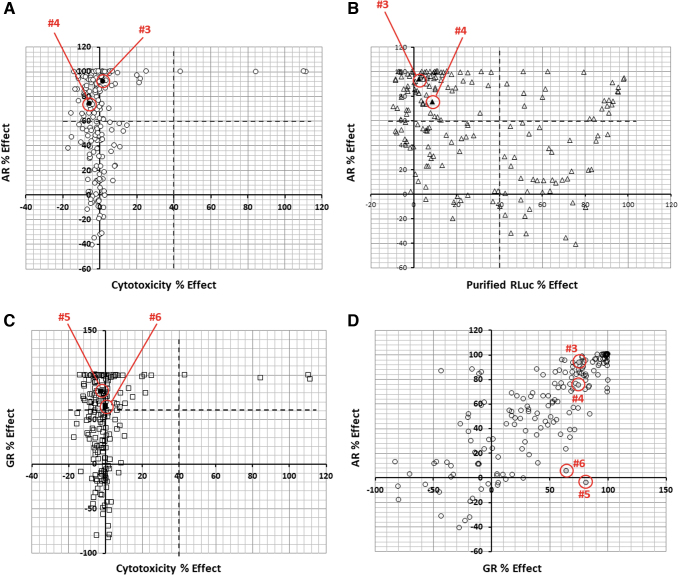
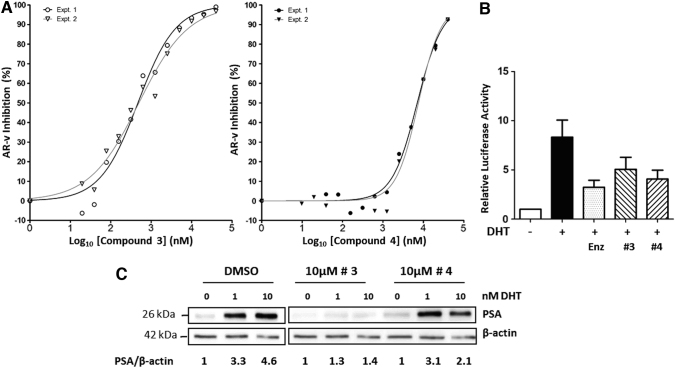
The role of the androgen receptor (AR) in the progression of prostate cancer (PCa) is well established and competitive inhibition of AR ligand binding domain (LBD) has been the mainstay of antiandrogen therapies for advanced and metastatic disease. However, the efficacy of such drugs is often limited by the emergence of resistance, mediated through point mutations and receptor splice variants lacking the AR-LBD. As a result, the prognosis for patients with malignant, castrate-resistant disease remains poor. The amino terminal domain (NTD) of the AR has been shown to be critical for AR function. Its modular activation function (AF-1) is important for both gene regulation and participation in protein-protein interactions. However, due to the intrinsically disordered structure of the domain, its potential as a candidate for therapeutic intervention has been generally overlooked. In this article, we describe the design and development of a functional cell-based assay aimed at identifying small-molecule inhibitors of the AR-NTD. We demonstrate the suitability of the assay for high-throughput screening platforms and validate two initial hits emerging from a small, targeted, library screen in PCa cells.

Keywords: AR-vs; androgen receptor; castrate-resistant prostate cancer; high-throughput screen; intrinsically disordered structure; prostate cancer.


Conflict of interest statement

No competing financial interests exist.

Figures

Fig. 1.
Fig. 1.
AR splice variant screening assay. (A) Schematic representation of the AR-FL and splice variants AR-v7 and AR-v12 lacking the LBD. The figure illustrates binding of testosterone, and the antiandrogen enzalutamide to the AR-FL, but not AR-vs. (B) Two-step design for the generation of double-stable cell lines expressing a receptor-dependent reporter gene and an inducible AR-v polypeptide. AR-FL, full-length androgen receptor; AR-v, androgen receptor splice variant; DBD, DNA binding domain; LBD, ligand binding domain; NTD, amino terminal domain.
Fig. 2.
Fig. 2.
Design and construction of expression and reporter gene plasmids. (A) Schematic representation of AR-v, amino acids 1–655, representing a generic splice variant containing the nuclear localization signal and part of the hinge domain. Agarose gel illustrating the expected digestion pattern of three fragments of 1,110, 2,335, and 3,443 bp for pcDNA-AR-v after cleavage with NcoI restriction enzyme (lanes 1 to 3). For comparison, the parental pcDNA4/TO/myc-HisB plasmid and pSVARo plasmids were also digested with NcoI. The base-pair size DNA ladder (M) is shown. (B) The upstream region of the GRE2-TATA-Luciferase vector containing two palindromic hormone response elements (highlighted in bold and underlined). Oligonucleotides containing this sequence were designed with flanking asymmetric BglII and XhoI restriction sites (italics and underlined), and cloned into the pGL4.26-Luciferase vector. Following cloning and transformation of pGL4.26-GRE2-luc, single colonies were selected from the plate and subjected to a colony PCR reaction and products resolved on a 2% agarose gel. A 78bp increase can be detected in positive clones of the pGL4.26-GRE2-Luciferase vector where the hormone response elements have been introduced compared to the parental pGL4.26-Luciferase plasmid, seen in lanes 2, 3, 7, 9, to 12. Selected sizes for the DNA ladder (M) are shown.
Fig. 3.
Fig. 3.
Validation of stable TREx-GRE2-reporter cell lines. (A) TREx-293 cells were transiently transfected with pcDNA-AR-v and pGL4.26-GRE2-luc. Chart showing luciferase reporter gene activity (relative luciferase) after induction of AR-v with increasing concentrations of tetracycline. (B, C) Effects of hormone agonists and antagonists on AR-v activity in stable cells with integrated luciferase reporter and AR-v constructs. Luciferase activity in the absence (−) or presence (+) of tetracycline (1 μg/mL). Addition of 10 nM testosterone (T) or DHT did not significantly change AR-v-dependent transcription (B). (C) AR-v-dependent transcription activity is resistant to the antiandrogens bicalutamide (Bic, 10 μM), enzalutamide (Enz, 1 μM), and nilutamide (Nil, 10 μM) that target the AR-LBD (Fig. 1A). (D) Dose-dependent inhibition of AR-v activity was seen with increasing concentrations of EPI-001, an inhibitor of the AR-NTD. Kruskal–Wallis one-way ANOVA with Dunnett's posthoc test (*p < 0.05, n = 3). ANOVA, analysis of variance; DHT, dihydro-testosterone.
Fig. 4.
Fig. 4.
Stable reporter gene cell line expressing the GRNTD-DBD. (A) Schematic representation of the GRNTD-DBD polypeptide, amino acids 1 to 504. (B) Transient transfection of TREx-293 cells with pcDNA-GRNTD-DBD and pGL4.26-GRE2-luc. Expression of GRNTD-DBD with increasing concentrations of tetracycline resulted in a significant increase in luciferase activity. (C) Transient transfection of TREx-GRE2-reporter cells with pcDNA-GRNTD-DBD resulted in increased reporter gene activity (as in B), which was not inhibited with the anti-glucocorticoid RU486 (1 μM mifepristone). Kruskal–Wallis one-way ANOVA with Dunnett's posthoc test (*p < 0.05, n = 3).
Fig. 5.
Fig. 5.
Optimization of luciferase assays using the TREx-GRE2-AR-v cell line. (A) TREx-GRE2-AR-v cells were seeded at 1,250 cells/well using the Matrix WellMate in the presence or absence of 1 μg/mL tetracycline and incubated for 60 min at room temperature before incubation at 37°C, 95% O2 and 5% CO2. Twenty-four hours later, cells were treated with OneGlo luciferase reagent and RLUs were read using the PHERAstar microplate reader. All data plotted with mean (bar). The Z′ for OneGlo alone exceeded the 0.6 threshold (highlighted), with a signal to background ratio of 82. (B) The TREx-GRE2-AR-v luciferase assay was stable up to 4 h with a Z′ exceeding 0.5. AR expression induced with tetracycline (as described in A) resulted in significant luciferase activity at all time points (mean ± SD; two-way ANOVA with Bonferonni posthoc test (p < 0.05). (C) DMSO tolerance of the TREx-GRE2-AR-v cell line in the optimized 384-well format. TREx-GRE2-AR-v cells were seeded in 384-well plates at a density of 1,250 cells/well in the presence or absence of tetracycline as indicated. DMSO was added to give final concentrations indicated using the Biomek® laboratory automation workstation. Cells were incubated overnight as previously described and luciferase assays were conducted the following day using OneGlo reagent. DMSO significantly inhibited luciferase activity at all concentrations, but the levels of inhibition were acceptable up to 1.25%. Data are expressed with mean ± SEM and were analyzed using Kruskal–Wallis one-way ANOVA and Dunnett's posthoc test (p < 0.05). SEM, standard error of the mean.
Fig. 6.
Fig. 6.
High-throughput screening using the TREx-HRE2-AR-v cell line. Greiner opaque white-walled 384-well plates were preloaded with compounds from the BioAscent (green), NCC (red), and Selleckchem (yellow) chemical libraries using the ECHO liquid handler to give a final concentration of 10 μM/well. Cells were seeded in the presence of tetracycline and incubated for 60 min at room temperature, before incubation for 16 h at 37°C, 5% CO2, as described above. The following day, cells were lysed using OneGlo reagent and luciferase activity was measured using the PHERAstar plate reader. Data were uploaded to Activity base and hits were identified as those compounds with significantly decreased luciferase activity compared to the maximum. Normalized effect was plotted against object ID in Activity base, and the 182 hits were highlighted using enlarged dots. Data were analyzed using robust statistics based on the median and robust SD (n = 1) and a total of 6,759 compounds tested. SD, standard deviation. Color images are available online.
Fig. 7.
Fig. 7.
Screening of libraries of drug-like molecules for AR-v inhibitors. (A) Inhibition of AR-v activity is plotted as “% Effect” against “Cytotoxicity % Effect.” Upper left quadrant indicates small molecules with significant inhibitory activity (>60%) of AR-v transactivation with little/no general cytotoxicity (<30%). (B) AR % Effect plotted against inhibition of luciferase alone activity. Upper left quadrant indicates small molecules with significant inhibitory activity (>60%) of AR-v transactivation with little nonspecific activity against the reporter gene (<40%). (C) Inhibition of GRNTD-DBD transcriptional activity plotted as “GR Effect %” against general cytotoxicity. Upper left quadrant indicates small molecules with significant inhibitory activity (>60%) of GR transactivation with little/no general cytotoxicity (<30%). (D) Inhibition of AR-v activity plotted against inhibition of GRNTD-DBD. The position of hits #3, #4, #5, and #6 is indicated with red circles (A–D). Color images are available online.
Fig. 8.
Fig. 8.
Inhibition of AR-FL in PCa cells. (A) IC50 measurements for inhibition of AR-v in TREx-GRE2-AR-v cells: dose–response of AR-v activity in presence of increasing concentrations of compound #3 gave IC50 values of 470 and 497 nM in experiments 1 and 2, respectively. Dose–response of AR-v activity in presence of compound #4 just approached a plateau at the highest concentration tested and IC50 values of 7.0 and 7.6 μM were calculated for experiments 1 and 2, respectively. All data were plotted, and analysis was conducted using GraphPad Prism nonlinear regression with four parameters (variable slope) (n = 2). Percentage inhibition was calculated with + tetracycline control as 0% and −tetracycline control as 100% in each independent experiment. (B) In the prostate cell line, VCaP, endogenous AR-FL induced reporter gene activity in response to DHT (10 nM). Enzalutamide significantly inhibited reporter gene activity at a concentration of 10 μM. Compounds #3 and #4 inhibited reporter gene activity at a similar level to enzalutamide, at concentrations of 5 and 10 μM, respectively. All results are expressed as mean ± SEM. (C) Inhibition of endogenous expression of the well-validated androgen-responsive protein PSA in VCaP PCa cells. Hormone (DHT) treatment resulted in threefold-to-fivefold increase in PSA expression (first three lanes). Compound #3 reduced expression by 60%–70%, while compound #4 inhibited AR activity maximally by ca.50%.

References

    1. Globocan (2020). https://gco.iarc.fr/today/data/factsheets/cancers/27-Prostate-fact-sheet... (accessed February 28, 2022).
    1. Estébanez-Perpiñá E, Bevan CL, McEwan IJ: Eighty years of targeting androgen receptor activity in prostate cancer: the fight goes on. Cancers (Basel) 2021;13:509. - PMC - PubMed
    1. Meng MV, Grossfeld GD, Sadetsky N, Mehta SS, Lubeck DP, Carroll PR: Contemporary patterns of androgen deprivation therapy use for newly diagnosed prostate cancer. Urology 2002;60(3 Suppl 1):7–11. - PubMed
    1. Scher HI, Sawyers CL: Biology of progressive, castration-resistant prostate cancer: directed therapies targeting the androgen-receptor signaling axis. J Clin Oncol 2005;23:8253–8261. - PubMed
    1. Bourke L, Kirkbride P, Hooper R, Rosario AJ, Chico TJ, Rosario DJ: Endocrine therapy in prostate cancer: time for reappraisal of risks, benefits and cost-effectiveness? Br J Cancer 2013;108:9–13. - PMC - PubMed

Publication types

Substances