Assessing the best time interval between doses in a two-dose vaccination regimen to reduce the number of deaths in an ongoing epidemic of SARS-CoV-2
- PMID: 35333872
- PMCID: PMC8986122
- DOI: 10.1371/journal.pcbi.1009978
Assessing the best time interval between doses in a two-dose vaccination regimen to reduce the number of deaths in an ongoing epidemic of SARS-CoV-2
Abstract
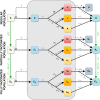
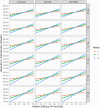
The SARS-CoV-2 pandemic is a major concern all over the world and, as vaccines became available at the end of 2020, optimal vaccination strategies were subjected to intense investigation. Considering their critical role in reducing disease burden, the increasing demand outpacing production, and that most currently approved vaccines follow a two-dose regimen, the cost-effectiveness of delaying the second dose to increment the coverage of the population receiving the first dose is often debated. Finding the best solution is complex due to the trade-off between vaccinating more people with lower level of protection and guaranteeing higher protection to a fewer number of individuals. Here we present a novel extended age-structured SEIR mathematical model that includes a two-dose vaccination schedule with a between-doses delay modelled through delay differential equations and linear optimization of vaccination rates. By maintaining the minimum stock of vaccines under a given production rate, we evaluate the dose interval that minimizes the number of deaths. We found that the best strategy depends on an interplay between the vaccine production rate and the relative efficacy of the first dose. In the scenario of low first-dose efficacy, it is always better to vaccinate the second dose as soon as possible, while for high first-dose efficacy, the best strategy of time window depends on the production rate and also on second-dose efficacy provided by each type of vaccine. We also found that the rate of spread of the infection does not affect significantly the thresholds of the best window, but is an important factor in the absolute number of total deaths. These conclusions point to the need to carefully take into account both vaccine characteristics and roll-out speed to optimize the outcome of vaccination strategies.
Conflict of interest statement
The authors have declared that no competing interests exist.
Figures


References
-
- JCVI. Optimising the COVID-19 vaccination programme for maximum short-term impact; 2021. https://www.gov.uk/government/publications/prioritising-the-first-covid-..., [Accessed: 2021-06-18].
-
- MS. Décimo Quinto Informe Técnico—Orientações Técnicas Relativas à Continuidade da Campanha Nacional de Vacinação Contra a COVID-19; 2021. https://www.gov.br/saude/pt-br/media/pdf/2021/maio/3/anexo-decimo-quinto... [Accessed: 2021-07-23].
-
- PHE. COVID-19 vaccination programme—Information for healthcare practitioners; 2021. https://assets.publishing.service.gov.uk/government/uploads/system/uploa... [Accessed: 2021-07-23].
-
- Stowe J, Andrews N, Gower C, Gallagher E, Utsi L, Simmons R, et al. Effectiveness of COVID-19 vaccines against hospital admission with the Delta (B.1.617.2) variant; 2021. https://media.tghn.org/articles/Effectiveness_of_COVID-19_vaccines_again... [Accessed: 2021-07-26].
-
- Voysey M, Clemens SAC, Madhi SA, Weckx LY, Folegatti PM, Aley PK, et al. Single-dose administration and the influence of the timing of the booster dose on immunogenicity and efficacy of ChAdOx1 nCoV-19 (AZD1222) vaccine: a pooled analysis of four randomised trials. The Lancet. 2021;397(10277):881–891. doi: 10.1016/S0140-6736(21)00432-3 - DOI - PMC - PubMed
Publication types
MeSH terms
Substances
LinkOut - more resources
Full Text Sources
Medical
Miscellaneous

