. 2022 Mar 25;79(4):206.
doi: 10.1007/s00018-022-04224-2.

Inflammation and neutrophil extracellular traps in cerebral cavernous malformation

Affiliations

Inflammation and neutrophil extracellular traps in cerebral cavernous malformation

Anthony C Y Yau et al. Cell Mol Life Sci. .

Erratum in

  • Correction: Inflammation and neutrophil extracellular traps in cerebral cavernous malformation.
    Yau ACY, Globisch MA, Onyeogaziri FC, Conze LL, Smith R, Jauhiainen S, Corada M, Orsenigo F, Huang H, Herre M, Olsson AK, Malinverno M, Sundell V, Rezai Jahromi B, Niemelä M, Laakso A, Garlanda C, Mantovani A, Lampugnani MG, Dejana E, Magnusson PU. Yau ACY, et al. Cell Mol Life Sci. 2022 Jun 29;79(7):388. doi: 10.1007/s00018-022-04418-8. Cell Mol Life Sci. 2022. PMID: 35767072 Free PMC article. No abstract available.

Abstract

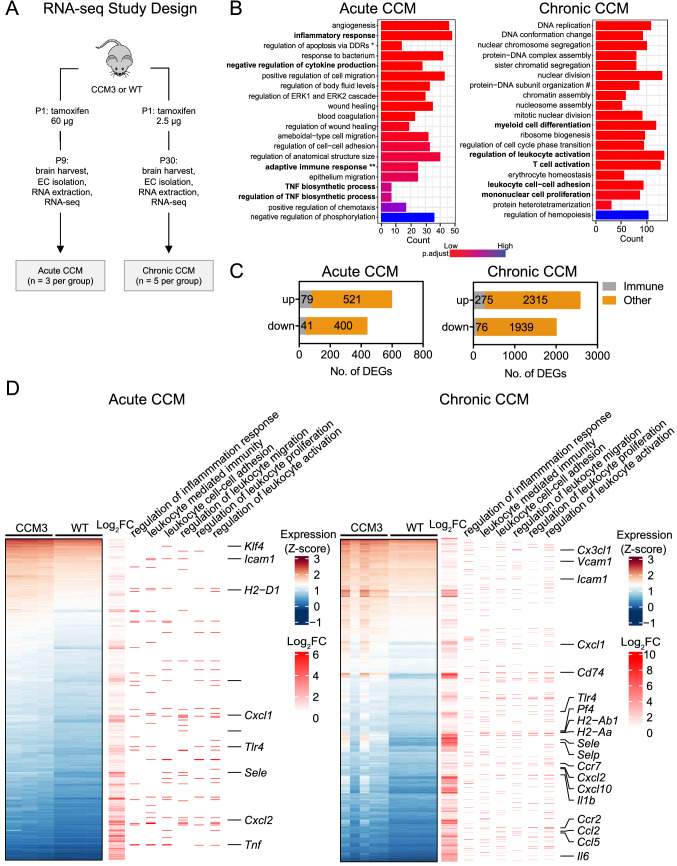
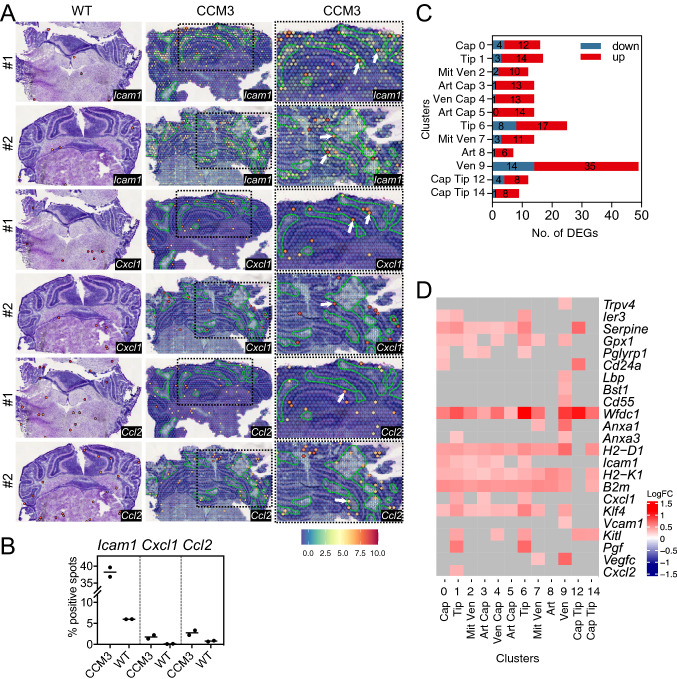
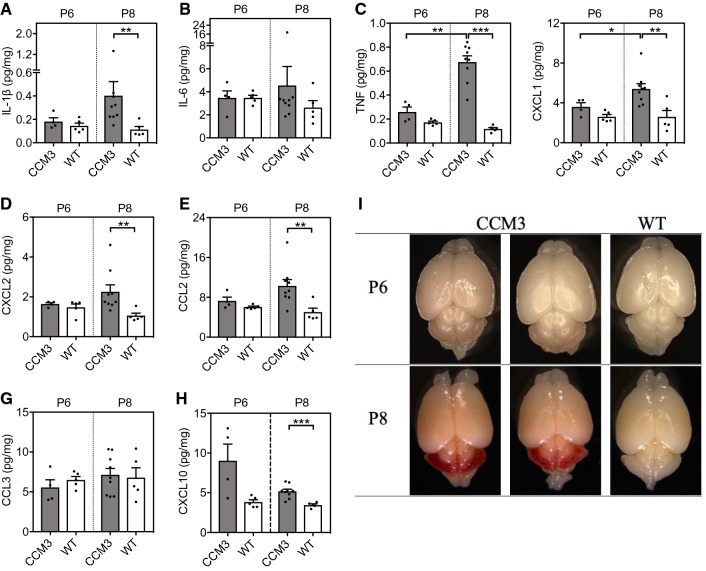
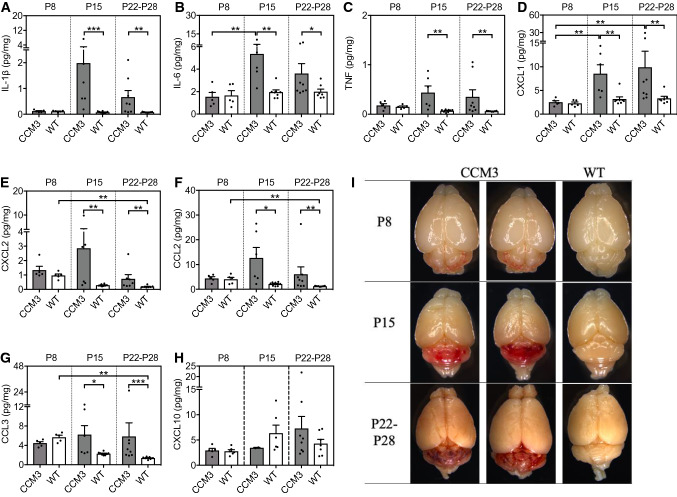
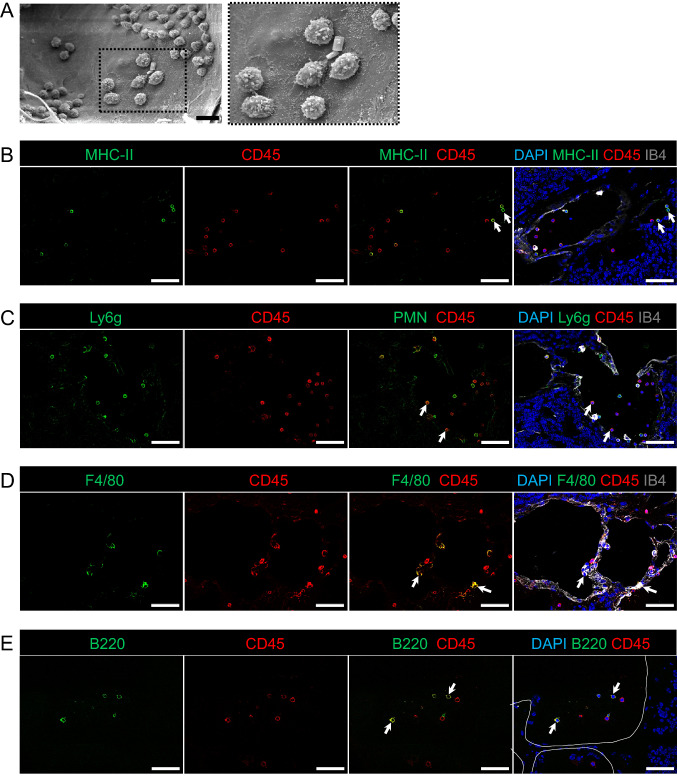
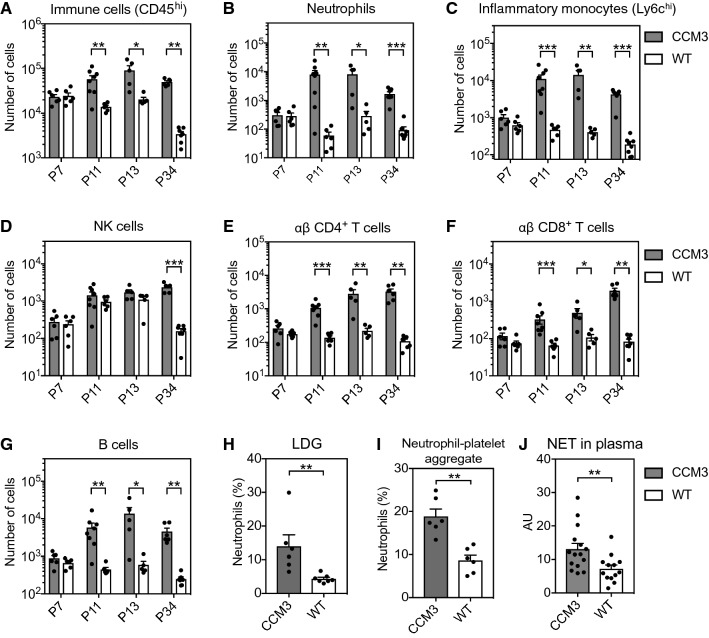
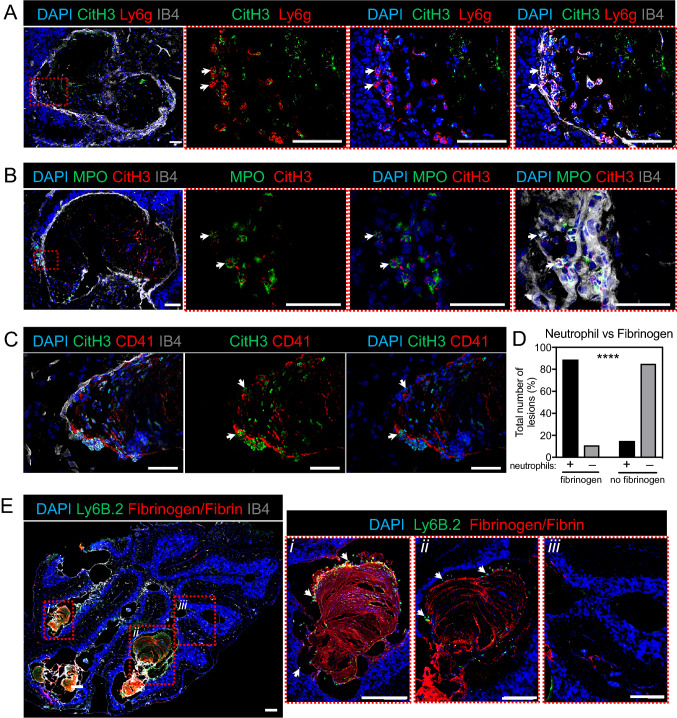
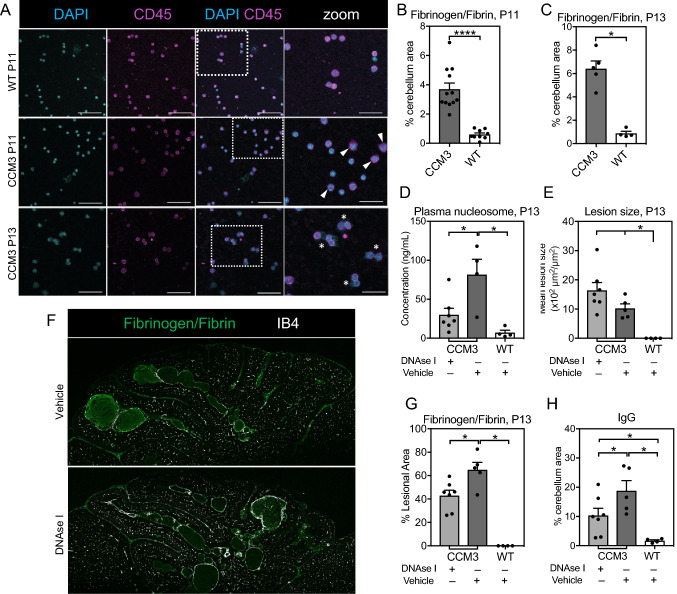
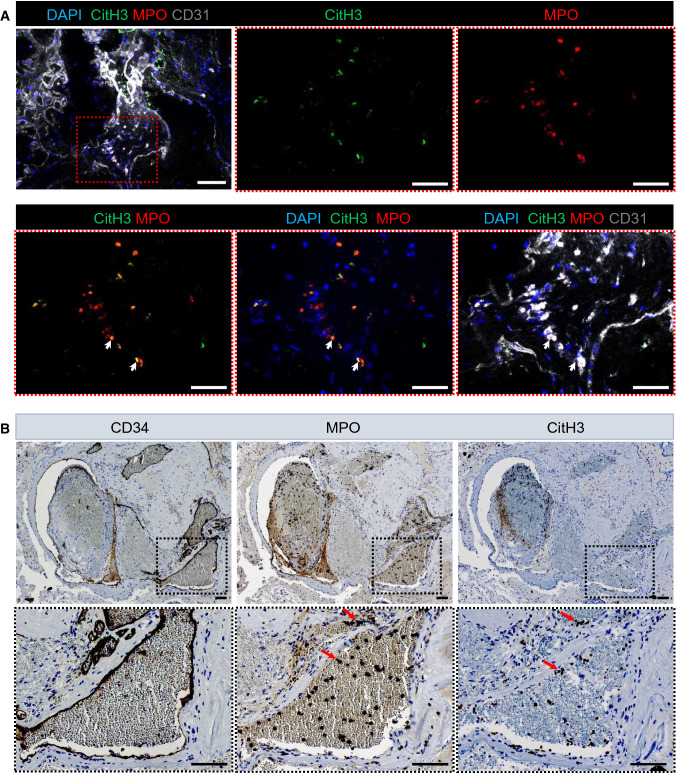
Cerebral Cavernous Malformation (CCM) is a brain vascular disease with various neurological symptoms. In this study, we describe the inflammatory profile in CCM and show for the first time the formation of neutrophil extracellular traps (NETs) in rodents and humans with CCM. Through RNA-seq analysis of cerebellum endothelial cells from wild-type mice and mice with an endothelial cell-specific ablation of the Ccm3 gene (Ccm3iECKO), we show that endothelial cells from Ccm3iECKO mice have an increased expression of inflammation-related genes. These genes encode proinflammatory cytokines and chemokines, as well as adhesion molecules, which promote recruitment of inflammatory and immune cells. Similarly, immunoassays showed elevated levels of these cytokines and chemokines in the cerebellum of the Ccm3iECKO mice. Consistently, both flow cytometry and immunofluorescence analysis showed infiltration of different subsets of leukocytes into the CCM lesions. Neutrophils, which are known to fight against infection through different strategies, including the formation of NETs, represented the leukocyte subset within the most pronounced increase in CCM. Here, we detected elevated levels of NETs in the blood and the deposition of NETs in the cerebral cavernomas of Ccm3iECKO mice. Degradation of NETs by DNase I treatment improved the vascular barrier. The deposition of NETs in the cavernomas of patients with CCM confirms the clinical relevance of NETs in CCM.

Keywords: Cerebral cavernous malformations; Endothelial cells; Inflammation; Neutrophil extracellular traps.


Conflict of interest statement

The authors have no relevant financial or non-financial interests to disclose.

Figures

Fig. 1
Fig. 1
RNA-Seq analysis showed increased expression of inflammation-related genes in brain microvascular endothelial cells from Ccm3iECKO mice (CCM3) in acute and chronic CCM. A Schematic diagram of the experimental design of the transcriptomic study in acute and chronic CCM, comparing CCM3 mice and wild-type (WT) mice (n = 3 per group in acute CCM, n = 5 in chronic CCM). B RNA-Seq gene expression analysis of up-regulated genes showing the top 20 most enriched gene ontology (GO) terms in acute (left panel) and chronic (right panel) CCM. Immune-related GO terms are given in bold. *Regulation of extrinsic apoptotic signaling pathway via death domain receptors, **adaptive immune responses based on somatic recombination of immune receptors built from immunoglobulin superfamily domains, # protein-DNA complex subunit organisation. C Bar plots for the numbers of CCM-associated immune genes that were up-regulated or down-regulated (DEGs) in acute (left) and chronic (right) CCM. For definition of immune genes, see Methods. D Heatmap showing the expression levels (Z-score of regularized log (rlog)-transformed counts) of significantly up-regulated DEGs (padj < 0.05 & |log2foldchange|> 0.5; blue: low; red: high) in both acute (upper panel) and chronic (lower panel) models. The first annotation column to the right indicates differential expression in log2 fold changes (red: high; white: low). The second to seventh annotation columns indicates the DEGs associated with enriched immune-like GO terms (stated at the top of the figure) from over-representation analysis. Some of the genes labelled after annotation columns were discussed in the text
Fig. 2
Fig. 2
Spatial transcriptomics datashowed an increased expression of genes that encode proteins with chemoattractant and adhesion functions. By scRNA sequencing analysis venous/venous capillary endothelial cells showed the highest number of upregulated and downregulated CCM-associated immune genes. A Gene expression levels of Icam1, Cxcl1 and Ccl2 measured in Visium spatial transcriptomics data of Ccm3iECKO mice (CCM3) in acute CCM. All sequenced dots are shown, colour coded for expression: blue, low; red, high. Negative spot outlines are shown without fill colour for visualisation of underlying haematoxylin and eosin staining (dark, light violet). Both complete sections and magnified boxed areas are shown. Green lines, outline of CCM lesions. Arrows, examples of spots expressing the indicated genes that colocalised with, or were in close proximity to, the periphery of the cavernomas. B Plots showing proportions (%) of spots in the cerebellum expressing Icam1, Cxcl1 and Ccl2 measured in Visium spatial transcriptomics data, as shown in A (n = 2 per group). C Numbers of CCM-associated immune genes (Fig. 1C, see method) by scRNA sequencing analysis (scRNA-seq) that were up-(red) or down-(blue) regulated (padj < 0.05) in each endothelial cell subtype of Ccm3iECKO mice in acute CCM [21]. D Heatmap showing log fold expression changes of immune response associated genes identified from bulk RNA-seq (Fig. 1D, gene annotation column) in each cell type of scRNA-seq data [21]. Only immune response genes that differed in gene expression between Ccm3iECKO and wild-type (WT) control mice in at least one endothelial cell subtype are shown here. C–D The identify of each endothelial cell subtype cluster (C) is as follows: Cap capillary (C0), Tip tip cells (C1, C6), Mit Ven mitotic/venous capillary (C2, C7), Art Cap arterial capillary (C3, C5), Ven Cap venous capillary (C4), Art arterial (C8), Ven venous/venous capillary (C9), Cap Tip capillary/tip cells (C12, C14)
Fig. 3
Fig. 3
Proinflammatory cytokines and chemokines mainly associated with recruitment of neutrophils and monocytes were elevated in the cerebellum of Ccm3iECKO mice (CCM3) compared with wild-type controls (WT) during acute CCM. The following cytokines and chemokines are shown: IL-1β (A), IL-6 (B), TNF (C), CXCL1/KC/GRO (D), CXCL2/MIP-2 (E), CCL2/MCP-1 (F), CCL3/MIP-1α (G) and CXCL10/IP-10 (H), at P6 (n = 4–5 per group) and P8 (n = 5–9 per group). I Representative images of the whole brain at P6 and P8. *P < 0.05; **P < 0.01; ***P < 0.001, for comparisons between groups (Mann–Whitney U tests)
Fig. 4
Fig. 4
Proinflammatory cytokines and chemokines mainly associated with recruitment of neutrophils and monocytes were elevated in the cerebellum of Ccm3iECKO mice (CCM3) compared with wild-type controls (WT) during chronic CCM. The following cytokines and chemokines are shown: IL-1β (A), IL-6 (B), TNF (C), CXCL1/KC/GRO (D), CXCL2/MIP-2 (E), CCL2/MCP-1 (F), CCL3/MIP-1α (G) and CXCL10/IP-10 (H), at P8 (n = 5–6 per group), P15 (n = 6–8 per group) and P22-P28 (n = 7–8 per group). I Representative images of the whole brain at P8, P15 and P22-28. *P < 0.05; **P < 0.01; ***P < 0.001 for comparisons between groups. Mann–Whitney U tests were used to determine statistically significant differences in the levels of cytokines and chemokines between Ccm3iECKO and WT mice. Kruskal–Wallis test ANOVA with Dunn’s multiple comparisons test were used to determine statistically significant differences in the levels of cytokines and chemokines between different time points in Ccm3iECKO mice
Fig. 5
Fig. 5
Representative scanning electron microscopy and immunofluorescence showed recruitment of different immune cell subsets at CCM lesions in the cerebellum of the Ccm3iECKO mice at P28 for chronic CCM. A Leukocytes are attached to the endothelial cells of CCM lesions in chronic CCM. B-E Cerebellum in Ccm3iECKO mice at P28 in chronic CCM. DAPI staining (blue), together with: (B) MHC class II (green), CD45 (red) and isolectin-B4 (white); (C) Ly6g+ (green), CD45 (red) and isolectin-B4 (white); (D) F4/80 (green), CD45 (red) and isolectin-B4 (white); and (E) CD45R/B220 (red) and CD45 (white). White line in (E) shows the location of the lesions in the cerebellum; white arrows, examples of the immune cell subsets that are positive for both DAPI and CD45. Scale bars: 10 μm (A); 50 μm (B–E)
Fig. 6
Fig. 6
Flow cytometry analysis showed that different leukocyte subsets were elevated in cell numbers in the cerebellum of Ccm3iECKO mice (CCM3) compared with wild-type controls (WT) during chronic CCM. Activated neutrophils, neutrophil–platelet aggregates and NET levels were elevated in circulation in Ccm3iECKO mice (CCM3) compared with wild-type controls (WT) during chronic CCM. The following are shown: immune cells (CD45hi) (A), neutrophils (CD45hiCD11b+Ly6g+) (B), inflammatory monocytes (CD45hiCD11b+Ly6g+Ly6chi) (C), natural killer (NK) cells (CD45hiCD11bCD19NK1.1+CD3) (D), CD4 T cells (CD45hiCD11bCD19NK1.1γδΔTCRCD3+CD4+) (E), CD8 T cells (CD45hiCD11bCD19NK1.1 γδTCRCD3+CD4) (F) and B cells (CD45hiCD11bCD19+NK1.1) (G), at P7 (n = 6 per group), P11 (n = 6–8 per group), P13 (n = 5 per group) and P34 (n = 7–8 per group). Low-density granulocytes (LDG) (H), and neutrophil–platelet aggregates (I) as a proportion (%) of circulating neutrophils (CD45+CD11b+Ly6cloLy6g+) in wild-type controls and Ccm3iECKO mice (n = 6–7 per group) during chronic CCM at P13. J Neutrophil extracellular traps (NETs) in wild-type controls and Ccm3iECKO mice (n = 13–15 per group) during chronic CCM, at P15, expressed as arbitrary units (AU). *P < 0.05; **P < 0.01; ***P < 0.001 for comparisons between groups (Mann–Whitney U tests)
Fig. 7
Fig. 7
Characterisation of neutrophils and neutrophil extracellular traps (NETs) in the cerebellum at P15 during chronic CCM. A–D Representative immunofluorescence for deposition of NETs in Ccm3iECKO mice during chronic CCM, at P15. A Citrullinated histone H3 (green), Ly6g (red), DAPI (blue) and isolectin B4 (grey). B MPO (green), citrullinated histone H3 (red), DAPI (blue) and isolectin B4 (grey). C Citrullinated histone H3 (green), CD41 (red), DAPI (blue) and isolectin B4 (grey). D Proportions (%) of lesions with (left) or without (right) fibrinogen/fibrin signals that attract (black bar) or do not attract (grey bar) neutrophils. Total number of lesions analysed, 79 (in 4 mice). ****P < 0.0001, for cavernoma without and with fibrinogen/fibrin signals (Fisher’s exact tests). E Anti-Ly-6B.2 (green), fibrinogen/fibrin (red), DAPI (blue) and isolectin B4 (grey). White arrows: NETs (AC); neutrophils (E). Scale bars: 50 μm (AC); 200 μm (E)
Fig. 8
Fig. 8
Neutrophil extracellular traps (NETs) and coagulation in the cerebellum and the circulation in Ccm3iECKO mice (CCM3) and wild-type controls (WT) at an earlier stage of chronic CCM. Roles of NETs in CCM. A Representative staining of circulating cells for DAPI and CD45 from WT (top row) and CCM3 (middle and bottom row) mice at P11 by cytospin technique. Triangles indicate activated neutrophils with increased size but have not yet undergone NETosis. Asterisk indicate neutrophils that have released their DNA. Scale bars of DAPI, CD45 and merge panels are 50 μm. Scale bars of zoom panels are 25 μm. B–C Percentage of cerebellum area positive for fibrinogen/fibrin at P11 (n = 9–12 per group) (B), and P13 (n = 4–5 per group) (C) in chronic CCM. D–H Effects of DNase I in vivo treatment in chronic CCM regarding the following: (D) Levels of plasma nucleosomes, (E) Size of CCM lesions, (G) Area of lesions positive for fibrinogen/fibrin, and (H) percentage of non-lesional area of cerebellum positive for IgG, at P13. n = 4–7 per group. F Representative immunofluorescence image showed the staining of fibrinogen/fibrin (green) and isolectin B4 (white) in the cerebellum at P13 for chronic CCM. *P < 0.05; **P < 0.01; ***P < 0.001 for comparisons between groups (Mann–Whitney U tests)
Fig. 9
Fig. 9
Deposition of neutrophil extracellular traps (NETs) in cavernoma in patients with CCM. A Representative immunofluorescence for citrullinated histone H3 (green), MPO (red), DAPI (blue) and CD31 (grey). B Representative haematoxylin and eosin staining of brain sections for CD34, MPO and citrullinated histone H3. Scale bars: 100 μm AB

References

    1. Zabramski JM, Wascher TM, Spetzler RF, et al. The natural history of familial cavernous malformations: results of an ongoing study. J Neurosurg. 1994;80:422–432. doi: 10.3171/jns.1994.80.3.0422. - DOI - PubMed
    1. Lanfranconi S, Scola E, Bertani GA, et al. Propranolol for familial cerebral cavernous malformation (Treat_CCM): Study protocol for a randomized controlled pilot trial. Trials. 2020;21:1–10. doi: 10.1186/s13063-020-4202-x. - DOI - PMC - PubMed
    1. Apra C, Dumot C, Bourdillon P, Pelissou-Guyotat I. Could propranolol be beneficial in adult cerebral cavernous malformations? Neurosurg Rev. 2019;42:403–408. doi: 10.1007/s10143-018-01074-0. - DOI - PubMed
    1. Goldstein HE, Solomon RA. Epidemiology of cavernous malformations. 1. Amsterdam: Elsevier B.V; 2017. - PubMed
    1. Gault J, Shenkar R, Recksiek P, Awad IA. Biallelic somatic and germ line CCM1 truncating mutations in a cerebral cavernous malformation lesion. Stroke. 2005;36:872–874. doi: 10.1161/01.STR.0000157586.20479.fd. - DOI - PubMed

MeSH terms

Substances