. 2022 Apr 12;17(4):936-952.
doi: 10.1016/j.stemcr.2022.02.017. Epub 2022 Mar 24.

Transcriptional profiling of β-2M-SPα-6+THY1+ spermatogonial stem cells in human spermatogenesis

Affiliations

Transcriptional profiling of β-2M-SPα-6+THY1+ spermatogonial stem cells in human spermatogenesis

Maelle Givelet et al. Stem Cell Reports. .

Abstract

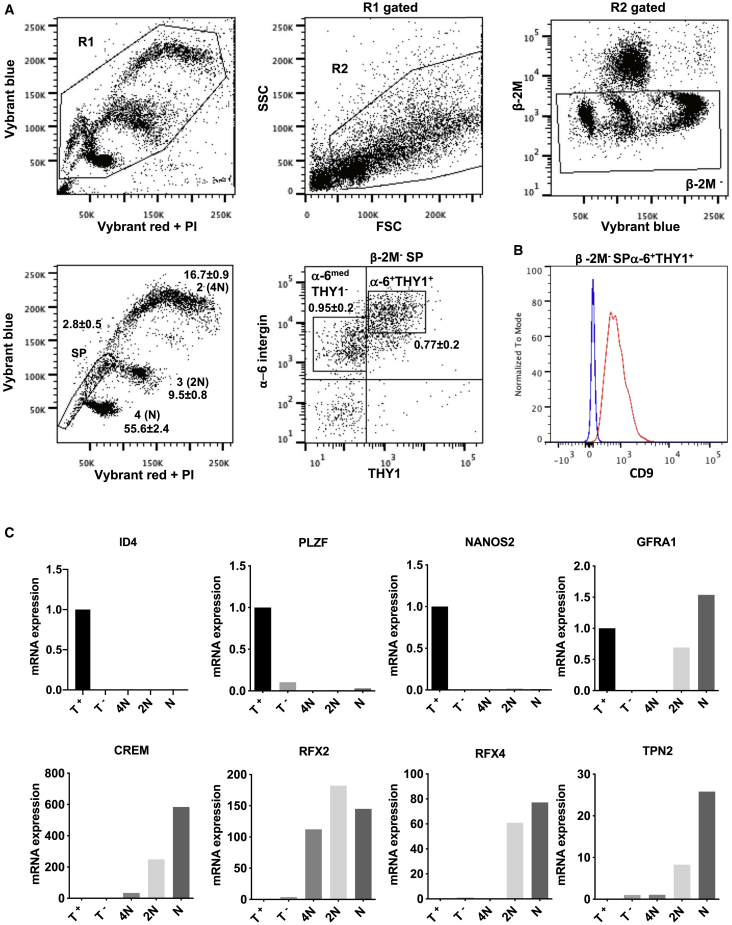
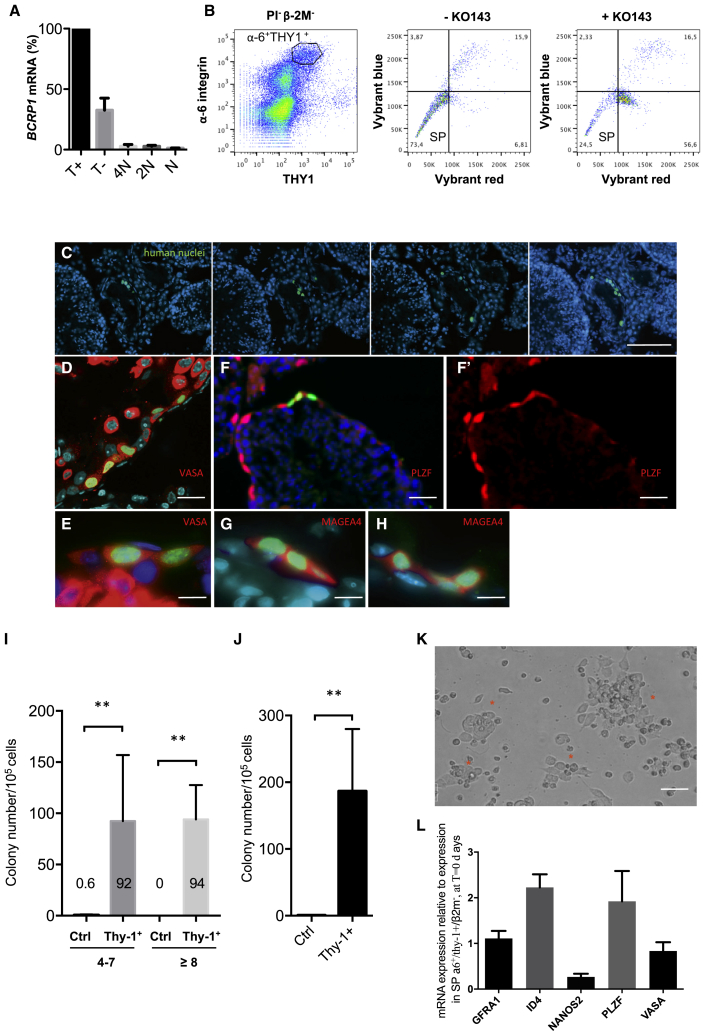
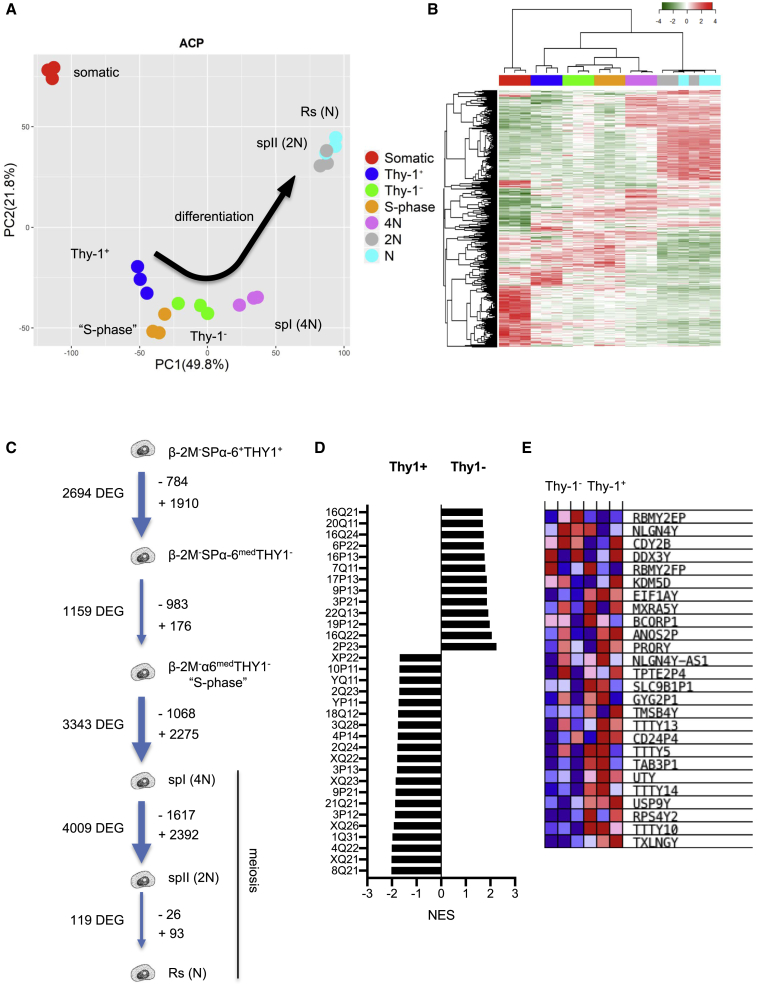
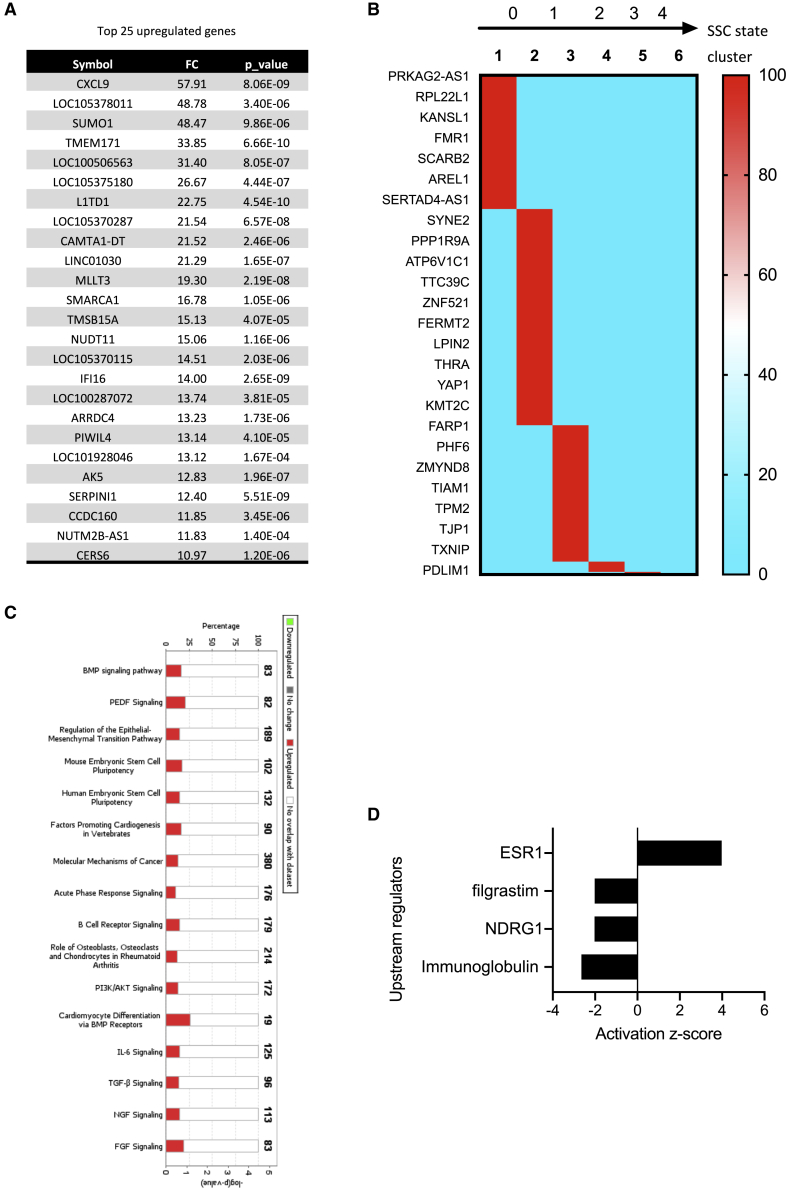
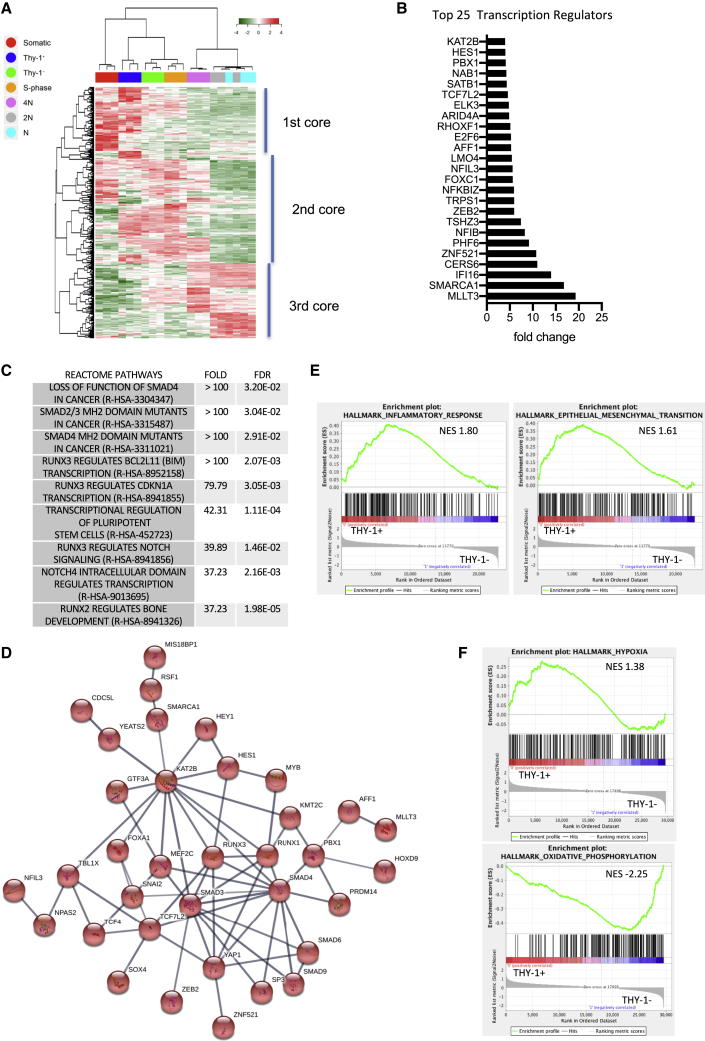
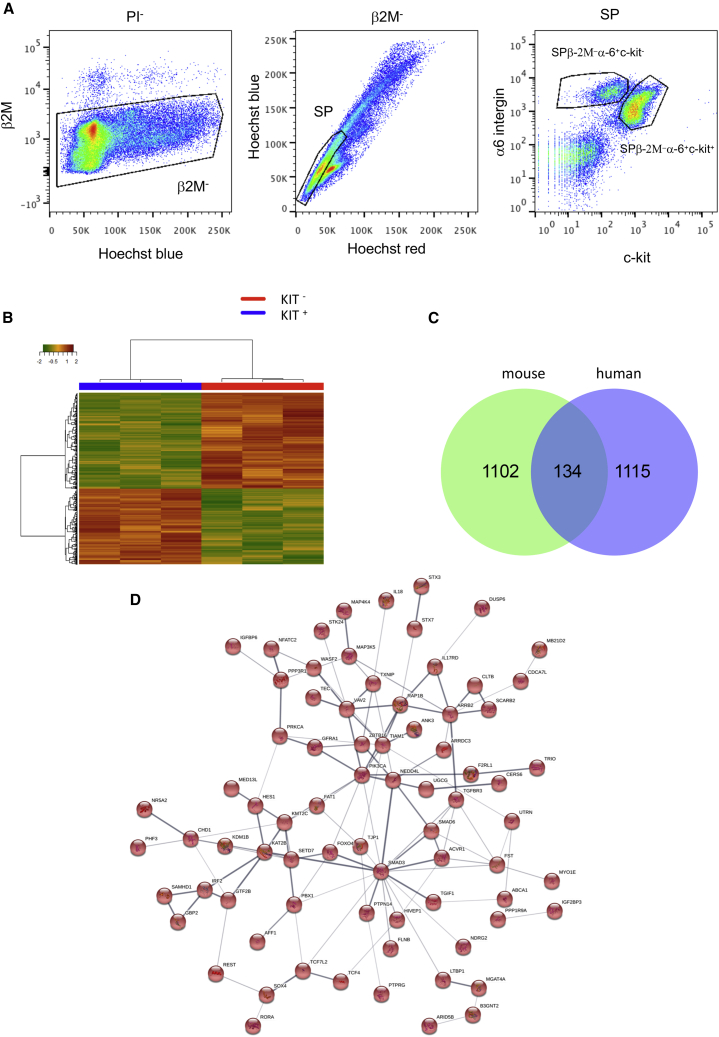
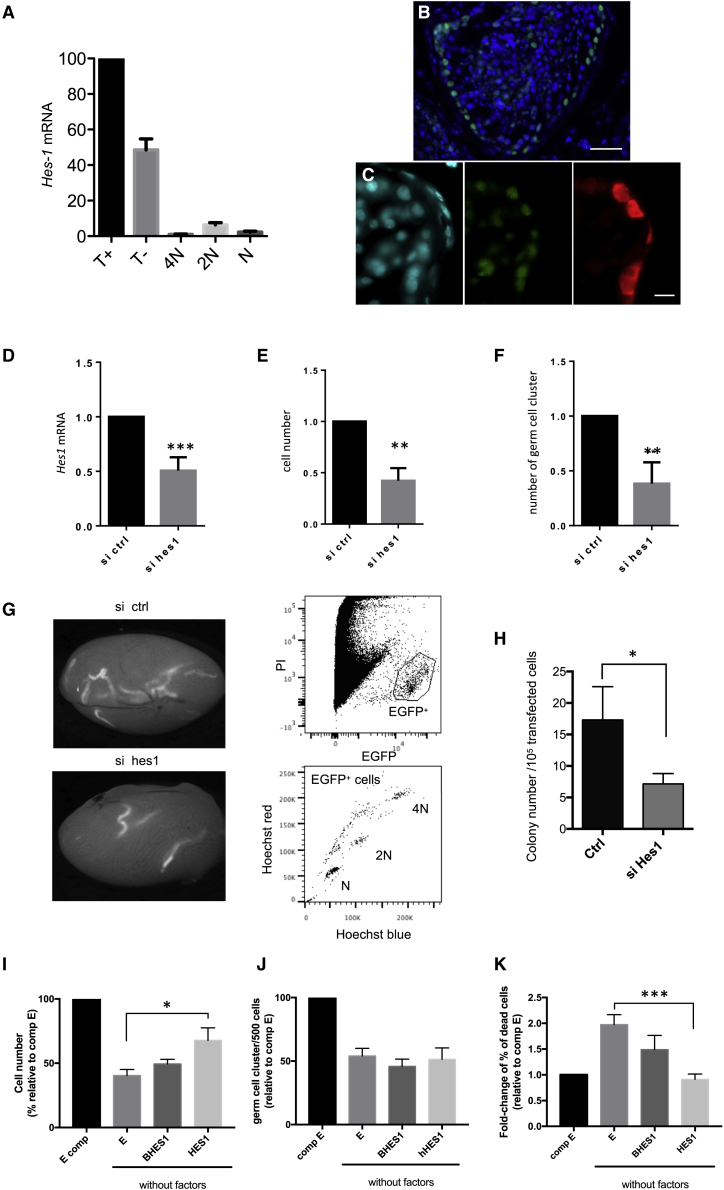
Male infertility is responsible for approximately half of all cases of reproductive issues. Spermatogenesis originates in a small pool of spermatogonial stem cells (SSCs), which are of interest for therapy of infertility but remain not well defined in humans. Using multiparametric analysis of the side population (SP) phenotype and the α-6 integrin, THY1, and β-2 microglobulin cell markers, we identified a population of human primitive undifferentiated spermatogonia with the phenotype β-2 microglobulin (β-2M)-SPα-6+THY1+, which is highly enriched in stem cells. By analyzing the expression signatures of this SSC-enriched population along with other germinal progenitors, we established an exhaustive transcriptome of human spermatogenesis. Transcriptome profiling of the human β-2M-SPα-6+THY1+ population and comparison with the profile of mouse undifferentiated spermatogonia provide insights into the molecular networks and key transcriptional regulators regulating human SSCs, including the basic-helix-loop-helix (bHLH) transcriptional repressor HES1, which we show to be implicated in maintenance of SSCs in vitro.

Keywords: human; spermatogenesis; stem cell; transcriptome.


Figures

Figure 1
Figure 1
Characterization of the different steps of human spermatogenesis (A) Characterization of the different steps of human spermatogenesis by flow cytometry according to the forward scatter (FSC), side scatter (SSC), blue and red Vybrant fluorescence, β-2M, α-6 integrin, and THY1 parameters as well as side population (SP) and meiotic and postmeiotic subpopulations 2 (4N), 3 (2N), and 4 (N). The frequency (percentage) of the subpopulations in the whole β-2M population is indicated (mean ± SEM, n = 5). (B) CD9 expression in the β-2M SPα-6+ THY1+ population (red line). The control (blue line) corresponds to the signal in CD9/low-expressing postmeiotic round spermatids. (C) Analysis by qRT-PCR of the expression of different spermatogonial (ID4, NANOS2, PLZF, and GFRA1) and meiotic (CREM, RFX2, RFX4, and TNP2) markers in meiotic and postmeiotic subpopulations 2 (4N), 3 (2N), and 4 (N) and the spermatogonial β-2MSPα-6+THY1+ (T+) and β-2MSPα-6medTHY1 (T) populations
Figure 2
Figure 2
The SP phenotype is BCRP1/ABCG2 dependent, and the β-2MSPα-6+THY1+ (T+) population possesses SSC potential (A) The BCRP1/ABCG2 gene is expressed in the T+ subpopulation. Analysis by qRT-PCR of the expression of BCRP1 in T+, T, spermatocyte I (4N), spermatocyte II (2N), and spermatid (N) populations (n = 3 experiments). (B) Ko-143 inhibits the SP phenotype in the T+ subpopulation. The frequencies of the populations are indicated. (C) Serial sections of testes obtained from NSG mice 2 months after transplantation with T+ cells. Human cells (green, antibody specific to human nuclei) observed at the murine basement membrane on successive sections indicate human colonizing cell clusters. (D and E) VASA (red) expression in human cells (green nuclei) from colonizing cell clusters. (F and F’) PLZF expression in human cells (green, human nuclei; red, PLZF) from colonizing cell clusters. (G and H) MAGE-4 expression in human cells (green, human nuclei; red, MAGEA-4 Blue indicates 4′,6-diamidino-2-phenylindole (DAPI) from colonizing cell clusters. (I) Comparison of the colonization efficiency of recipient testes transplanted with T+ cells or control β-2Mnot(SPα-6+ THY1+) cells. Human colonizing cell clusters were separated in two groups according to their size: one group composed of cluster of 4–7 cells and the other of cluster of 8 or more cells (control, n = 4 recipient testes; THY1+, n = 5 recipient testes; transplantations from five human donors). (J) The total number of cell clusters generated per 105 cells injected (control, n = 4 recipient testes; THY1+, n = 5 recipient testes; transplantations from five human donors). (K) Cell clusters observed in vitro after 14 days of culture starting with the T+ cell population. (L) Expression of markers of immature spermatogonia in cell clusters after 15 days of culture (n = 6 replicates from 2 independent cultures). Scale bars: 50 μm (C), 20 μm (D), 40 μm (F, F’, and K), and 10 μm (E, G, and H).
Figure 3
Figure 3
Differential expression of genes during human spermatogenesis (A) PCA of differentially expressed genes in human germinal populations throughout spermatogenesis and control somatic tissue (PC1–PC2 contributed to intersample variation, as shown in parentheses). (B) Heatmap of the gene expression of the differentiation stages during spermatogenesis and associated hierarchical clustering. (C) Schematic recapitulating the number of differentially expressed genes (DEGs) at transitions between the different differentiation stages. (D) GSEA of the expression profile signature at the transition of β-2MSPα-6+THY1+immature spermatogonia to more differentiated spermatogonia according to the chromosomal position of the genes (FDR < 0.03). (E) Heatmap of DEGs found in the Yq11 region.
Figure 4
Figure 4
Expression signature of the primitive spermatogonial T+ population enriched in SSCs (A) List of the top 25 DEGs. (B) Heatmap showing the distribution of the expression of genes of the T+ population according to the six gene clusters defining the states 0–4 in human adult SSC development as defined by Guo et al. (2018). (C) List of the top canonical pathways identified via an Ingenuity Pathway Analysis (IPA). (D) Putative upstream regulators identified using IPA.
Figure 5
Figure 5
Identification of TRs enriched in the primitive spermatogonial T+ population (A) Heatmap of TRs expressed during spermatogenesis and associated hierarchical clustering. (B) List of the top 25 differentially expressed TRs in the T+ population. (C) PANTHER enrichment analysis of the T+ set of TRs. (D) Network of 35 TRs identified using String analysis. (E and F) GSEA of the cell state transition between the T+ and T spermatogonial populations
Figure 6
Figure 6
Comparative analysis of DEGs in human and mouse populations of adult primitive spermatogonia (A) Flow cytometry analysis of mouse α-6+ testicular cells selected by magnetic activated cell sorting (MACS) based on blue and red Hoechst fluorescence and the markers β2M, α-6 integrin, and c-kit. The SPβ2Mα-6+c-kit and SPβ2Mα-6+c-kit+ populations are indicated. Cells were also selected on FSC parameters to exclude elongated spermatids. (B) Heatmap of the gene expression in the mouse undifferentiated SPβ-2Mα-6+c-kit and differentiated SPβ-2Mα-6+c-kit+ spermatogonial population and associated hierarchical clustering. (C) Venn diagram showing the relationships between the transcriptomes of human T+ and mouse β-2MSPα-6+c-kit spermatogonial populations. The number of genes in each group is indicated. (D) Network of 76 interacting genes using String analysis in the conserved set of genes between mouse and human models.
Figure 7
Figure 7
The transcription factor HES1 is involved in maintenance of murine SSCs (A) Analysis by qRT-PCR of the expression of HES1 in human T+, T, spermatocyte I (4N), spermatocyte II (2N), and spermatid (N) populations.(n = 3 experiments). (B and C) Immunofluorescent detection of HES1 in human testes. (B) HES1, green; DAPI, blue; scale bar, 40 μm. (C) HES1, green; MAGE4, red; DAPI, blue; scale bar, 10 μm. (D) Hes1 silencing in transfected SSCs using siRNA (n = 7 transfection experiments). (E) Analysis of the total number of germ cells (n = 10 colony tests from 7 transfection experiments). (F) Total number of germ cell clusters formed 7 days after transfection (n = 7 transfection experiments). (G) Analysis of regenerative spermatogenesis after transplantation of SSCs 7 days after transfection. Shown is detection of EGFP-fluorescent seminiferous tubules on macroscopic observation in recipient testes 2 months after transplantation in control (top) and Hes1 siRNA-treated (bottom), EGFP-expressing SSCs. Also shown is red/blue Hoechst 33342 fluorescence analysis of EGFP+ cells obtained from a recipient testis transplanted with Hes1 siRNA-treated, EGFP-expressing SSCs. Meiotic spermatocyte I (2N), spermatocyte II (4N), and postmeiotic (N) cells are indicated. (H) Colonization of recipient testes was lower in testes transplanted with culture of Hes1 siRNA-treated SSCs than in those transplanted with control siRNA-treated SSCs 7 days after transfection (n = 8 recipient testes from 6 transfection experiments). (I–K) The effects of enforced expression of human HES1 in cultures of SSCs exposed to growth factors and serum deprivation conditions (J) on total cell number (n = 4 experiments), frequency of in vitro cluster-initiating cells (n = 12 colony tests from 4 experiments), and (K) cell death (n = 4 experiments). HES1, ΔBHES1 (BHES1), and GFP control (E) cells were grown with growth factors under serum deprivation conditions (without factors) or complete medium (E comp).

References

    1. Allen J.D., van Loevezijn A., Lakhai J.M., van der Valk M., van Tellingen O., Reid G., Schellens J.H., Koomen G.J., Schinkel A.H. Potent and specific inhibition of the breast cancer resistance protein multidrug transporter in vitro and in mouse intestine by a novel analogue of fumitremorgin C. Mol. Cancer Ther. 2002;1:417–425. - PubMed
    1. Barroca V., Lassalle B., Coureuil M., Louis J.P., Le Page F., Testart J., Allemand I., Riou L., Fouchet P. Mouse differentiating spermatogonia can generate germinal stem cells in vivo. Nat. Cell Biol. 2009;11:190–196. - PubMed
    1. Bissig-Choisat B., Wang L., Legras X., Saha P.K., Chen L., Bell P., Pankowicz F.P., Hill M.C., Barzi M., Leyton C.K., et al. Development and rescue of human familial hypercholesterolaemia in a xenograft mouse model. Nat. Commun. 2015;6:7339. - PMC - PubMed
    1. Bleau A.M., Hambardzumyan D., Ozawa T., Fomchenko E.I., Huse J.T., Brennan C.W., Holland E.C. PTEN/PI3K/Akt pathway regulates the side population phenotype and ABCG2 activity in glioma tumor stem-like cells. Cell Stem Cell. 2009;4:226–235. - PMC - PubMed
    1. Brinster R.L. Male germline stem cells: from mice to men. Science. 2007;316:404–405. - PMC - PubMed

Publication types

Substances