Observational Study
. 2022 Apr:78:103957.
doi: 10.1016/j.ebiom.2022.103957. Epub 2022 Mar 22.

Immunoglobulin G1 Fc glycosylation as an early hallmark of severe COVID-19

Affiliations
Observational Study

Immunoglobulin G1 Fc glycosylation as an early hallmark of severe COVID-19

Tamas Pongracz et al. EBioMedicine. 2022 Apr.

Abstract

Background: Immunoglobulin G1 (IgG1) effector functions are impacted by the structure of fragment crystallizable (Fc) tail-linked N-glycans. Low fucosylation levels on severe acute respiratory syndrome coronavirus 2 (SARS-CoV-2) spike (S) protein-specific IgG1 has been described as a hallmark of severe coronavirus disease 2019 (COVID-19) and may lead to activation of macrophages via immune complexes thereby promoting inflammatory responses, altogether suggesting involvement of IgG1 Fc glycosylation modulated immune mechanisms in COVID-19.

Methods: In this prospective, observational single center cohort study, IgG1 Fc glycosylation was analyzed by liquid chromatography-mass spectrometry following affinity capturing from serial plasma samples of 159 SARS-CoV-2 infected hospitalized patients.

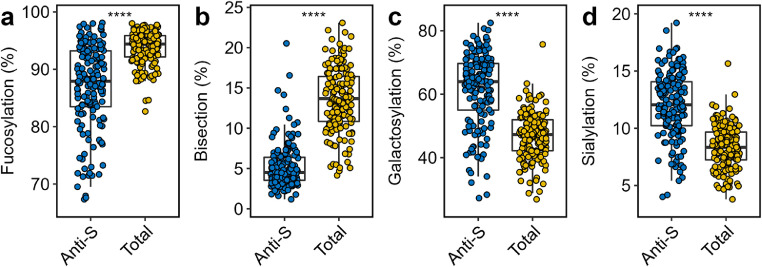
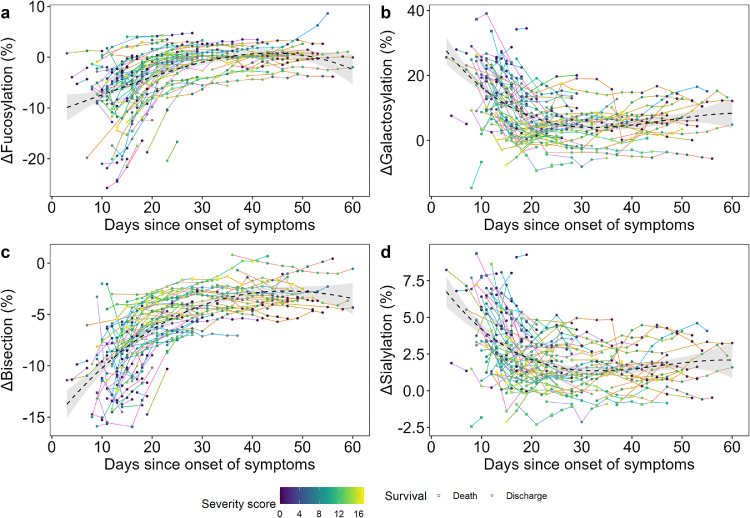
Findings: At baseline close to disease onset, anti-S IgG1 glycosylation was highly skewed when compared to total plasma IgG1. A rapid, general reduction in glycosylation skewing was observed during the disease course. Low anti-S IgG1 galactosylation and sialylation as well as high bisection were early hallmarks of disease severity, whilst high galactosylation and sialylation and low bisection were found in patients with low disease severity. In line with these observations, anti-S IgG1 glycosylation correlated with various inflammatory markers.

Interpretation: Association of low galactosylation, sialylation as well as high bisection with disease severity and inflammatory markers suggests that further studies are needed to understand how anti-S IgG1 glycosylation may contribute to disease mechanism and to evaluate its biomarker potential.

Funding: This project received funding from the European Commission's Horizon2020 research and innovation program for H2020-MSCA-ITN IMforFUTURE, under grant agreement number 721815, and supported by Crowdfunding Wake Up To Corona, organized by the Leiden University Fund.

Keywords: Anti-spike IgG; COVID-19; Coronavirus; IgG glycosylation; SARS-CoV-2.


Conflict of interest statement

Declaration of interests A. H. E. R received support from Crowdfunding Wake Up To Corona, organized by the Leiden University Fund, participated in grants or contracts with Diorapthe, Stichting apothekers and UNeedle, participated on a Data Safety Monitoring/Advisory Board of a multicenter Dutch clinical trial (Clinical trial (RCT) on convalescent plasma for treatment of immunocompromised patients with COVID-19) and has recently been appointed as member of the EMA scientific advisory group on vaccines (unpaid). The other authors declare that the research was conducted in the absence of any commercial or financial relationships that could be construed as a potential conflict of interest.

Figures

Fig 1
Figure 1
Comparison of anti-S (blue) and total (yellow) IgG1 Fc glycosylation. Relative abundance of IgG1 (a) fucosylation, (b) bisection, (c) galactosylation and (d) sialylation of anti-S and total IgG1 are given at hospitalization (n=159). Boxplots display the median and the interquartile range, whereas whiskers represent the first and third quartiles. A Wilcoxon signed-rank test was used to compare anti-S with total IgG1. ****: p-value < 0·0001. (For interpretation of the references to color in this figure legend, the reader is referred to the web version of this article.)
Fig 2
Figure 2
ΔGlycosylation dynamics until 60 days since symptom onset. The time course of Δglycosylation traits (a) fucosylation, (b) galactosylation, (c) bisection and (d) sialylation as shown during the hospitalization period (n=109). Line colors correspond to a single COVID-19 patient, whilst the color gradient in the circles/squares indicate the corresponding severity score (grey = NA). The shape displays whether a patient passed away (square) or was discharged alive (circle). The black dashed line with a grey 95% confidence interval band is a cubic polynomial fit over the shown datapoints to illustrate overall dynamics. Late timepoints and two outliers are shown in the Supplementary Material due to spatial constraints (Figs. S4 and S5), as well as anti-S and total IgG1 glycosylation dynamics (Figure S6).
Fig 3
Figure 3
Comparison of Δglycosylation traits of patients admitted to ICU (red) or non-ICU (blue) treatment. Shown in the facets are the relative levels of ΔIgG1 (a) fucosylation, (b) galactosylation, (c) bisection and (d) sialylation at the time of hospitalization (left; n=159; 77 ICU and 82 non-ICU patients, respectively) and at the time of highest disease severity (right; n=144; 75 ICU and 69 non-ICU patients, respectively). The highest severity timepoint has been defined for each patient as the earliest possible timepoint with highest severity score during hospitalization. A Wilcoxon rank-sum test was used to compare ICU and non- ICU patients (Table S6). *, ****: p-value < 0·05, 0·0001, respectively. Glycosylation dynamics of ICU and non-ICU patients between day 10 and 25 are shown in Figure S8 (For interpretation of the references to color in this figure legend, the reader is referred to the web version of this article.).
Fig 4
Figure 4
ROC curves and corresponding AUC values illustrating the power of certain ΔIgG1 glycosylation traits to predict ICU admission at time of hospitalization.
Fig 5
Figure 5
Comparison of Δglycosylation of patients in different severity score groups. Shown in the facets are the relative levels of ΔIgG1 (a) fucosylation, (b) galactosylation, (c) bisection and (d) sialylation at the time of hospitalization (left; n=142; 64 low severity, 32 intermediate severity and 46 high severity patients, respectively) and at the time of highest disease severity (right; n=144 n=144; 61 low severity, 24 intermediate severity and 59 high severity patients, respectively). Color indicates ICU (red) and non-ICU (blue) patients. A Wilcoxon rank-sum test was used to compare the different severity score groups (Table S7). *, **, ****: p-value < 0·05, 0·01, 0·0001, respectively (For interpretation of the references to color in this figure legend, the reader is referred to the web version of this article.).
Fig 6
Figure 6
Heatmap visualizing Spearman's correlations between Δglycosylation traits and inflammatory markers at time of hospitalization (left side of each panel; n=58) and at time of highest disease severity (right side of each panel; n=59). Asterisk (*) indicates a significant Spearman's correlation (p-value < 0.05).

Similar articles

Cited by

References

    1. Zhou P., Yang X.L., Wang X.G., et al. A pneumonia outbreak associated with a new Coronavirus of probable bat origin. Nature. 2020;579(7798):270–273. - PMC - PubMed
    1. Dong E., Du H., Gardner L. An interactive web-based dashboard to track COVID-19 in real time. Lancet Infect Dis. 2020;20(5):533–534. - PMC - PubMed
    1. Oran D.P., Topol E.J. Prevalence of Asymptomatic SARS-CoV-2 Infection: a narrative review. Ann Intern Med. 2020;173(5):362–367. - PMC - PubMed
    1. Long Q.X., Liu B.Z., Deng H.J., et al. Antibody responses to SARS-CoV-2 in patients with COVID-19. Nat Med. 2020;26(6):845–848. - PubMed
    1. Hu B., Guo H., Zhou P., Shi Z.L. Characteristics of SARS-CoV-2 and COVID-19. Nat Rev Microbiol. 2021;19(3):141–154. - PMC - PubMed

Publication types