. 2022 Apr:78:103954.
doi: 10.1016/j.ebiom.2022.103954. Epub 2022 Mar 22.

Sodium thiosulfate acts as a hydrogen sulfide mimetic to prevent intimal hyperplasia via inhibition of tubulin polymerisation

Affiliations

Sodium thiosulfate acts as a hydrogen sulfide mimetic to prevent intimal hyperplasia via inhibition of tubulin polymerisation

Diane Macabrey et al. EBioMedicine. 2022 Apr.

Abstract

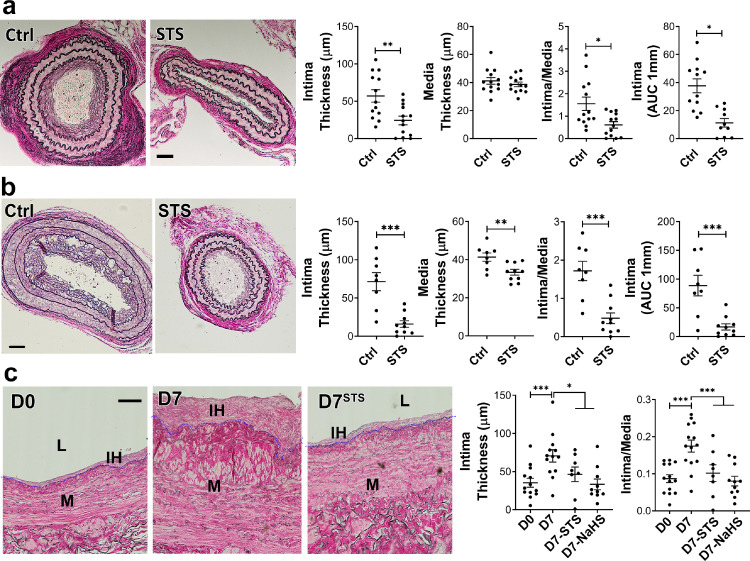
Background: Intimal hyperplasia (IH) remains a major limitation in the long-term success of any type of revascularisation. IH is due to vascular smooth muscle cell (VSMC) dedifferentiation, proliferation and migration. The gasotransmitter Hydrogen Sulfide (H2S), mainly produced in blood vessels by the enzyme cystathionine- γ-lyase (CSE), inhibits IH in pre-clinical models. However, there is currently no H2S donor available to treat patients. Here we used sodium thiosulfate (STS), a clinically-approved source of sulfur, to limit IH.

Methods: Low density lipoprotein receptor deleted (LDLR-/-), WT or Cse-deleted (Cse-/-) male mice randomly treated with 4 g/L STS in the water bottle were submitted to focal carotid artery stenosis to induce IH. Human vein segments were maintained in culture for 7 days to induce IH. Further in vitro studies were conducted in primary human vascular smooth muscle cells (VSMCs).

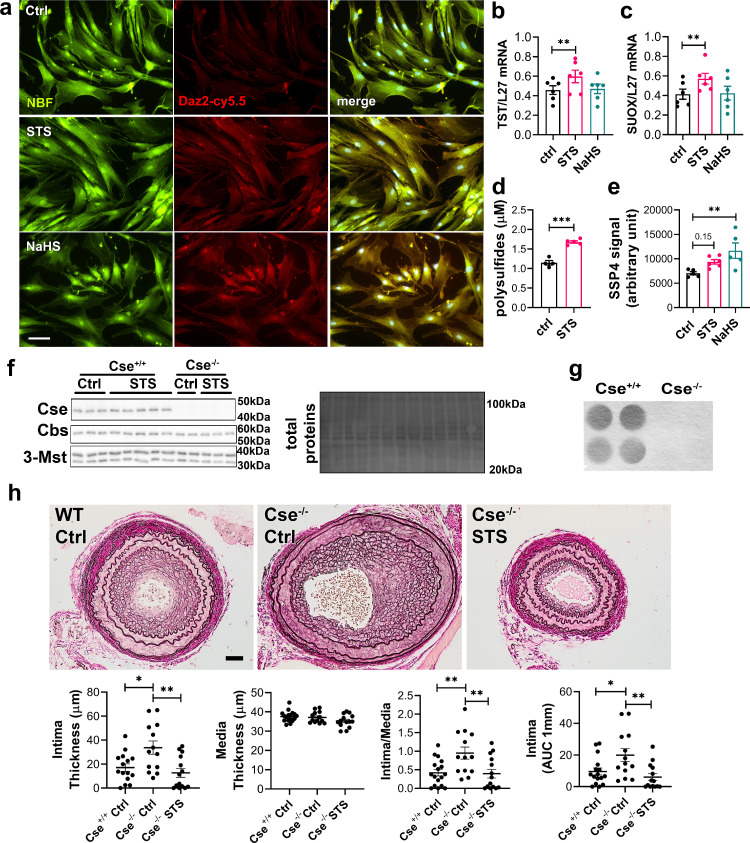
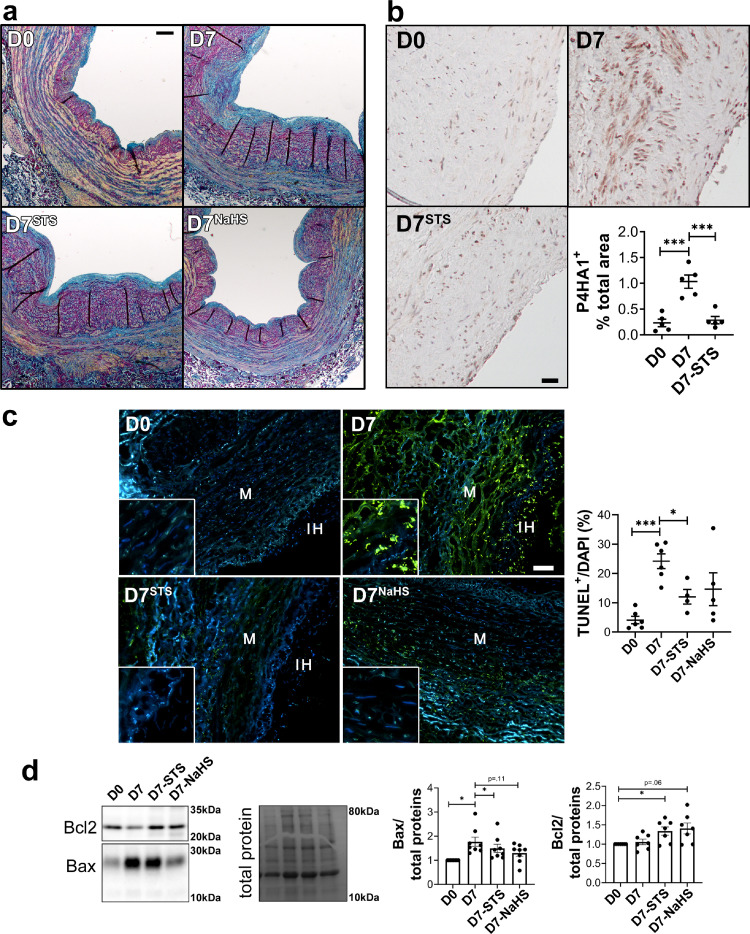
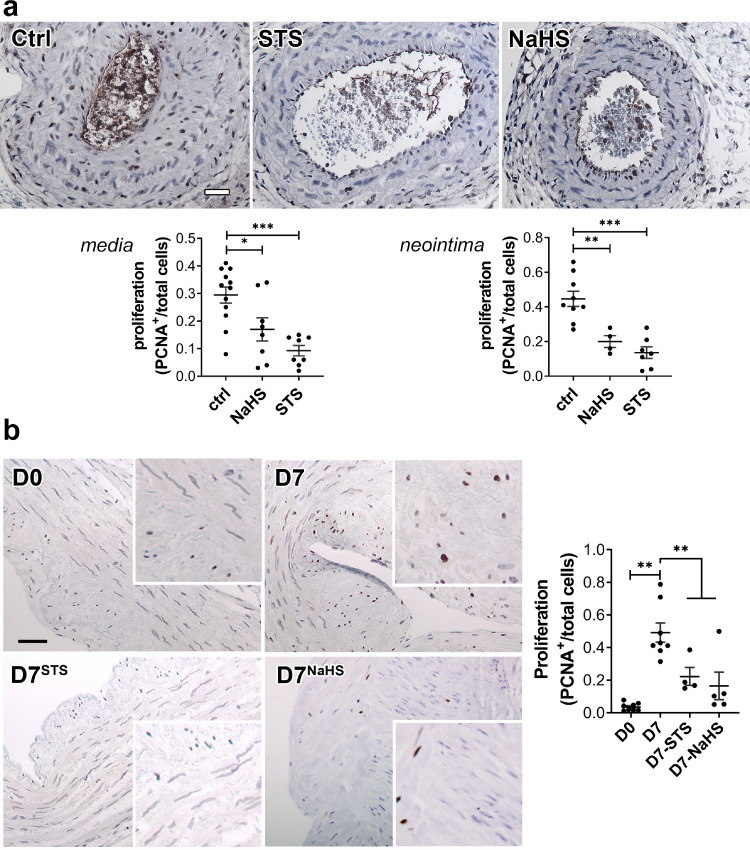
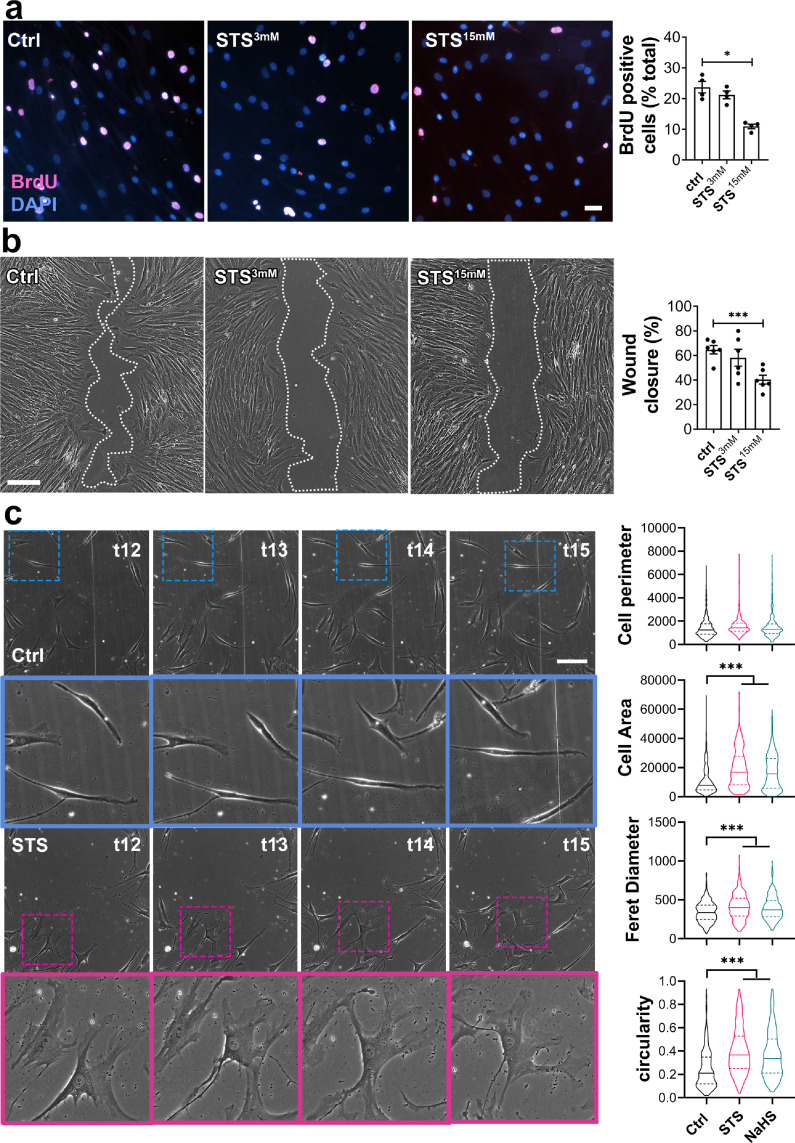
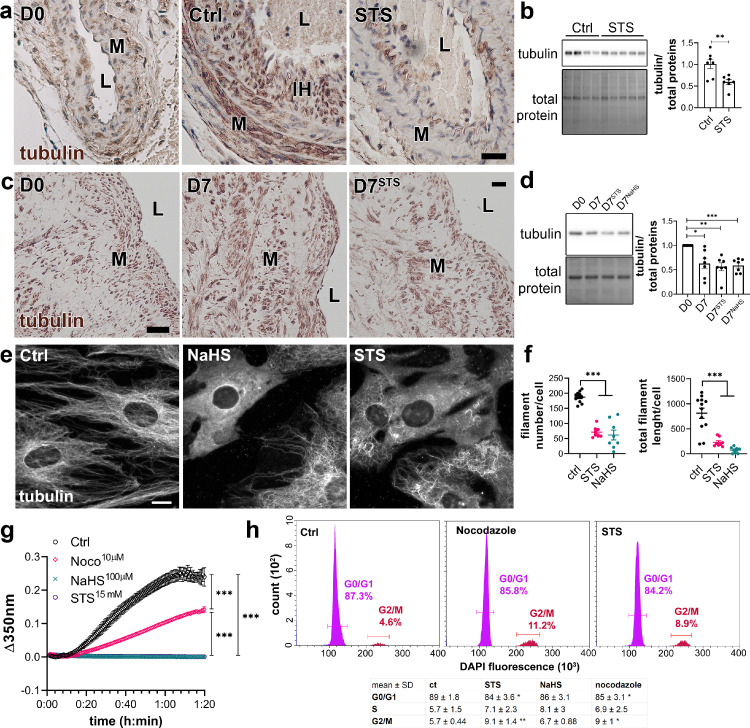
Findings: STS inhibited IH in WT mice, as well as in LDLR-/- and Cse-/- mice, and in human vein segments. STS inhibited cell proliferation in the carotid artery wall and in human vein segments. STS increased polysulfides in vivo and protein persulfidation in vitro, which correlated with microtubule depolymerisation, cell cycle arrest and reduced VSMC migration and proliferation.

Interpretation: STS, a drug used for the treatment of cyanide poisoning and calciphylaxis, protects against IH in a mouse model of arterial restenosis and in human vein segments. STS acts as an H2S donor to limit VSMC migration and proliferation via microtubule depolymerisation.

Funding: This work was supported by the Swiss National Science Foundation (grant FN-310030_176158 to FA and SD and PZ00P3-185927 to AL); the Novartis Foundation to FA; and the Union des Sociétés Suisses des Maladies Vasculaires to SD, and the Fondation pour la recherche en chirurgie vasculaire et thoracique.

Keywords: Hydrogen sulfide; Intimal hyperplasia; Proliferation; Smooth muscle cells; Sodium thiosulfate.


Conflict of interest statement

Declaration of interests The authors declare no competing interests.

Figures

Figure 1
Figure 1
STS decrease IH formation after carotid artery stenosis in mice and in cultured human saphenous veins. a, b) WT (a) or LDLR−/− mice (b) treated or not (ctrl) with 4 g/L STS were subjected to the carotid artery stenosis surgery. VGEL staining of left carotid cross sections and morphometric measurements of intima thickness, media thickness, intima over media ratio and intima thickness AUC. Scale bar 40 µm. Data are mean±SEM of 13 (c) and 8 (b) animals per group. *p < .05, **p < .01, ***p < .001 as determined by bilateral unpaired t-test. c) Intima thickness, media thickness and intima over media ratio of freshly isolated human vein segments (D0) or after 7 days (D7) in static culture with STS (15 mM) or NaHS (100 µm). Scale bar 60 µm. Data are mean ± SEM of 12 different veins/patients. *p < .05, **p < .01, ***p < .001, as determined by repeated measures one-way ANOVA with Dunnett's multiple comparisons.
Figure 2
Figure 2
STS increases protein persulfidation. (a) In situ labelling of intracellular protein persulfidation assessed by DAz-2:Cy5.5 (red), normalized to NBF-adducts fluorescence (green), in VSMCs exposed for 4 h to NaHS (100 µm) or STS (15 mM). Representative images of 5 independent experiments. Scale bar 20 μM. b, c) Human TST and SUOX mRNA levels in VSMCs treated or not (Ctrl) for 24 h with NaHS (100 µm) or STS (15 mM). (d) Plasma polysulfides levels, as measured by the SSP4 probe, in mice treated 7 days with STS 4 g/L. Data are scatter plots with mean ± SEM of 4 animals per group. ***p < .001 as determined by bilateral unpaired t-test. (e) Polysulfides levels, as measured by the SSP4 probe in liver extracts of mice treated 7 days with STS 4 g/L or NaHS 0.5 g/L. Data are scatter plots with mean ± SEM of 5 animals per group. **p < .01 as determined by One-way ANOVA with post-hoc t-tests with Tukey's correction for multiple comparisons. (f) Western blot analysis of Cse, Cbs and 3-Mst in Cse−/− and Cse+/+ mice, treated or not with STS 4 g/L for 4 weeks (3 to 5 animals per group). (g) Led acetate assay to measure Cse-mediated H2S production in Cse−/− and Cse+/+ mice. Data are representative of 4 animals per group. (h) Intima thickness, media thickness, intima over media ratio and intima thickness AUC of CAS operated mice measured 28 days after surgery in Cse+/+ versus Cse−/− mice treated or not (Cse−/− Ctrl) with 4 g/L STS (Cse−/− STS). Scale bar 50 µm. Data are scatter plots with mean ± SEM of 8 to 10 animals per group. *p < .05, **p < .01, as determined by one-way ANOVA with post-hoc t-tests with Tukey's correction for multiple comparisons.
Figure 3
Figure 3
STS decreases apoptosis and matrix deposition in human vein segments. Human vein segment at day 0 (D0) or after 7 days of static culture with or without (D7) 15 mM STS or 100 µm NaHS. (a) Representative Herovici staining of 5 different human vein segments. Mature collagen I is stained pink; new collagen III is stained blue; cytoplasm is counterstained yellow; nuclei are stained blue to black. Scale bar=80 µm (b) Left panels: Representative P4HA1 staining. Scale bar=50 µm. Right panel: Quantitative assessment of P4HA1 staining. Data are scatter plots of 5 different veins with mean ± SEM. ***p < .01 as determined by paired repeated measures one-way ANOVA with Dunnett's multiple comparisons. (c) Left panels: Representative TUNEL staining in human vein segments. Right panel: Apoptosis is expressed as TUNEL positive (green) over DAPI positive nuclei. Scale bar= 50 µm. Data are scatter plots of 5 to 6 different veins with mean ± SEM. *p < .05, ***p < .001 as determined by mixed model analysis with Dunnett's multiple comparisons. (d) Representative western blot of Bax and Bcl2 over total protein and quantitative assessment of 7 different human veins. Data are scatter plots with mean ± SEM. *p < .05 as determined by repeated measures one-way ANOVA with Dunnett's multiple comparisons (For interpretation of the references to color in this figure legend, the reader is referred to the web version of this article.).
Figure 4
Figure 4
STS inhibits cell proliferationin vivoin mouse carotids andex-vivoin human vein segments. PCNA immunostaining on CAS operated carotids in WT mice (a) treated or not (Ctrl) with STS 4 g/L or NaHS 0.5g/L for 28 days, and human vein segments (b) incubated or not (Ctrl) with 15 mM STS or 100 µm NaHS for 7 days. Proliferation is expressed as the ratio of PCNA positive (brown) nuclei over total number of nuclei. Data are scatter plots with mean±SEM. (a) Scale bar 20 µm. *p < .05, **p < .01, ***p < .001 as determined from 8 to 12 animals per group by one-way ANOVA with Dunnett's multiple comparisons. (b) Scale bar 50 µm **p < .01, as determined from 5 to 7 different veins by mixed model analysis and Dunnett's multiple comparisons.
Figure 5
Figure 5
STS inhibits VSMC proliferation and migrationin vitro. (a) VSMC proliferation (BrdU incorporation) in cells treated or not (Ctrl) for 24 h with 3 or 15 mM STS. Data are % of BrdU positive nuclei (pink) over DAPI positive nuclei. Scale bar: 25 µm. Data shown as mean ± SEM of 6 different experiments. *p < .05 as determined by repeated measures one-way ANOVA with Dunnett's multiple comparisons tests. (b) VSMC migration in cells treated or not (Ctrl) with 3 or 15 mM STS, as assessed by wound healing assay, expressed as the percentage of wound closure after 10 h. Scale bar: 100 µm. Data are scatter plots with mean ± SEM of 5 independent experiments in duplicates. ***p < .001 as determined by repeated measures one-way ANOVA with Dunnett's multiple comparisons. (c) Bright field images of VSMC morphology in cells exposed or not (Ctrl) to 15 mM STS or 100 µm NaHS, as measured as cell perimeter, cell area, Feret diameter and circularity index assessed during wound healing assay. Data are violin plots with median and quartiles (dotted lines) of 5 independent experiments. ***p < .001 as determined by one-way ANOVA with Dunnett's post-hoc test. Scale bar: 80 µm. Pink and blue insets are 3-fold magnifications of outlined areas.
Figure 6
Figure 6
STS inhibits microtubule polymerization in VSMC. (a) α-tubulin immunolabelling in carotids of native (D0) or CAS-operated mice treated or not (Ctrl) with STS 4 g/L. L=Lumen; M= Media; IH= Intimal Hyperplasia. Images are representative of 5 to 8 mice per group. Scale bar 20 µm (b) WB analysis of α-tubulin over total protein in aortas of mice treated or not (Ctrl) with STS 4 g/L for 7 days. Data are scatter plots of 7 mice per groups with mean ± SEM with **p < .01, as determined by one-way ANOVA with Tukey's multiple comparisons tests. (c) α-tubulin immunolabelling in human vein segments kept or not (D0) in culture in presence or not (Ctrl) of 15 mM STS for 7 days. Scale bar 40 µm. L=Lumen; M=Media. Images are representative of 5 different veins. (d) WB analysis of tubulin over total protein in human vein segments kept or not (D0) in culture in presence or not (Ctrl) of 15 mM STS or 100 µm NaHS for 7 days. *p < .05, **p < .01, ***p < .001, as determined by repeated measures one-way ANOVA from 7 different veins with Dunnett's multiple comparisons tests. (e) α-tubulin immunofluorescent staining in VSMC exposed or not to 15 mM STS or 100 µm NaHS for 8 h. Images are representative of 5 independent experiments. Bar scale 10 µm. (f) Quantitative assessment of microtubule filaments immunostaining per cell. Data are representative of 3 independent experiments, 3 to 4 images per experiment per condition. ***p < .001 as determined by one-way ANOVA with Tukey's multiple comparisons tests. (g) In vitro tubulin polymerization assay in presence or not (Ctrl) of 15 mM STS, 100 µm NaHS or 10 µm Nocodazole. Data are mean ± SEM of 3 independent experiments. (h) Flow cytometry analysis of cell cycle (DNA content) using DAPI-stained VSMC treated or not (Ctrl) for 48 h with 15 mM STS or 10 nm Nocodazole. Upper panel: representative histograms; lower panel: table with mean ± SD of 5 independent experiments. *p < .05, **p < .01 as determined by one-way ANOVA with Dunnett's multiple comparisons tests.

Similar articles

Cited by

References

    1. Eraso L.H., Fukaya E., Mohler E.R., Xie D., Sha D., Berger J.S. Peripheral arterial disease, prevalence and cumulative risk factor profile analysis. Eur J Prev Cardiol. 2014;21(6):704–711. - PMC - PubMed
    1. Fowkes F.G., Rudan D., Rudan I., et al. Comparison of global estimates of prevalence and risk factors for peripheral artery disease in 2000 and 2010: a systematic review and analysis. Lancet. 2013;382(9901):1329–1340. - PubMed
    1. Song P., Rudan D., Zhu Y., et al. Global, regional, and national prevalence and risk factors for peripheral artery disease in 2015: an updated systematic review and analysis. Lancet Glob Health. 2019;7(8):e1020–e1030. - PubMed
    1. Bjorck M., Earnshaw J.J., Acosta S., et al. Editor's choice - European Society for Vascular Surgery (ESVS) 2020 clinical practice guidelines on the management of acute limb ischaemia. Eur J Vasc Endovasc Surg. 2020;59(2):173–218. - PubMed
    1. Jukema J.W., Verschuren J.J., Ahmed T.A., Quax P.H. Restenosis after PCI. Part 1: pathophysiology and risk factors. Nat Rev Cardiol. 2011;9(1):53–62. - PubMed