

Smartphone-based sensitive detection of SARS-CoV-2 from saline gargle samples via flow profile analysis on a paper microfluidic chip
- PMID: 35334331
- PMCID: PMC8926431
- DOI: 10.1016/j.bios.2022.114192
Smartphone-based sensitive detection of SARS-CoV-2 from saline gargle samples via flow profile analysis on a paper microfluidic chip
Abstract
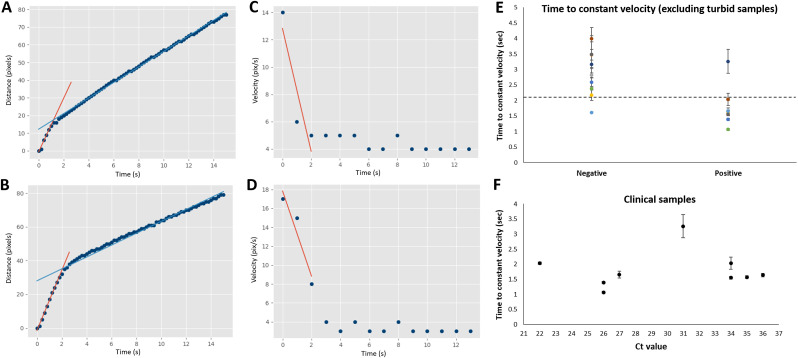
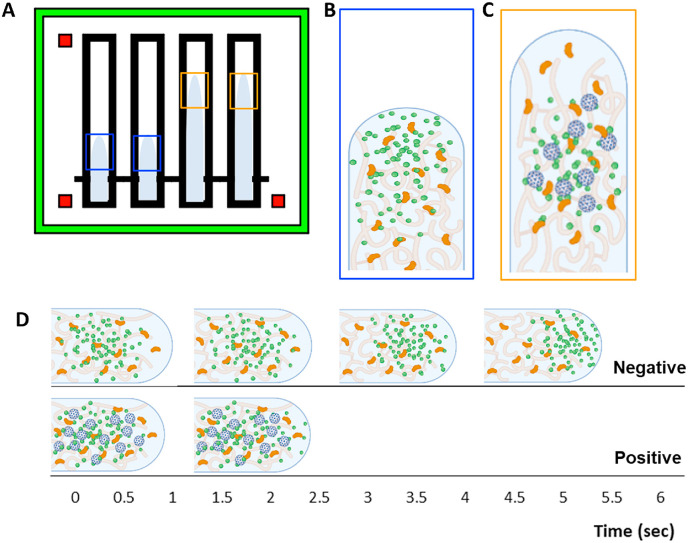
Respiratory viruses, especially coronaviruses, have resulted in worldwide pandemics in the past couple of decades. Saliva-based paper microfluidic assays represent an opportunity for noninvasive and rapid screening, yet both the sample matrix and test method come with unique challenges. In this work, we demonstrated the rapid and sensitive detection of SARS-CoV-2 from saliva samples, which could be simpler and more comfortable for patients than existing methods. Furthermore, we systematically investigated the components of saliva samples that affected assay performance. Using only a smartphone, an antibody-conjugated particle suspension, and a paper microfluidic chip, we made the assay user-friendly with minimal processing. Unlike the previously established flow rate assays that depended solely on the flow rate or distance, this unique assay analyzes the flow profile to determine infection status. Particle-target immunoagglutination changed the surface tension and subsequently the capillary flow velocity profile. A smartphone camera automatically measured the flow profile using a Python script, which was not affected by ambient light variations. The limit of detection (LOD) was 1 fg/μL SARS-CoV-2 from 1% saliva samples and 10 fg/μL from simulated saline gargle samples (15% saliva and 0.9% saline). This method was highly specific as demonstrated using influenza A/H1N1. The sample-to-answer assay time was <15 min, including <1-min capillary flow time. The overall accuracy was 89% with relatively clean clinical saline gargle samples. Despite some limitations with turbid clinical samples, this method presents a potential solution for rapid mass testing techniques during any infectious disease outbreak as soon as the antibodies become available.
Keywords: COVID-19; Capillary action; Particle immunoagglutination; Respiratory virus; Smartphone-based biosensor.
Copyright © 2022 Elsevier B.V. All rights reserved.
Conflict of interest statement
The authors declare that they have no known competing financial interests or personal relationships that could have appeared to influence the work reported in this paper.
Figures
Similar articles
-
Sensitive SARS-CoV-2 salivary antibody assays for clinical saline gargle samples using smartphone-based competitive particle immunoassay platforms.Biosens Bioelectron. 2023 Jun 1;229:115221. doi: 10.1016/j.bios.2023.115221. Epub 2023 Mar 12. Biosens Bioelectron. 2023. PMID: 36958205 Free PMC article.
-
Sensitive, smartphone-based SARS-CoV-2 detection from clinical saline gargle samples.PNAS Nexus. 2022 Mar 16;1(1):pgac028. doi: 10.1093/pnasnexus/pgac028. eCollection 2022 Mar. PNAS Nexus. 2022. PMID: 35450423 Free PMC article.
-
Direct capture and smartphone quantification of airborne SARS-CoV-2 on a paper microfluidic chip.Biosens Bioelectron. 2022 Mar 15;200:113912. doi: 10.1016/j.bios.2021.113912. Epub 2021 Dec 24. Biosens Bioelectron. 2022. PMID: 34973565 Free PMC article.
-
Microfluidics-Based Biosensing Platforms: Emerging Frontiers in Point-of-Care Testing SARS-CoV-2 and Seroprevalence.Biosensors (Basel). 2022 Mar 17;12(3):179. doi: 10.3390/bios12030179. Biosensors (Basel). 2022. PMID: 35323449 Free PMC article. Review.
-
Detection of three pandemic causing coronaviruses from non-respiratory samples: systematic review and meta-analysis.Sci Rep. 2021 Aug 9;11(1):16131. doi: 10.1038/s41598-021-95329-4. Sci Rep. 2021. PMID: 34373501 Free PMC article.
Cited by
-
Influenza viruses and SARS-CoV-2 diagnosis via sensitive testing methods in clinical application.Heliyon. 2024 Aug 21;10(18):e36410. doi: 10.1016/j.heliyon.2024.e36410. eCollection 2024 Sep 30. Heliyon. 2024. PMID: 39381246 Free PMC article. Review.
-
Smartphone-based point-of-care testing of the SARS-CoV-2: A systematic review.Sci Afr. 2023 Sep;21:e01757. doi: 10.1016/j.sciaf.2023.e01757. Epub 2023 Jun 10. Sci Afr. 2023. PMID: 37351482 Free PMC article.
-
Visual Detection of COVID-19 from Materials Aspect.Adv Fiber Mater. 2022;4(6):1304-1333. doi: 10.1007/s42765-022-00179-y. Epub 2022 Aug 8. Adv Fiber Mater. 2022. PMID: 35966612 Free PMC article. Review.
-
A portable immunosensor provides sensitive and rapid detection of Borrelia burgdorferi antigen in spiked blood.Sci Rep. 2023 May 9;13(1):7546. doi: 10.1038/s41598-023-34108-9. Sci Rep. 2023. PMID: 37161039 Free PMC article.
-
Single-step batch fabrication of microfluidic paper-based analytical devices with a 3D printer and their applications in nanoenzyme-enhanced visual detection of dopamine.Anal Bioanal Chem. 2024 Jul;416(18):4131-4141. doi: 10.1007/s00216-024-05337-2. Epub 2024 May 23. Anal Bioanal Chem. 2024. PMID: 38780654
References
-
- Burbelo P.D., Riedo F.X., Morishima C., Rawlings S., Smith D., Das S., Strich J.R., Chertow D.S., Davey R.T., Cohen J.I. Detection of nucleocapsid antibody to SARS-CoV-2 is more sensitive than antibody to spike protein in COVID-19 patients. medRxiv. 2020 doi: 10.1101/2020.04.20.20071423. - DOI
-
- Byambasuren O., Cardona M., Bell K., Clark J., McLaws M.-L., Glasziou P. Estimating the extent of asymptomatic COVID-19 and its potential for community transmission: systematic review and meta-analysis. J. Assoc. Med. Microbiol. Infect. Dis. Can. 2020;5:223–234. doi: 10.3138/jammi-2020-0030. - DOI - PMC - PubMed
MeSH terms
Grants and funding
LinkOut - more resources
Full Text Sources
Medical
Miscellaneous
