. 2022 Mar 11;14(6):1181.
doi: 10.3390/nu14061181.

Nutrient Intake with Early Progressive Enteral Feeding and Growth of Very Low-Birth-Weight Newborns

Affiliations

Nutrient Intake with Early Progressive Enteral Feeding and Growth of Very Low-Birth-Weight Newborns

Rasa Brinkis et al. Nutrients. .

Abstract

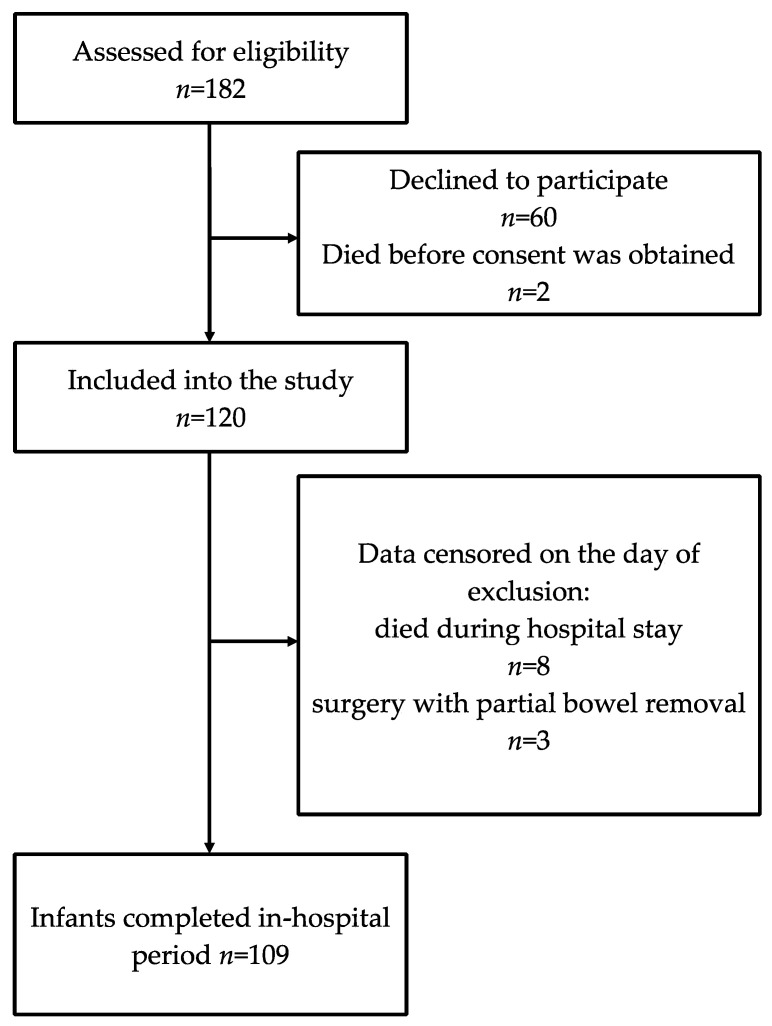
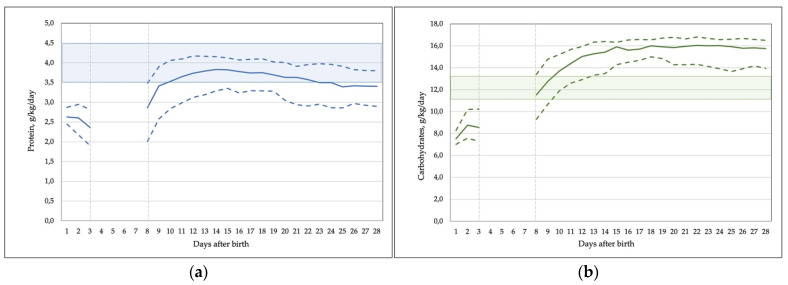
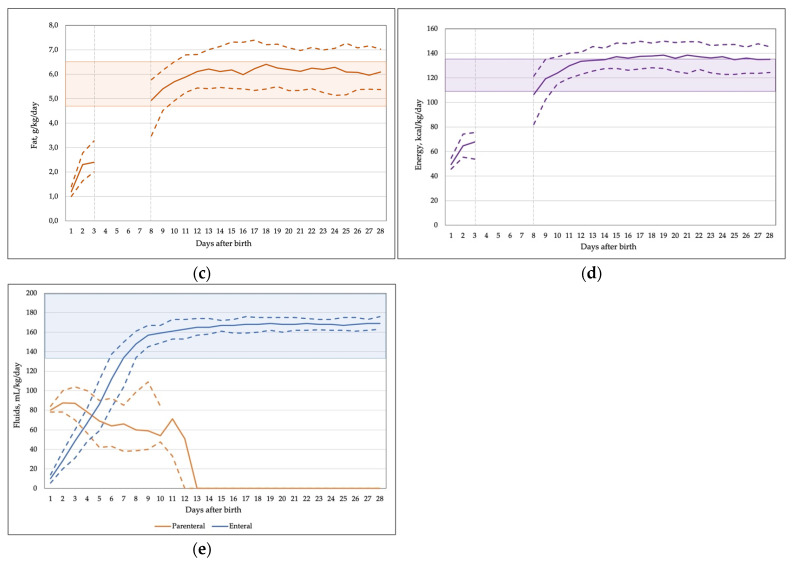
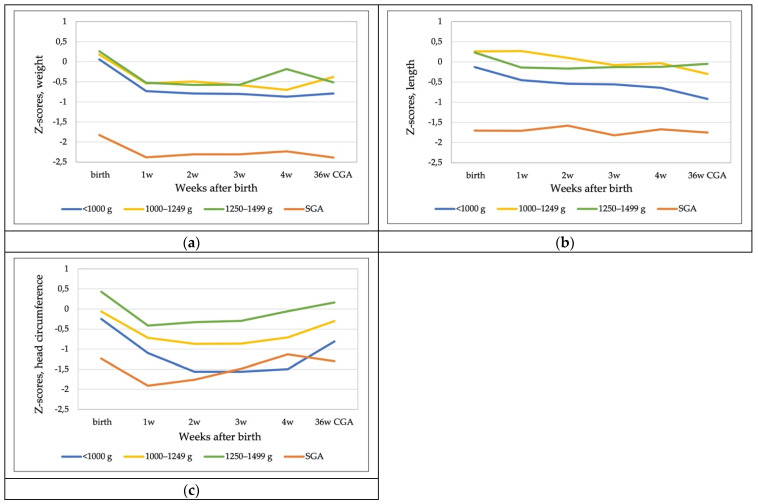
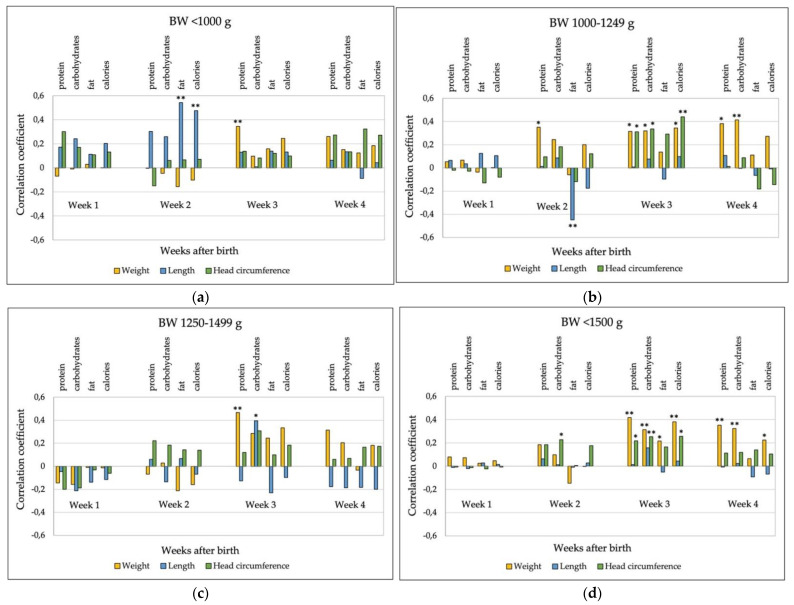
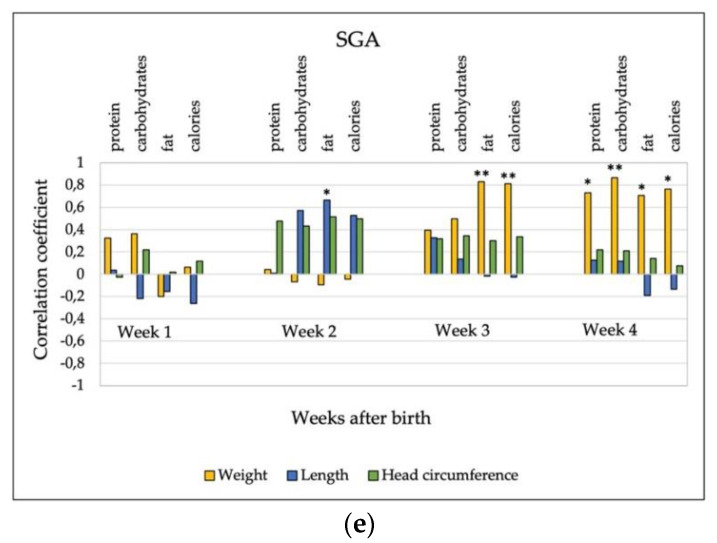
Early nutrition is one of the most modifiable factors influencing postnatal growth. Optimal nutrient intakes for very preterm infants remain unknown, and poor postnatal growth is common in this population. The aim of this study was to assess nutrient intake during the first 4 weeks of life with early progressive enteral feeding and its impact on the in-hospital growth of very low-birth-weight (VLBW) infants. In total, 120 infants with birth weights below 1500 g and gestational ages below 35 weeks were included in the study. Nutrient intakes were assessed daily for the first 28 days. Growth was measured weekly until discharge. Median time of parenteral nutrition support was 6 days. Target enteral nutrient and energy intake were reached at day 10 of life, and remained stable until day 28, with slowly declining protein intake. Median z-scores at discharge were -0.73, -0.49, and -0.31 for weight, length, and head circumference, respectively. Extrauterine growth restriction was observed in 30.3% of the whole cohort. Protein, carbohydrates, and energy intakes correlated positively with weight gain and head circumference growth. Early progressive enteral feeding with human milk is well tolerated in VLBW infants. Target enteral nutrient intake may be reached early and improve in-hospital growth.

Keywords: enteral feeding; extrauterine growth restriction; growth; newborn; nutritional intake; very low birth weight.


Conflict of interest statement

The authors declare no conflict of interest. The funders had no role in the design of the study; in the collection, analyses, or interpretation of data; in the writing of the manuscript; or in the decision to publish the results.

Figures

Figure 1
Figure 1
Flowchart of the study subjects’ inclusion.
Figure 2
Figure 2
Amount of mother milk samples (% of all mothers) collected each day post-partum.
Figure 3
Figure 3
Macronutrient, energy, and fluid intake during the first 28 days. (a) Total daily protein intake, g/kg/day; (b) total daily carbohydrates intake, g/kg/day; (c) total daily fat intake, g/kg/day; (d) total daily energy intake, kcal/kg/day; (e) daily parenteral and enteral fluid intake, mL/kg/day. Data are median (solid line) and interquartile range (dashed lines). Shaded areas represent the range of recommended enteral nutrient intakes.
Figure 3
Figure 3
Macronutrient, energy, and fluid intake during the first 28 days. (a) Total daily protein intake, g/kg/day; (b) total daily carbohydrates intake, g/kg/day; (c) total daily fat intake, g/kg/day; (d) total daily energy intake, kcal/kg/day; (e) daily parenteral and enteral fluid intake, mL/kg/day. Data are median (solid line) and interquartile range (dashed lines). Shaded areas represent the range of recommended enteral nutrient intakes.
Figure 4
Figure 4
Z-scores for weight, length, and head circumference of infants of different birth weight groups and SGA infants (Fenton reference) from birth to 28 days and 36 weeks CGA or discharge. (a) Weight z-scores; (b) length z-scores; (c) head circumference z-scores. Data are median.
Figure 5
Figure 5
Correlations (Spearman’s rho) between nutrient and energy intake and growth during the first 4 weeks. (a) Birthweight group < 1000 g; (b) birthweight group 1000–1249 g; (c) birth weight group 1250–1499 g; (d) the whole cohort, (e) SGA infants. * Correlation is significant at 0.05 level; ** correlation is significant at 0.01 level.
Figure 5
Figure 5
Correlations (Spearman’s rho) between nutrient and energy intake and growth during the first 4 weeks. (a) Birthweight group < 1000 g; (b) birthweight group 1000–1249 g; (c) birth weight group 1250–1499 g; (d) the whole cohort, (e) SGA infants. * Correlation is significant at 0.05 level; ** correlation is significant at 0.01 level.

Similar articles

Cited by

References

    1. Niklasson A. Handbook of Growth and Growth Monitoring in Health and Disease. Springer; New York, NY, USA: 2012. Growth from 24 Weeks to 24 Months in Preterm Infants: Experience from a Swedish Population; pp. 2923–3295.
    1. Vinall J., Miller S.P., Chau V., Brummelte S., Synnes A.R., Grunau R.E. Neonatal pain in relation to postnatal growth in infants born very preterm. Pain. 2012;153:1374–1381. doi: 10.1016/j.pain.2012.02.007. - DOI - PubMed
    1. Lima P.A.T., de Carvalho M., da Costa A.C.C., Moreira M.E.L. Variables associated with extra uterine growth restriction in very low birth weight infants. J. Pediatr. 2014;90:22–27. doi: 10.1016/j.jped.2013.05.007. - DOI - PubMed
    1. Lee S.M., Kim N., Namgung R., Park M.S., Park K., Jeon J. Prediction of Postnatal Growth Failure among Very Low Birth Weight Infants. Sci. Rep. 2018;8:3729. doi: 10.1038/s41598-018-21647-9. - DOI - PMC - PubMed
    1. Cormack B.E., Embleton N.D., van Goudoever J.B., Hay W.W., Jr., Bloomfield F.H. Comparing apples with apples: It is time for standardized reporting of neonatal nutrition and growth studies. Pediatr. Res. 2016;79:810–820. doi: 10.1038/pr.2016.26. - DOI - PubMed