

IGF-1 Signaling Regulates Mitochondrial Remodeling during Myogenic Differentiation
- PMID: 35334906
- PMCID: PMC8954578
- DOI: 10.3390/nu14061249
IGF-1 Signaling Regulates Mitochondrial Remodeling during Myogenic Differentiation
Abstract
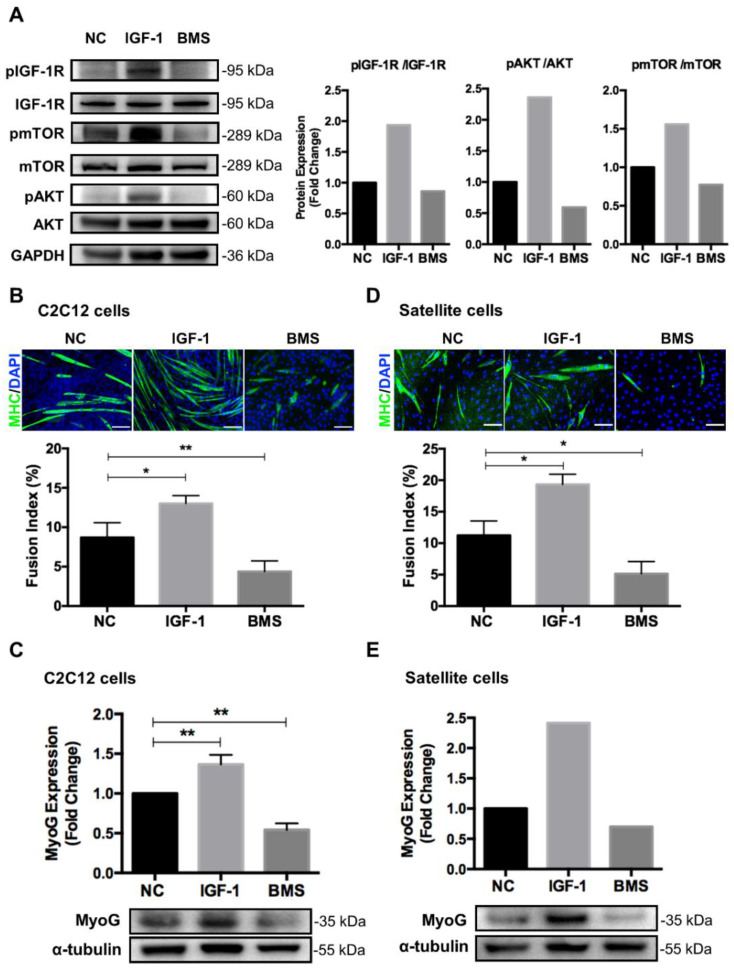
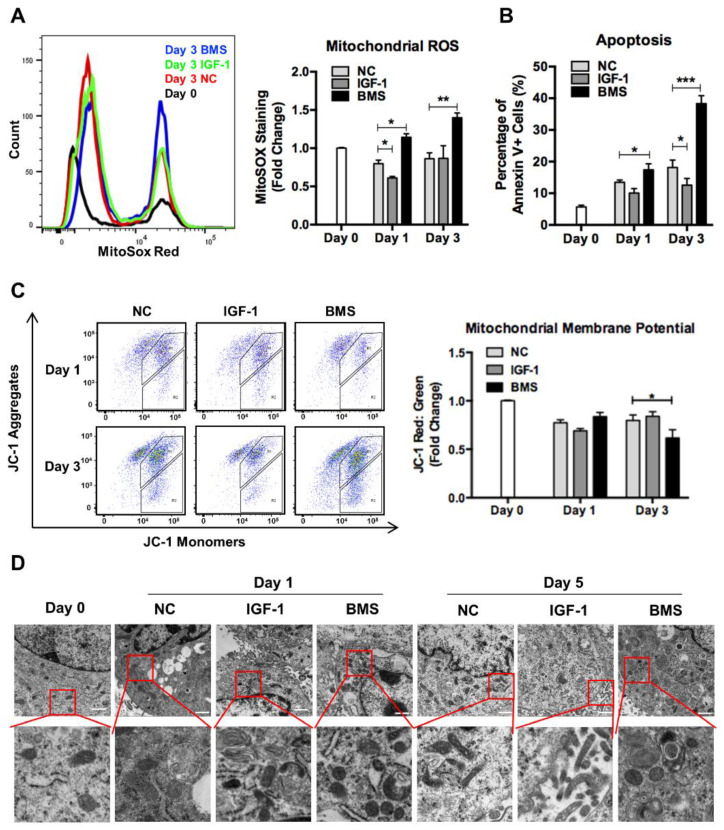
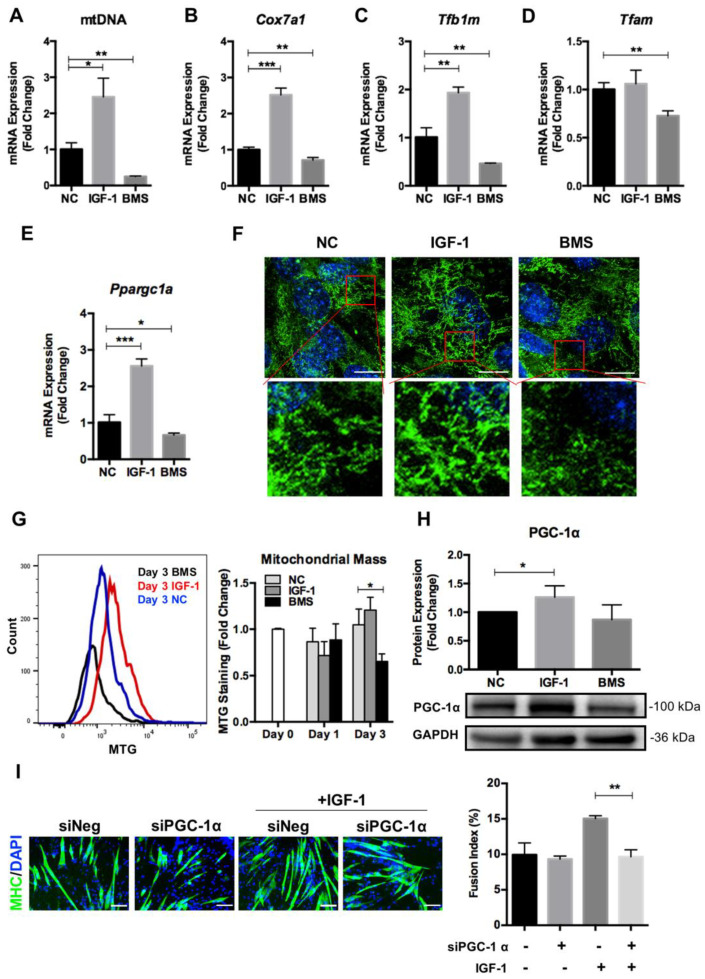
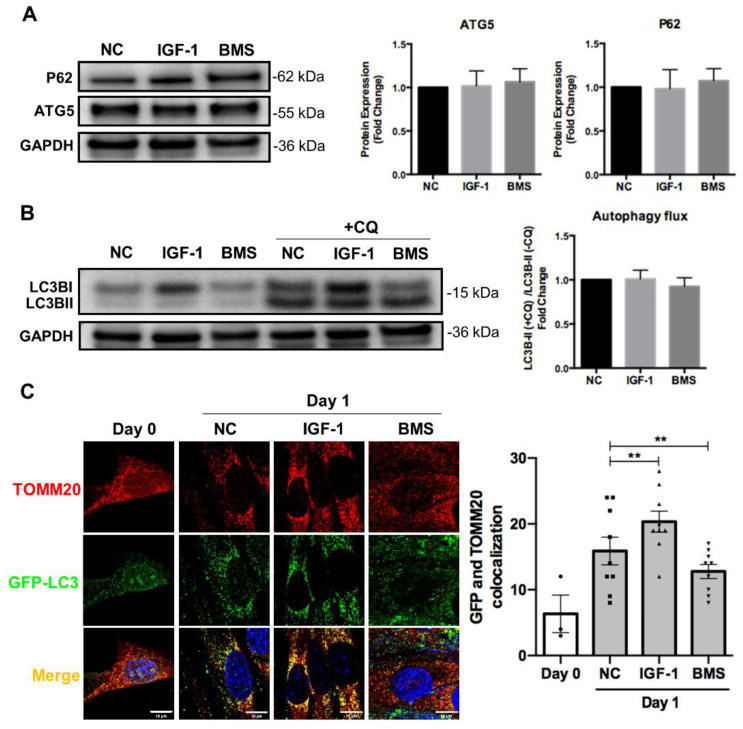
Skeletal muscle is essential for locomotion, metabolism, and protein homeostasis in the body. Mitochondria have been considered as a key target to regulate metabolic switch during myo-genesis. The insulin-like growth factor 1 (IGF-1) signaling through the AKT/mammalian target of rapamycin (mTOR) pathway has a well-documented role in promoting muscle growth and regeneration, but whether it is involved in mitochondrial behavior and function remains un-examined. In this study, we investigated the effect of IGF-1 signaling on mitochondrial remodeling during myogenic differentiation. The results demonstrated that IGF-1 signaling stimulated mitochondrial biogenesis by increasing mitochondrial DNA copy number and expression of genes such as Cox7a1, Tfb1m, and Ppargc1a. Moreover, the level of mitophagy in differentiating myoblasts elevated significantly with IGF-1 treatment, which contributed to mitochondrial turnover. Peroxisome proliferator-activated receptor gamma coactivator 1-alpha (PGC-1α) and BCL2/adenovirus E1B 19 kDa protein-interacting protein 3 (BNIP3) were identified as two key mediators of IGF-1-induced mitochondrial biogenesis and mitophagy, respectively. In addition, IGF-1 supplementation could alleviate impaired myoblast differentiation caused by mitophagy deficiency, as evidenced by increased fusion index and myosin heavy chain expression. These findings provide new insights into the role of IGF-1 signaling and suggest that IGF-1 signaling can serve as a target for the research and development of drugs and nutrients that support muscle growth and regeneration.
Keywords: IGF-1; energy metabolism; mitochondrial biogenesis; mitochondrial remodeling; mitophagy; muscle regeneration; myogenic differentiation.
Conflict of interest statement
The authors declare no conflict of interest.
Figures
Similar articles
-
Mitophagy regulates mitochondrial network signaling, oxidative stress, and apoptosis during myoblast differentiation.Autophagy. 2019 Sep;15(9):1606-1619. doi: 10.1080/15548627.2019.1591672. Epub 2019 Apr 7. Autophagy. 2019. PMID: 30859901 Free PMC article.
-
Insulin-like growth factor 1 signaling is essential for mitochondrial biogenesis and mitophagy in cancer cells.J Biol Chem. 2017 Oct 13;292(41):16983-16998. doi: 10.1074/jbc.M117.792838. Epub 2017 Aug 18. J Biol Chem. 2017. PMID: 28821609 Free PMC article.
-
IGF-1 Signalling Regulates Mitochondria Dynamics and Turnover through a Conserved GSK-3β-Nrf2-BNIP3 Pathway.Cells. 2020 Jan 8;9(1):147. doi: 10.3390/cells9010147. Cells. 2020. PMID: 31936236 Free PMC article.
-
PGC-1α-mediated regulation of mitochondrial function and physiological implications.Appl Physiol Nutr Metab. 2020 Sep;45(9):927-936. doi: 10.1139/apnm-2020-0005. Epub 2020 Jun 9. Appl Physiol Nutr Metab. 2020. PMID: 32516539 Review.
-
Mitochondrial dysregulation and muscle disuse atrophy.F1000Res. 2019 Sep 11;8:F1000 Faculty Rev-1621. doi: 10.12688/f1000research.19139.1. eCollection 2019. F1000Res. 2019. PMID: 31559011 Free PMC article. Review.
Cited by
-
Insulin‑like growth factor in cancer: New perspectives (Review).Mol Med Rep. 2025 Aug;32(2):209. doi: 10.3892/mmr.2025.13574. Epub 2025 May 26. Mol Med Rep. 2025. PMID: 40417926 Free PMC article. Review.
-
Defective Intracellular Insulin/IGF-1 Signaling Elucidates the Link Between Metabolic Defect and Autoimmunity in Vitiligo.Cells. 2025 Apr 9;14(8):565. doi: 10.3390/cells14080565. Cells. 2025. PMID: 40277891 Free PMC article.
-
Muscle in Endocrinology: From Skeletal Muscle Hormone Regulation to Myokine Secretion and Its Implications in Endocrine-Metabolic Diseases.J Clin Med. 2025 Jun 25;14(13):4490. doi: 10.3390/jcm14134490. J Clin Med. 2025. PMID: 40648864 Free PMC article. Review.
-
Mitochondrial stress response and myogenic differentiation.Front Cell Dev Biol. 2024 Apr 12;12:1381417. doi: 10.3389/fcell.2024.1381417. eCollection 2024. Front Cell Dev Biol. 2024. PMID: 38681520 Free PMC article. Review.
-
Eye on the horizon: The metabolic landscape of the RPE in aging and disease.Prog Retin Eye Res. 2025 Jan;104:101306. doi: 10.1016/j.preteyeres.2024.101306. Epub 2024 Oct 19. Prog Retin Eye Res. 2025. PMID: 39433211 Free PMC article. Review.
References
MeSH terms
Substances
Grants and funding
- SN-ZJU-SIAS-0013/Starry Night Science Fund of Zhejiang University Shanghai Institute for Advanced Study
- 3210160732/National Natural Science Foundation of China
- BK20210462/Natural Science Foundation of Jiangsu Province
- BK20202002/Natural Science Foundation of Jiangsu Province
- 2021YFC2101400/National Key Research and Development Program of China
LinkOut - more resources
Full Text Sources
Miscellaneous
