

Exploring the Potential Effects and Mechanisms of Asarum sieboldii Radix Essential Oil for Treatment of Asthma
- PMID: 35335934
- PMCID: PMC8953372
- DOI: 10.3390/pharmaceutics14030558
Exploring the Potential Effects and Mechanisms of Asarum sieboldii Radix Essential Oil for Treatment of Asthma
Abstract
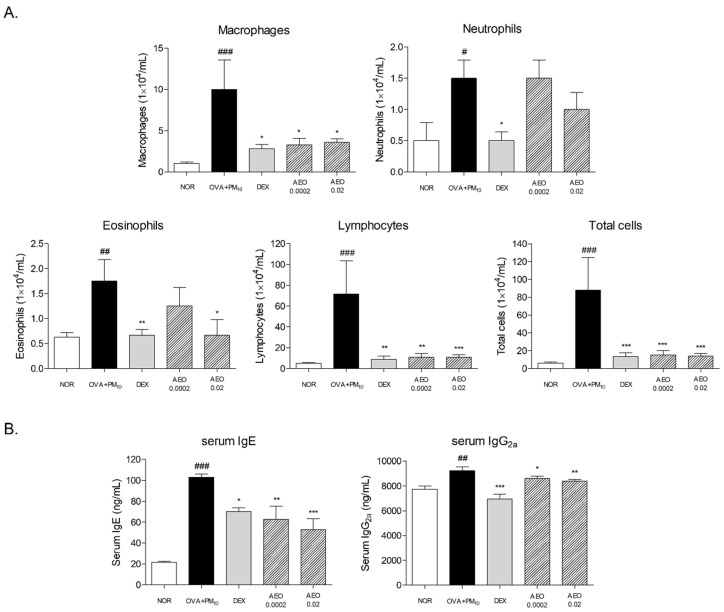
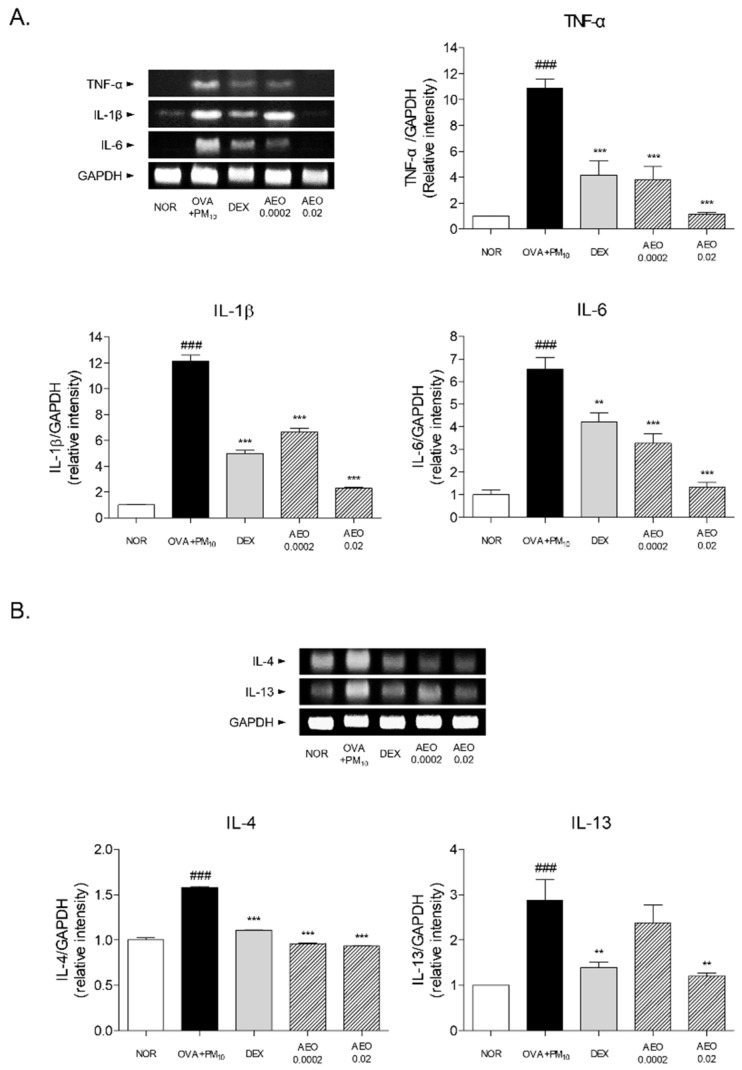
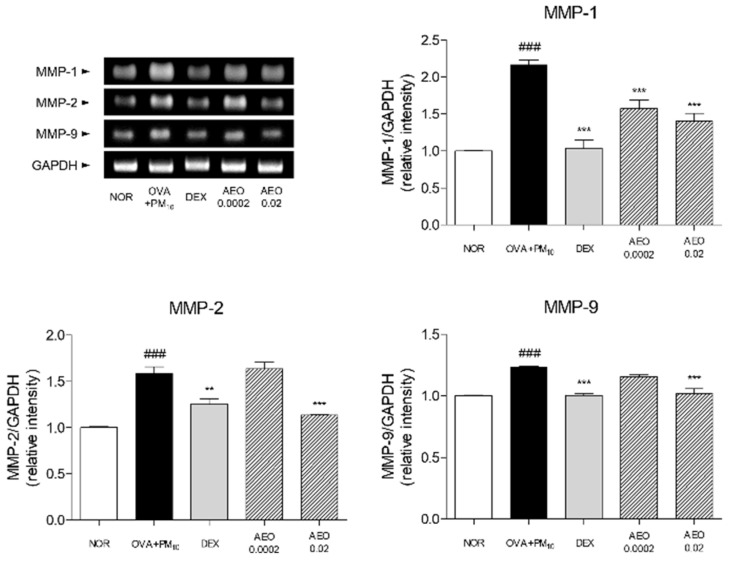
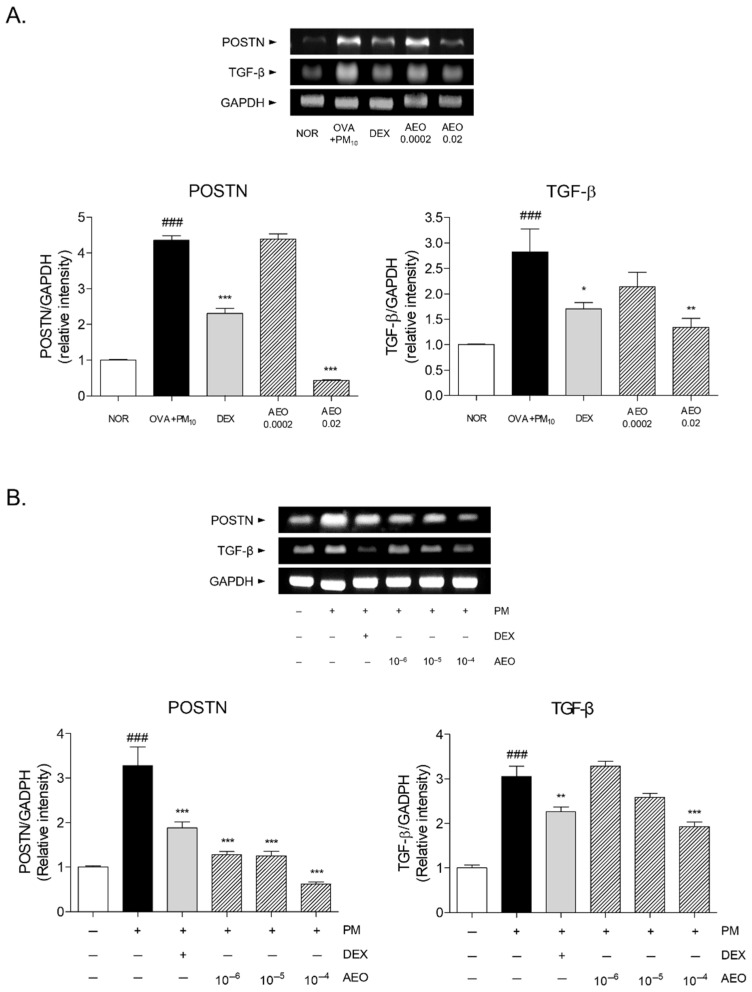
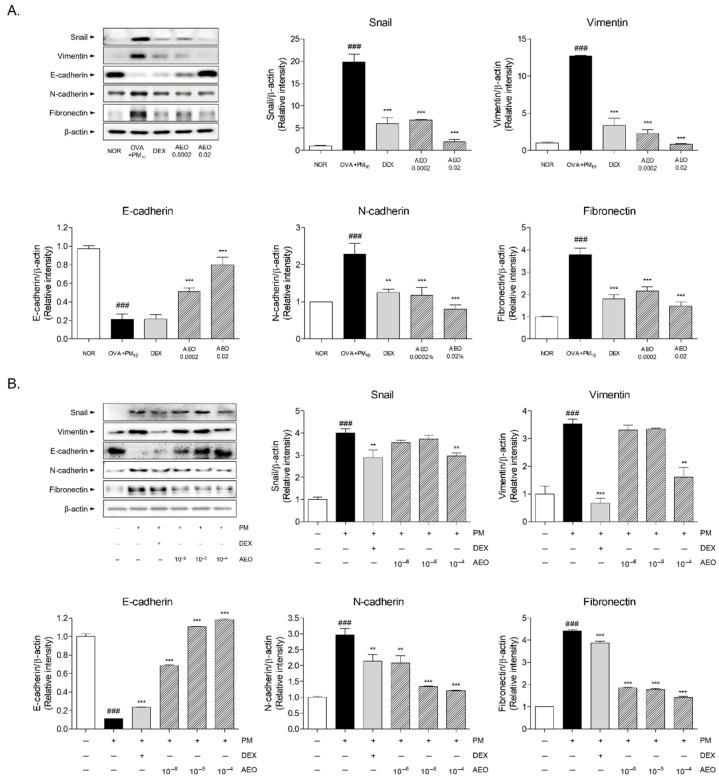
Asthma, a common chronic pulmonary disorder characterized by airway remodeling, hyperresponsiveness and obstruction, can be aggravated by repeated exposure to particulate matter (PM). The potential effect and mechanisms of Asarum sieboldii Radix essential oil (AEO) against asthma were explored based on network pharmacology. AEO was pre-treated using a nebulizer for 3 weeks and the mice were sensitized to ovalbumin (OVA) and PM10 with the co-treatment of AEO for 4 weeks. In addition, A549 lung epithelial cells were sensitized with PM10 to investigate the underlying mechanisms of AEO regarding the lung-fibrosis-related mediators. The target genes of methyl eugenol, a main compound of AEO, were highly matched by 48% with the gene set of asthma. AEO markedly inhibited the increase in epithelial thickness through the accumulation of goblet cells in the airways. Collagen deposition in the lung tissues of OVA+PM10-challenged asthmatic mice was significantly decreased by AEO. AEO also inhibited the influx of inflammatory cells in the bronchoalveolar lavage fluid, as well as the increases in serum IgE and IgG2a and cytokines in the lung tissues. Furthermore, AEO regulated the expressions of fibrotic mediators, especially POSTN and TGF-β. In conclusion, we expect that AEO can be one of the effective alternative therapeutics to relieve asthma.
Keywords: Asarum sieboldii; air pollution; asthma; essential oil; particulate matter.
Conflict of interest statement
The authors declare no conflict of interest. The funders had no role in the design of the study; in the collection, analyses, or interpretation of data; in the writing of the manuscript, or in the decision to publish the results.
Figures


Similar articles
-
Abies holophylla Leaf Essential Oil Alleviates Allergic Rhinitis Based on Network Pharmacology.Pharmaceutics. 2023 Apr 9;15(4):1195. doi: 10.3390/pharmaceutics15041195. Pharmaceutics. 2023. PMID: 37111680 Free PMC article.
-
Protective effect of Asarum sieboldii essential oil on ovalbumin induced allergic rhinitis in rat.Biosci Rep. 2020 Jun 26;40(6):BSR20191370. doi: 10.1042/BSR20191370. Biosci Rep. 2020. PMID: 32395767 Free PMC article.
-
Inhalation of Essential Oil from Mentha piperita Ameliorates PM10-Exposed Asthma by Targeting IL-6/JAK2/STAT3 Pathway Based on a Network Pharmacological Analysis.Pharmaceuticals (Basel). 2020 Dec 22;14(1):2. doi: 10.3390/ph14010002. Pharmaceuticals (Basel). 2020. PMID: 33374928 Free PMC article.
-
AGK2 ameliorates mast cell-mediated allergic airway inflammation and fibrosis by inhibiting FcεRI/TGF-β signaling pathway.Pharmacol Res. 2020 Sep;159:105027. doi: 10.1016/j.phrs.2020.105027. Epub 2020 Jun 18. Pharmacol Res. 2020. PMID: 32565308
-
Experimental protocol for development of adjuvant-free murine chronic model of allergic asthma.J Immunol Methods. 2019 May;468:10-19. doi: 10.1016/j.jim.2019.03.002. Epub 2019 Mar 14. J Immunol Methods. 2019. PMID: 30880263
Cited by
-
Effect of molecular distillation on the anti-inflammatory activity and neurotoxicity of Asarum essential oil.Front Pharmacol. 2023 May 22;14:1196137. doi: 10.3389/fphar.2023.1196137. eCollection 2023. Front Pharmacol. 2023. PMID: 37284321 Free PMC article.
-
Therapeutic Potential of Herbal Medicines in Combating Particulate Matter (PM)-Induced Health Effects: Insights from Recent Studies.Antioxidants (Basel). 2024 Dec 27;14(1):23. doi: 10.3390/antiox14010023. Antioxidants (Basel). 2024. PMID: 39857357 Free PMC article. Review.
-
Asarum sieboldii, a Potential Ethnomedicinal Herb in Dentistry and Oral Health.Int Dent J. 2025 Aug;75(4):100816. doi: 10.1016/j.identj.2025.03.025. Epub 2025 May 5. Int Dent J. 2025. PMID: 40328202 Free PMC article. Review.
-
Phytotherapeutic BS012 and Its Active Component Ameliorate Allergic Asthma via Inhibition of Th2-Mediated Immune Response and Apoptosis.Biomol Ther (Seoul). 2024 Nov 1;32(6):744-758. doi: 10.4062/biomolther.2024.058. Epub 2024 Oct 7. Biomol Ther (Seoul). 2024. PMID: 39370723 Free PMC article.
-
Effectiveness of Inhalation of a New Essential Oil Formulation on Asthma Through Network Pharmacology and In Vivo Analysis.Food Sci Nutr. 2025 Aug 7;13(8):e70763. doi: 10.1002/fsn3.70763. eCollection 2025 Aug. Food Sci Nutr. 2025. PMID: 40777200 Free PMC article.
References
Grants and funding
LinkOut - more resources
Full Text Sources
Miscellaneous
