

Pharmacokinetics of Curative Tranexamic Acid in Parturients Undergoing Cesarean Delivery
- PMID: 35335955
- PMCID: PMC8952437
- DOI: 10.3390/pharmaceutics14030578
Pharmacokinetics of Curative Tranexamic Acid in Parturients Undergoing Cesarean Delivery
Abstract
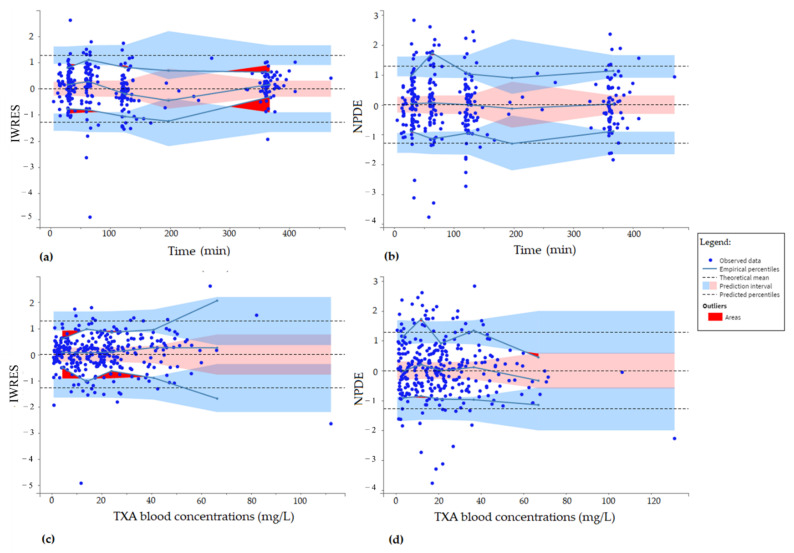
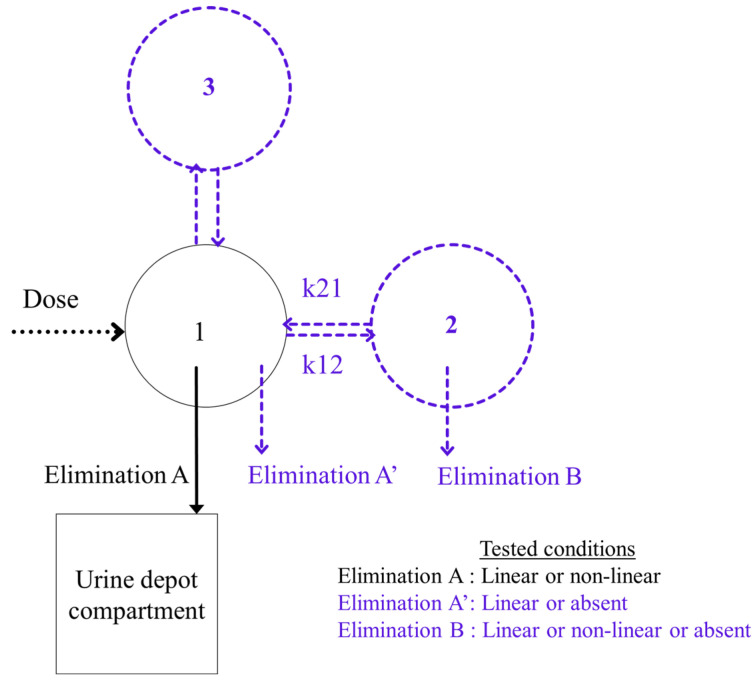
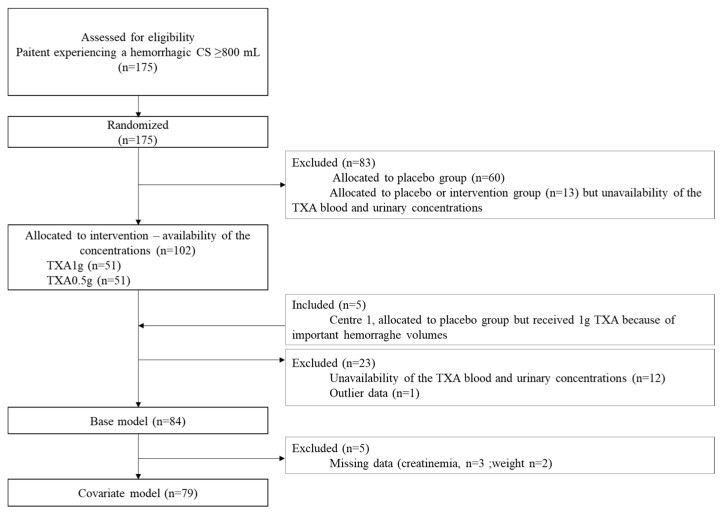
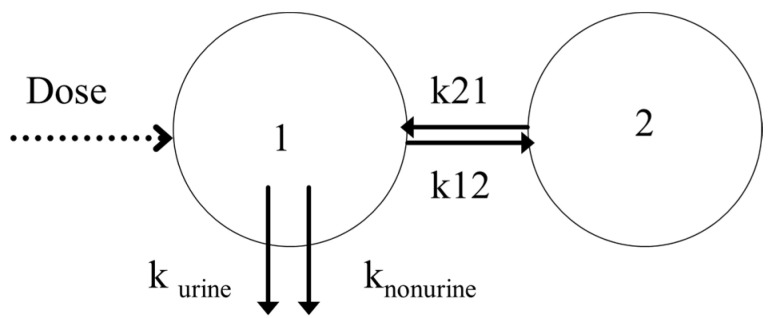
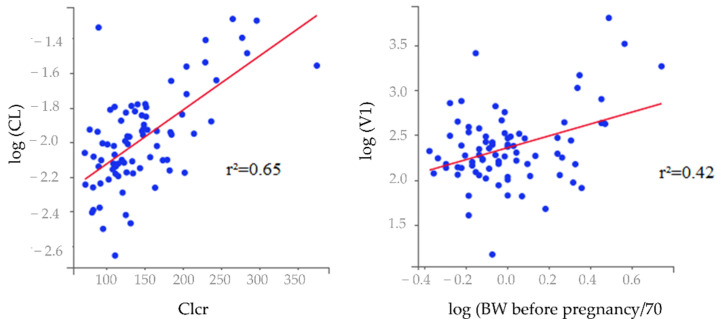
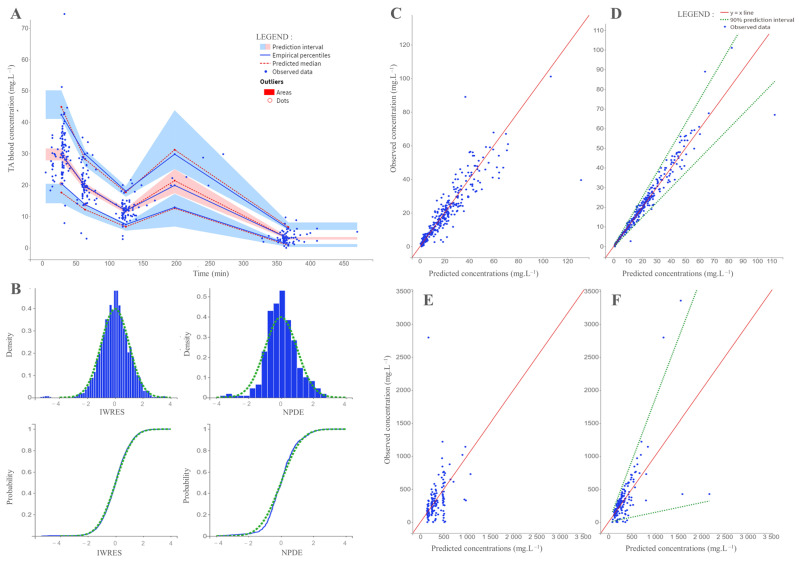
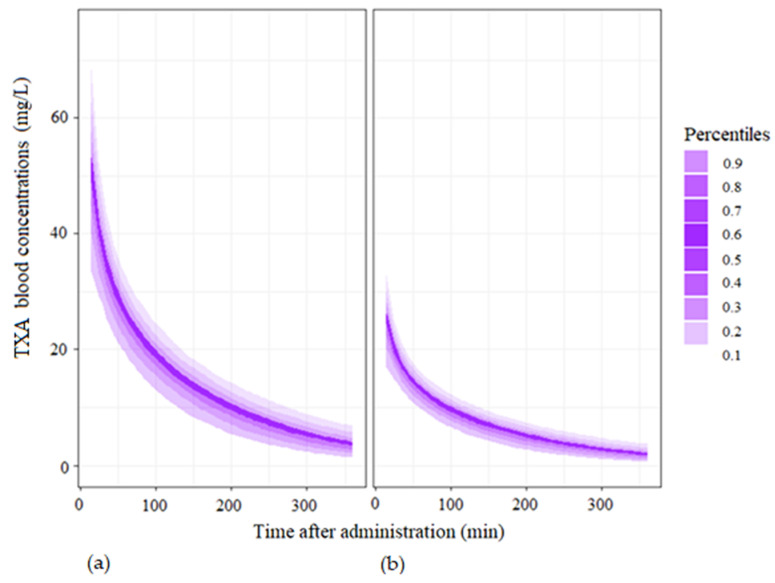
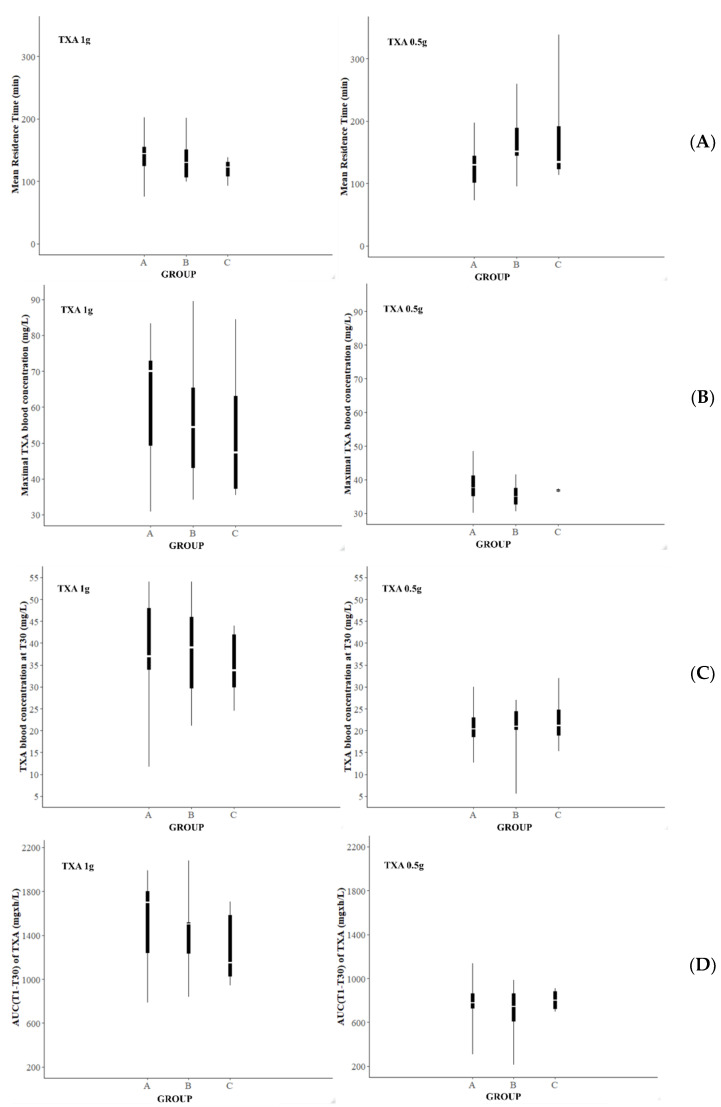
The aim of this study was to evaluate the population pharmacokinetics of tranexamic acid (TXA) administered intravenously at a single dose of 0.5 or 1 g in parturients undergoing active hemorrhagic cesarean delivery and to evaluate the influence of patient variables on TXA pharmacokinetics. Subjects from three recruiting centers were included in this PK sub-study if randomized in the experimental group (i.v TXA 0.5 g or 1 g over one minute) of the TRACES study. Blood samples and two urinary samples were collected within 6 h after TXA injection. Parametric non-linear mixed-effect modeling (Monolix v2020R1) was computed. The final covariate model building used 315 blood and 117 urinary concentrations from seventy-nine patients. A two-compartment model with a double first-order elimination from the central compartment best described the data. The population estimates of clearance (CL), central volume of distribution (V1), and half-life for a typical 70 kg patient with an estimated renal clearance of 150 mL/min (Cockroft-Gault) were 0.14 L/h, 9.25 L, and 1.8 h. A correlation between estimated creatinine clearance and CL, body weight before pregnancy, and V1 was found and partly explained the PK variability. The final model was internally validated using a 500-run bootstrap. The first population pharmacokinetic model of TXA in active hemorrhagic caesarean section was successfully developed and internally validated.
Keywords: caesarean section; intravenous; pharmacokinetics; postpartum hemorrhage; tranexamic acid.
Conflict of interest statement
The authors declare no conflict of interest. The funders had no role in the design of the study; in the collection, analyses, or interpretation of data; in the writing of the manuscript, or in the decision to publish the results.
Figures
Similar articles
-
Hypothesis for a partially non urinary elimination of tranexamic acid in haemorrhagic caesarean section: Traces pilot pharmacokinetic study: Pharmacokinetics of tranexamic acid in obstetrics.Eur J Pharm Sci. 2020 Oct 1;153:105486. doi: 10.1016/j.ejps.2020.105486. Epub 2020 Jul 24. Eur J Pharm Sci. 2020. PMID: 32717429
-
Population pharmacokinetics of tranexamic acid in paediatric patients undergoing craniosynostosis surgery.Clin Pharmacokinet. 2013 Apr;52(4):267-76. doi: 10.1007/s40262-013-0033-1. Clin Pharmacokinet. 2013. PMID: 23371895 Clinical Trial.
-
Population pharmacokinetics and pharmacodynamics of Tranexamic acid in women undergoing caesarean delivery.Br J Clin Pharmacol. 2021 Sep;87(9):3531-3541. doi: 10.1111/bcp.14767. Epub 2021 Mar 8. Br J Clin Pharmacol. 2021. PMID: 33576009 Free PMC article.
-
Tranexamic acid and blood loss during and after cesarean section: a meta-analysis.J Perinatol. 2015 Oct;35(10):818-25. doi: 10.1038/jp.2015.93. Epub 2015 Jul 30. J Perinatol. 2015. PMID: 26226243 Review.
-
Prophylactic Tranexamic Acid in High-Risk Patients Undergoing Cesarean Delivery: A Systematic Review and Meta-Analysis of Randomized Controlled Trials.AANA J. 2020 Aug;88(4):273-281. AANA J. 2020. PMID: 32718424
Cited by
-
Tranexamic acid dose-response relationship for antifibrinolysis in postpartum haemorrhage during Caesarean delivery: TRACES, a double-blind, placebo-controlled, multicentre, dose-ranging biomarker study.Br J Anaesth. 2022 Dec;129(6):937-945. doi: 10.1016/j.bja.2022.08.033. Epub 2022 Oct 13. Br J Anaesth. 2022. PMID: 36243576 Free PMC article. Clinical Trial.
-
Evaluating Tranexamic Acid Dosing Strategies for Postpartum Hemorrhage: A Population Pharmacokinetic Approach in Pregnant Individuals.J Clin Pharmacol. 2025 May 19:10.1002/jcph.70031. doi: 10.1002/jcph.70031. Online ahead of print. J Clin Pharmacol. 2025. PMID: 40384366 Free PMC article.
-
The Impact of Tranexamic Acid on Blood Loss Management in Primary Total Knee Arthroplasty: A Comprehensive Review.Cureus. 2024 Jul 25;16(7):e65386. doi: 10.7759/cureus.65386. eCollection 2024 Jul. Cureus. 2024. PMID: 39184800 Free PMC article. Review.
-
Effect of preoperative prophylactic intravenous tranexamic acid on perioperative blood loss control in patients undergoing cesarean delivery: a systematic review and meta-analysis.BMC Pregnancy Childbirth. 2023 Jun 6;23(1):420. doi: 10.1186/s12884-023-05753-9. BMC Pregnancy Childbirth. 2023. PMID: 37280562 Free PMC article.
-
Fibrinolytic-deficiencies predispose hosts to septicemia from a catheter-associated UTI.Nat Commun. 2024 Mar 27;15(1):2704. doi: 10.1038/s41467-024-46974-6. Nat Commun. 2024. PMID: 38538626 Free PMC article.
References
-
- Kassebaum N.J., Barber R.M., Bhutta Z.A., Dandona L., Gething P.W., Hay S.I., Kinfu Y., Larson H.J., Liang X., Lim S.S., et al. Global, regional, and national levels of maternal mortality, 1990–2015: A systematic analysis for the Global Burden of Disease Study 2015. Lancet. 2016;388:1775–1812. doi: 10.1016/S0140-6736(16)31470-2. - DOI - PMC - PubMed
Grants and funding
LinkOut - more resources
Full Text Sources
