. 2022 Feb 27;10(3):519.
doi: 10.3390/microorganisms10030519.

Early Antibiotic Exposure Alters Intestinal Development and Increases Susceptibility to Necrotizing Enterocolitis: A Mechanistic Study

Affiliations

Early Antibiotic Exposure Alters Intestinal Development and Increases Susceptibility to Necrotizing Enterocolitis: A Mechanistic Study

Hala Chaaban et al. Microorganisms. .

Abstract

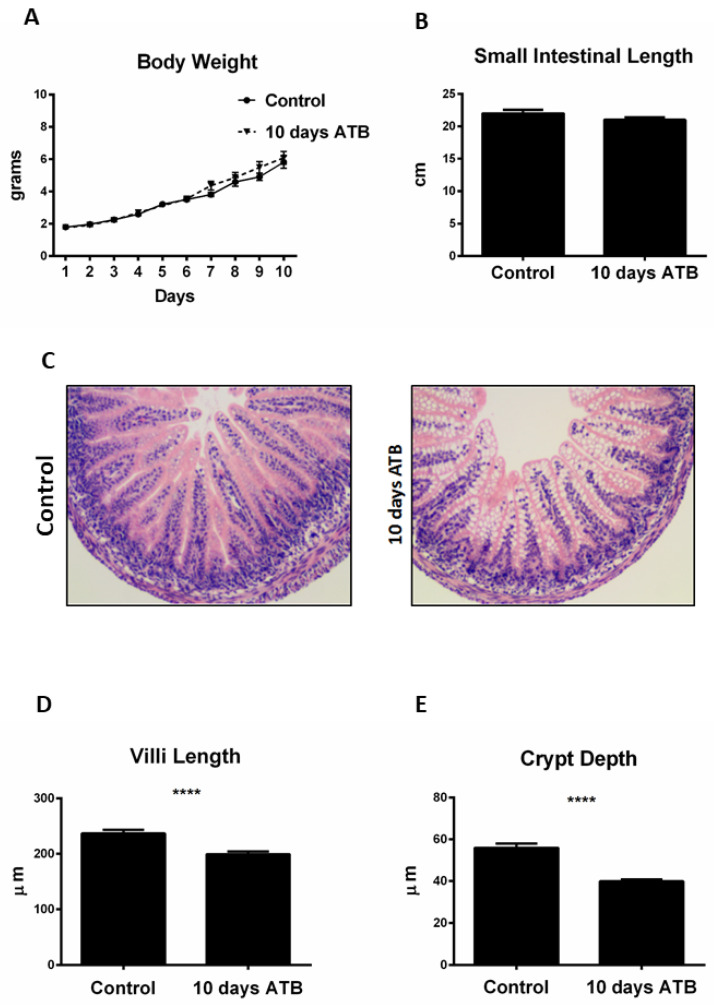
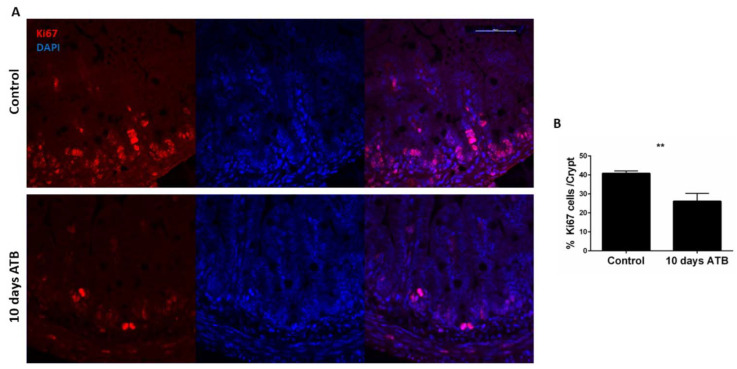
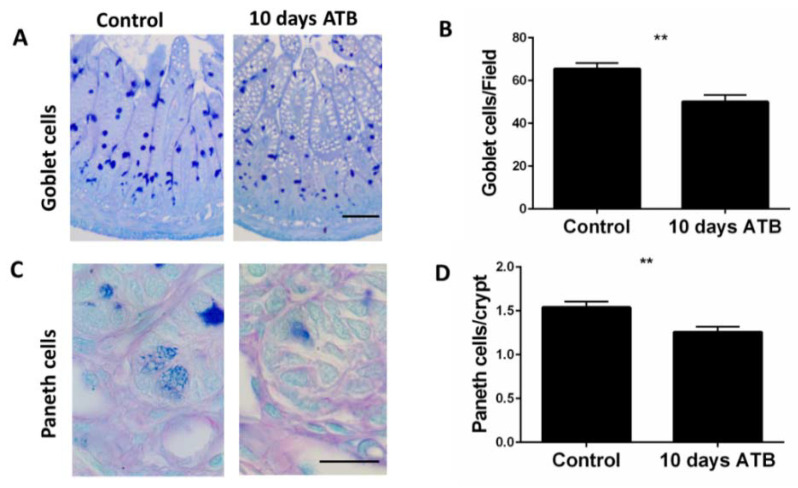
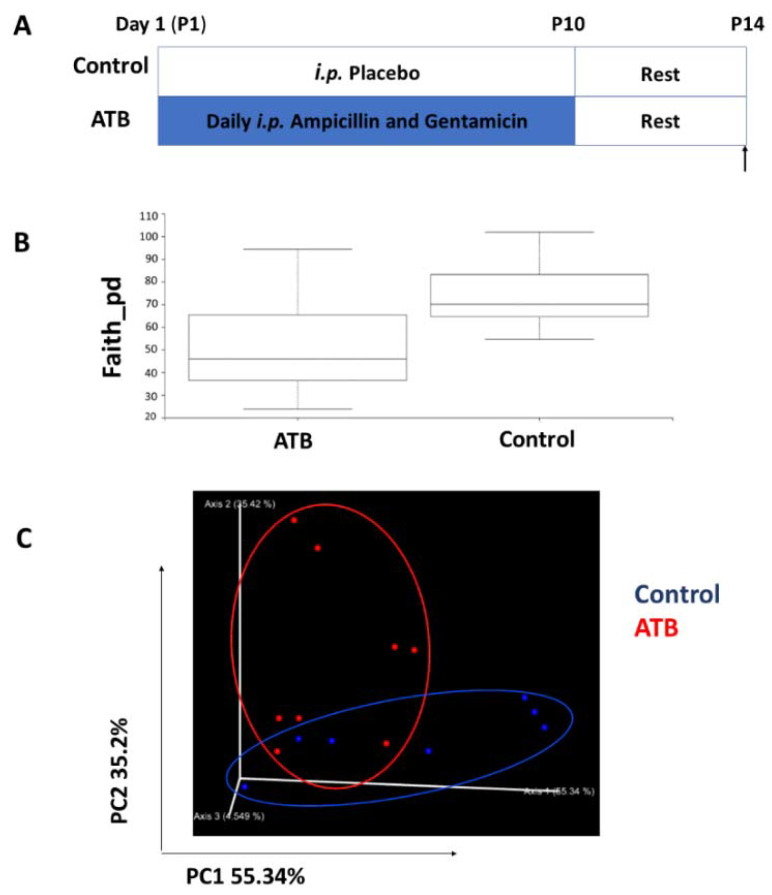
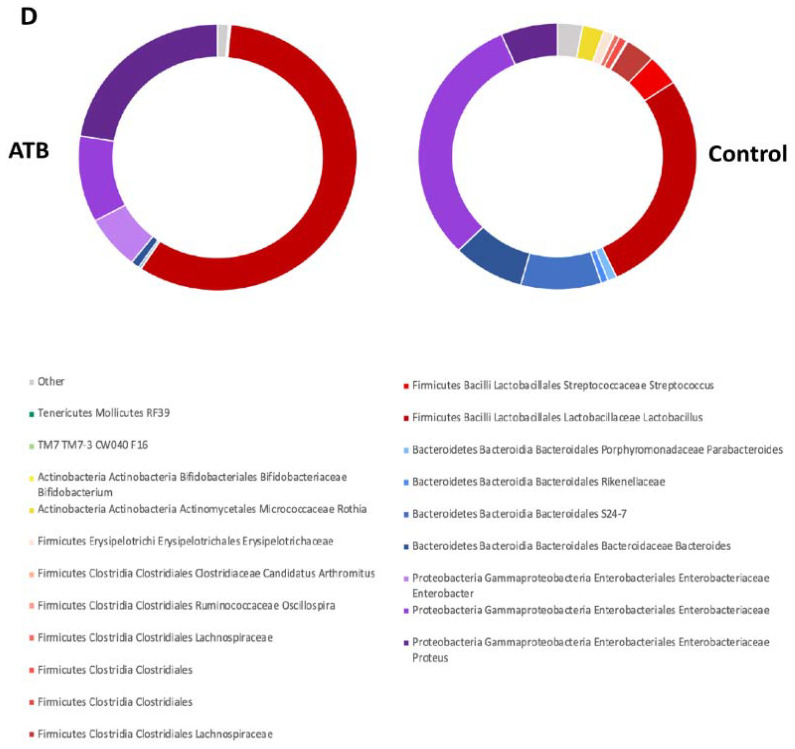
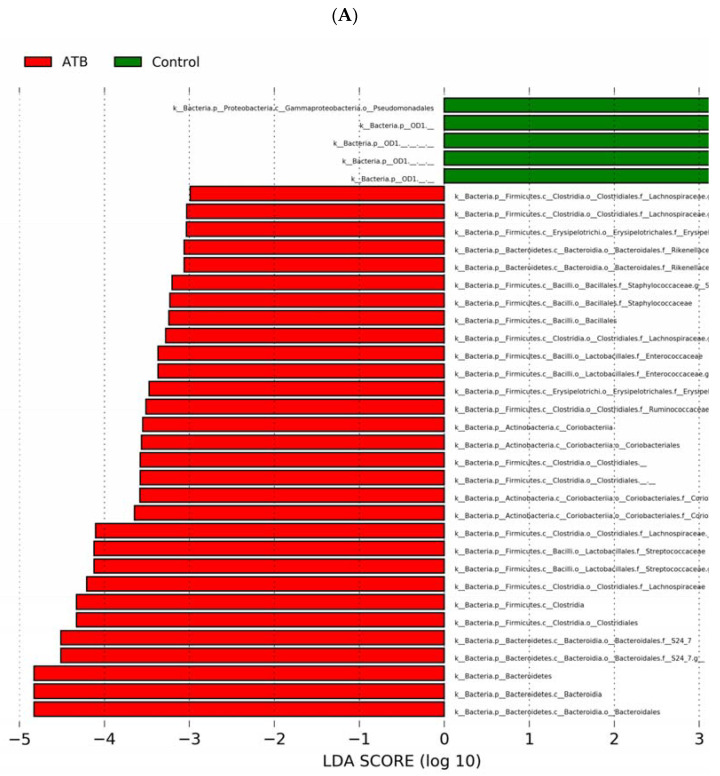
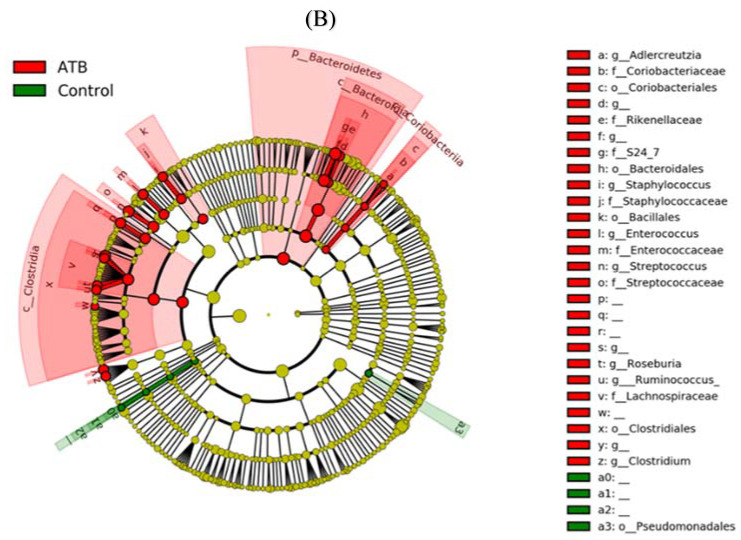
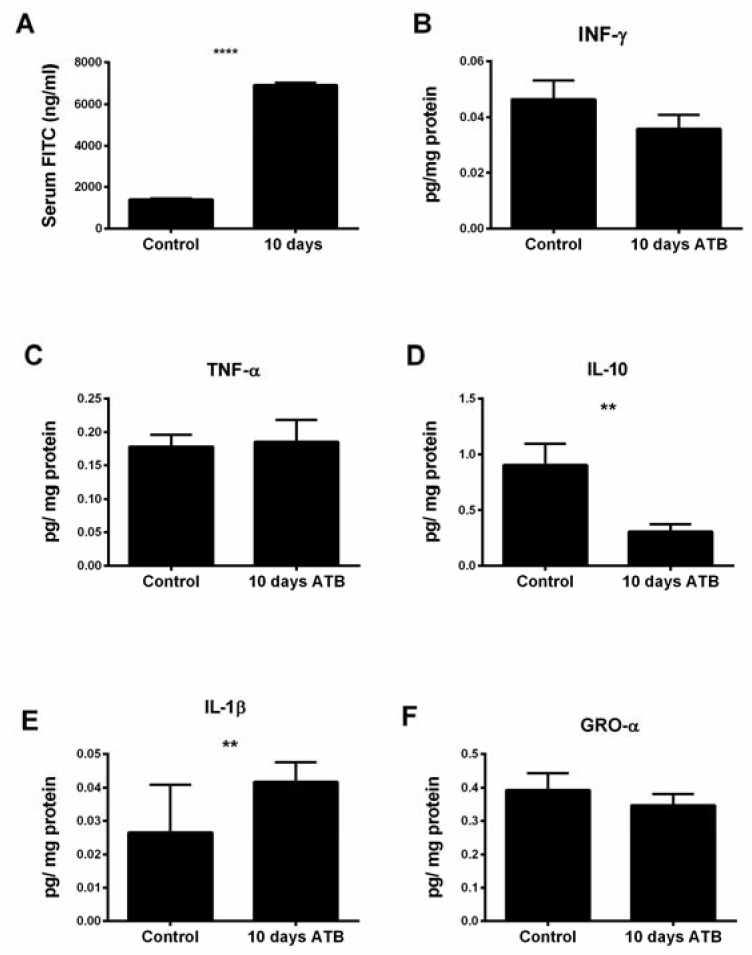
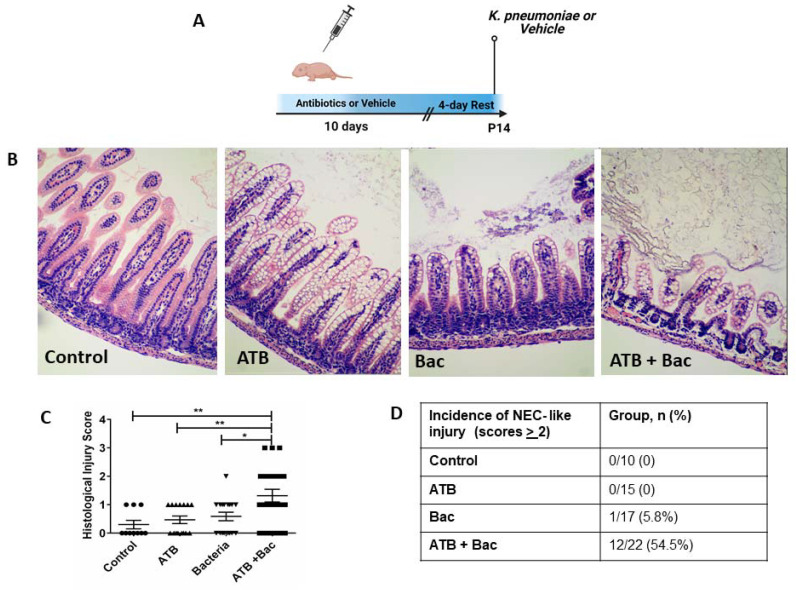
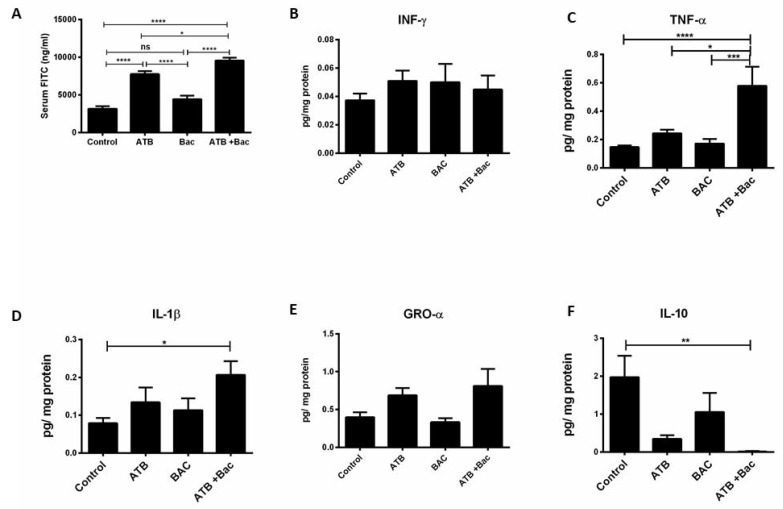
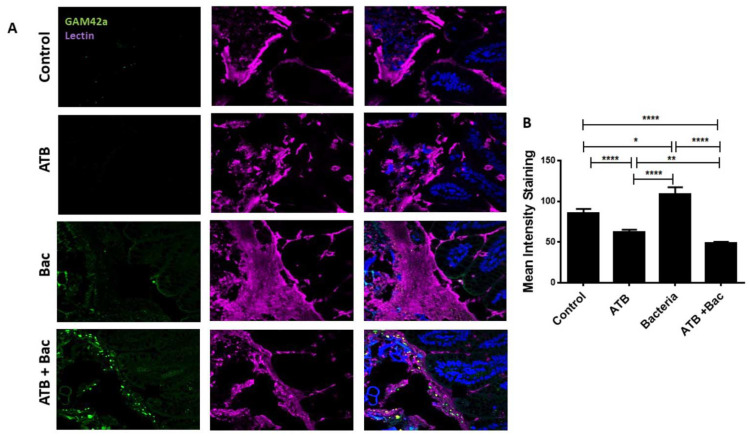
Increasing evidence suggests that prolonged antibiotic therapy in preterm infants is associated with increased mortality and morbidities, such as necrotizing enterocolitis (NEC), a devastating gastrointestinal pathology characterized by intestinal inflammation and necrosis. While a clinical correlation exists between antibiotic use and the development of NEC, the potential causality of antibiotics in NEC development has not yet been demonstrated. Here, we tested the effects of systemic standard-of-care antibiotic therapy for ten days on intestinal development in neonatal mice. Systemic antibiotic treatment impaired the intestinal development by reducing intestinal cell proliferation, villi height, crypt depth, and goblet and Paneth cell numbers. Oral bacterial challenge in pups who received antibiotics resulted in NEC-like intestinal injury in more than half the pups, likely due to a reduction in mucous-producing cells affecting microbial-epithelial interactions. These data support a novel mechanism that could explain why preterm infants exposed to prolonged antibiotics after birth have a higher incidence of NEC and other gastrointestinal disorders.

Keywords: antibiotics; intestinal development; intestinal permeability; microbiome; necrotizing enterocolitis; preterm infant.


Conflict of interest statement

The authors declare no conflict of interest. The funders had no role in the design of the study; in the collection, analyses, or interpretation of data; in the writing of the manuscript, or in the decision to publish the results.

Figures

Figure 1
Figure 1
ATB treatment negatively impacts villi length and crypt depth. (A) Effect of ATB for 10 days on mouse pup body weights and (B) small intestinal lengths. (C) Representative hematoxylin and eosin ileal sections from both groups. ATB treatment is associated with shorter villi length (D) and crypt depth (E) measured in µm (n > 50 crypts and villi; **** p < 0.0001). Data presented as mean ± SEM. ATB: antibiotic treatment.
Figure 2
Figure 2
Effect of systemic ATB on intestinal epithelial proliferation. (A) Immunostaining of ileal sections from pups in control and ATB groups with antibody against Ki67 (red), and DAPI (blue). Magnification × 100, scale bar 100 µm. (B) Quantification (n > 50 crypts; ** p = 0.002) of Ki67 staining per crypt in both groups. Data presented as mean ± SEM. ATB: antibiotics.
Figure 3
Figure 3
Effect of systemic ATB on goblet cell and Paneth cell numbers. Representative PAS staining and corresponding quantification of numbers of goblet cells per field ((A,B) ** p =0.0014). Magnification: 20×; scale bar: 50 µm. Representative images for Paneth cells, identified by the distinct secretory granules, and corresponding quantification of numbers per crypt ((C,D) ** p = 0.001). Magnification: 40×; scale bar: 20 µm. Data presented as mean ± SEM. ATB: antibiotics.
Figure 4
Figure 4
Analysis of cecal microbiota composition between groups. (A) Mouse pups were given ATB i.p. once daily for 10 days, and cecal contents were collected at P14, after a 4-day recovery. (B) Faith’s phylogenetic diversity metric displays species richness of mouse pups differentiated by treatment (Kruskal–Wallis p = 0.0491). (C) PCoA plot displaying Bray–Curtis beta diversity matrix (Control = blue; ATB = red). Percent confidence values for each distance matrix are displayed on the axes in two dimensions. PERMANOVA results: F = 3.10; p = 0.037. (D) Taxonomy plots were generated using a Naïve Bayes classifier trained on the most recent Greengenes 16S rRNA database. ASV reads were taxonomically classified and filtered for genera > 0.5% of total microbiome composition for any one sample. Genera falling below the 0.5% mark were placed in “other” (grey). ATB: antibiotics; PCoA: principal components analysis.
Figure 4
Figure 4
Analysis of cecal microbiota composition between groups. (A) Mouse pups were given ATB i.p. once daily for 10 days, and cecal contents were collected at P14, after a 4-day recovery. (B) Faith’s phylogenetic diversity metric displays species richness of mouse pups differentiated by treatment (Kruskal–Wallis p = 0.0491). (C) PCoA plot displaying Bray–Curtis beta diversity matrix (Control = blue; ATB = red). Percent confidence values for each distance matrix are displayed on the axes in two dimensions. PERMANOVA results: F = 3.10; p = 0.037. (D) Taxonomy plots were generated using a Naïve Bayes classifier trained on the most recent Greengenes 16S rRNA database. ASV reads were taxonomically classified and filtered for genera > 0.5% of total microbiome composition for any one sample. Genera falling below the 0.5% mark were placed in “other” (grey). ATB: antibiotics; PCoA: principal components analysis.
Figure 5
Figure 5
LEfSe analysis of cecal microbiome from mouse pups in control and ATB groups. (A) LDA scores of significantly different bacteria between control (green) and ATB-treated (red) pups. (B) Cladogram utilizing LEfSe indicates the phylogenetic distribution of fecal microbes associated with the control (green) and ATB-treated (red) pups. ATB: antibiotics; LEfSe: linear discriminant analysis effect size; LDA: linear discriminant analysis.
Figure 5
Figure 5
LEfSe analysis of cecal microbiome from mouse pups in control and ATB groups. (A) LDA scores of significantly different bacteria between control (green) and ATB-treated (red) pups. (B) Cladogram utilizing LEfSe indicates the phylogenetic distribution of fecal microbes associated with the control (green) and ATB-treated (red) pups. ATB: antibiotics; LEfSe: linear discriminant analysis effect size; LDA: linear discriminant analysis.
Figure 6
Figure 6
Effect of systemic antibiotics on intestinal permeability and ileal cytokine expression. (A) Serum FITC-dextran concentrations in pups in control and ATB groups; **** p < 0.0001. (BF) Ileal cytokine expression from pups in control and ATB groups; ** p < 0.01. Values denote mean ± SEM (n ≥ 6). ATB: antibiotics; FITC: fluorescein isothiocyanate; IFN: interferon; IL: interleukin; GRO: growth-regulated oncogene.
Figure 7
Figure 7
ATB treatment for 10 days increases susceptibility to bacteria-induced intestinal injury. (A) Experimental design. (B) Representative hematoxylin and eosin ileal sections from control, ATB, Bac, and AT + Bac groups. Magnification: 20×. (C) NEC-like histological injury scoring; ** p < 0.01, * p < 0.05. (D) Incidence of NEC-like intestinal injury score >2 among groups. Scores were determined by a blinded investigator. Values denote mean ± SEM. ATB: antibiotics; Bac: bacteria.
Figure 8
Figure 8
Effect of systemic antibiotics on intestinal permeability and ileal cytokine expression. (A) Serum FITC concentration in control, ATB, Bac, and AT + Bac pups; * p < 0.05, **** p < 0.0001. (BF) Ileal cytokine expression from pups in the four groups; * p < 0.05, ** p < 0.01, *** p < 0.001, **** p < 0.0001. Values denote mean ± SEM (n ≥ 10). ATB: antibiotics; Bac: bacteria; IFN: interferon; IL: interleukin; GRO: growth-regulated oncogene.
Figure 9
Figure 9
ATB treatment is associated with a thinning of the mucus layer and enhanced bacterial–epithelial interaction. (A) Representative images show dual staining for UEA1 lectin (purple) and bacteria (FITC, green). Blue, DAPI for nuclear staining. (B) Mean fluorescence intensity for lectin relative to DAPI was measured for each group using ImageJ software. * p < 0.05, ** p < 0.01, **** p < 0.0001. Values denote mean ± SEM. ATB: antibiotics; Bac: bacteria; UEA1: ulex europaeus agglutinin 1; FITC: fluorescein isothiocyanate; DAPI: 4′,6-diamidino-2-phenylindole; SEM: standard error of the mean.

Similar articles

Cited by

References

    1. Pácha J. Development of Intestinal Transport Function in Mammals. Physiol. Rev. 2000;80:1633–1667. doi: 10.1152/physrev.2000.80.4.1633. - DOI - PubMed
    1. He W., Wang M.L., Jiang H.Q., Steppan C.M., Shin M.E., Thurnheer M.C., Cebra J.J., Lazar M.A., Wu G.D. Bacterial colonization leads to the colonic secretion of RELMbeta/FIZZ2, a novel goblet cell-specific protein. Gastroenterology. 2003;125:1388–1397. doi: 10.1016/j.gastro.2003.07.009. - DOI - PubMed
    1. Bergström A., Kristensen M.B., Bahl M.I., Metzdorff S.B., Fink L.N., Frøkiaer H., Licht T.R. Nature of bacterial colonization influences transcription of mucin genes in mice during the first week of life. BMC Res. Notes. 2012;5:402. doi: 10.1186/1756-0500-5-402. - DOI - PMC - PubMed
    1. Yu Y., Lu L., Sun J., Petrof E.O., Claud E.C. Preterm infant gut microbiota affects intestinal epithelial development in a humanized microbiome gnotobiotic mouse model. Am. J. Physiol. Gastrointest. Liver Physiol. 2016;311:G521–G532. doi: 10.1152/ajpgi.00022.2016. - DOI - PMC - PubMed
    1. Underwood M.A., Mukhopadhyay S., Lakshminrusimha S., Bevins C.L. Neonatal intestinal dysbiosis. J. Perinatol. 2020;40:1597–1608. doi: 10.1038/s41372-020-00829-2. - DOI - PMC - PubMed