

Relevance of the Spectral Analysis Method of Tilted Fiber Bragg Grating-Based Biosensors: A Case-Study for Heart Failure Monitoring
- PMID: 35336312
- PMCID: PMC8954114
- DOI: 10.3390/s22062141
Relevance of the Spectral Analysis Method of Tilted Fiber Bragg Grating-Based Biosensors: A Case-Study for Heart Failure Monitoring
Abstract
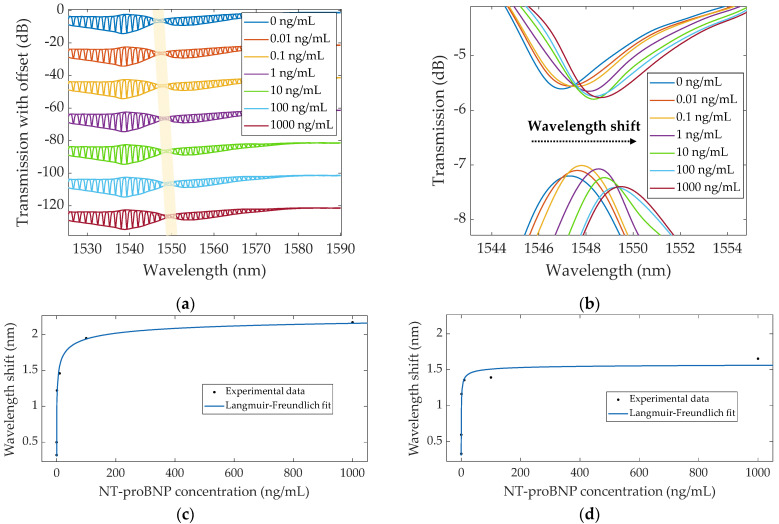
Optical fiber technology has rapidly progressed over the years, providing valuable benefits for biosensing purposes such as sensor miniaturization and the possibility for remote and real-time monitoring. In particular, tilted fiber Bragg gratings (TFBGs) are extremely sensitive to refractive index variations taking place on their surface. The present work comprises a case-study on the impact of different methods of analysis applied to decode spectral variations of bare and plasmonic TFBGs during the detection of N-terminal B-type natriuretic peptide (NT-proBNP), a heart failure biomarker, namely by following the most sensitive mode, peaks of the spectral envelopes, and the envelopes' crossing point and area. Tracking the lower envelope resulted in the lowest limits of detection (LOD) for bare and plasmonic TFBGs, namely, 0.75 ng/mL and 0.19 ng/mL, respectively. This work demonstrates the importance of the analysis method on the outcome results, which is crucial to attain the most reliable and sensitive method with lower LOD sensors. Furthermore, it makes the scientific community aware to take careful attention when comparing the performance of different biosensors in which different analysis methods were used.
Keywords: NT-proBNP; biosensors; cardiac biomarker; optical fiber sensors; spectral demodulation methods; surface plasmon resonance (SPR).
Conflict of interest statement
The authors declare no conflict of interest.
Figures


Similar articles
-
Detection of NT-proBNP Using Optical Fiber Back-Reflection Plasmonic Biosensors.Biosensors (Basel). 2024 Apr 4;14(4):173. doi: 10.3390/bios14040173. Biosensors (Basel). 2024. PMID: 38667166 Free PMC article.
-
Highly sensitive detection of molecular interactions with plasmonic optical fiber grating sensors.Biosens Bioelectron. 2014 Jan 15;51:249-54. doi: 10.1016/j.bios.2013.07.030. Epub 2013 Jul 19. Biosens Bioelectron. 2014. PMID: 23973934
-
Cytokeratins Biosensing Using Tilted Fiber Gratings.Biosensors (Basel). 2018 Aug 3;8(3):74. doi: 10.3390/bios8030074. Biosensors (Basel). 2018. PMID: 30081506 Free PMC article.
-
Towards a Uniform Metrological Assessment of Grating-Based Optical Fiber Sensors: From Refractometers to Biosensors.Biosensors (Basel). 2017 Jun 21;7(2):23. doi: 10.3390/bios7020023. Biosensors (Basel). 2017. PMID: 28635665 Free PMC article. Review.
-
Overview of Recent Advances in the Design of Plasmonic Fiber-Optic Biosensors.Biosensors (Basel). 2020 Jul 9;10(7):77. doi: 10.3390/bios10070077. Biosensors (Basel). 2020. PMID: 32660135 Free PMC article. Review.
Cited by
-
Applications of Optical Fiber in Label-Free Biosensors and Bioimaging: A Review.Biosensors (Basel). 2022 Dec 30;13(1):64. doi: 10.3390/bios13010064. Biosensors (Basel). 2022. PMID: 36671899 Free PMC article. Review.
-
Detection of NT-proBNP Using Optical Fiber Back-Reflection Plasmonic Biosensors.Biosensors (Basel). 2024 Apr 4;14(4):173. doi: 10.3390/bios14040173. Biosensors (Basel). 2024. PMID: 38667166 Free PMC article.
-
Multifunctional Integration of Optical Fibers and Nanomaterials for Aircraft Systems.Materials (Basel). 2023 Feb 8;16(4):1433. doi: 10.3390/ma16041433. Materials (Basel). 2023. PMID: 36837063 Free PMC article. Review.
References
-
- Soler M., Lechuga L.M. Principles, technologies, and applications of plasmonic biosensors. J. Appl. Phys. 2021;129:111102. doi: 10.1063/5.0042811. - DOI
-
- Leitão C., Pereira S.O., Alberto N., Lobry M., Loyez M., Florinda M., Pinto J.L., Caucheteur C., Marques C. Cortisol in-fiber ultrasensitive plasmonic immunosensing. IEEE Sens. J. 2021;21:3028–3034. doi: 10.1109/JSEN.2020.3025456. - DOI
MeSH terms
Grants and funding
LinkOut - more resources
Full Text Sources
Medical
Research Materials
