. 2022 Mar 10;22(6):2157.
doi: 10.3390/s22062157.

Shedding Light on Capillary-Based Backscattering Interferometry

Affiliations

Shedding Light on Capillary-Based Backscattering Interferometry

Niall M C Mulkerns et al. Sensors (Basel). .

Abstract

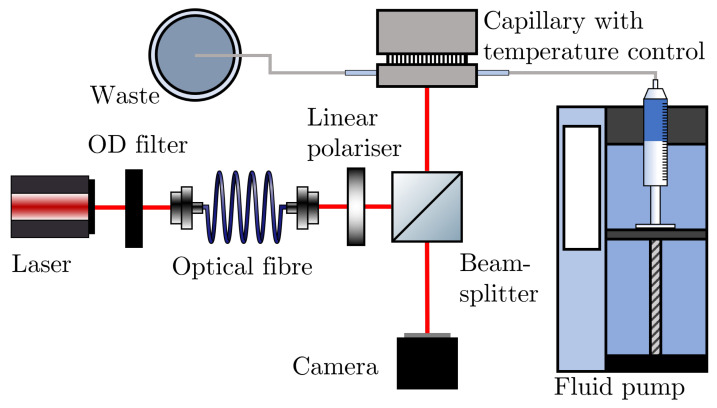
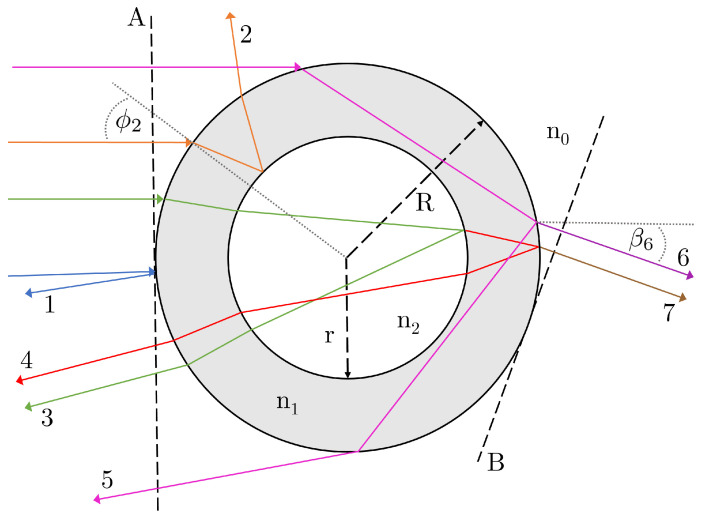
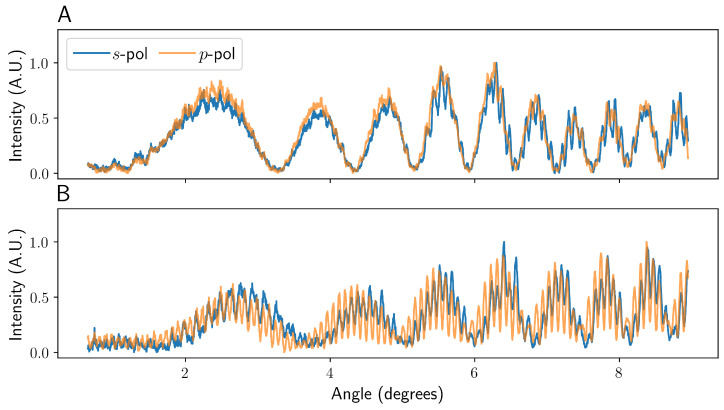
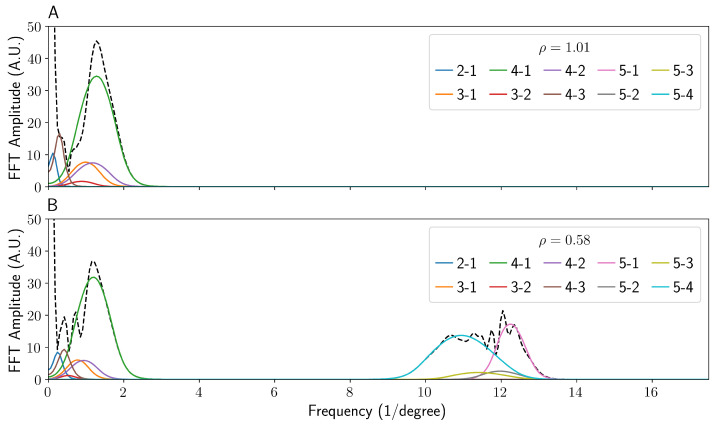
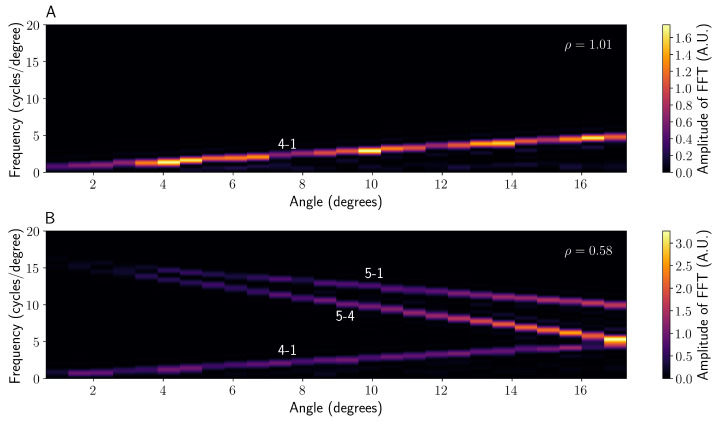
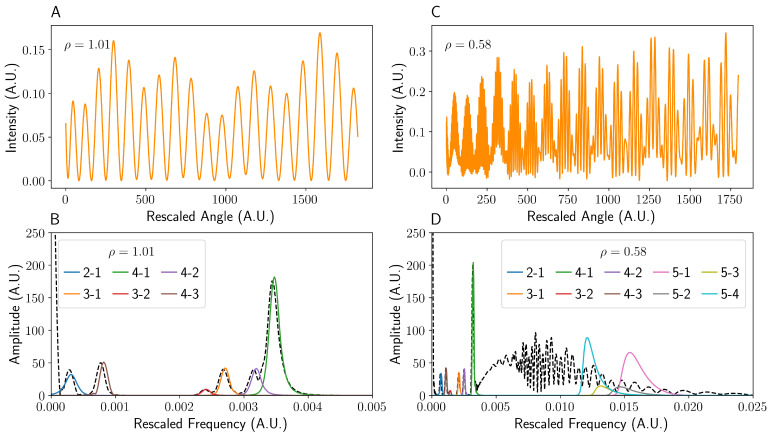
Capillary-based backscattering interferometry has been used extensively as a tool to measure molecular binding via interferometric refractive index sensing. Previous studies have analysed the fringe patterns created in the backscatter direction. However, polarisation effects, spatial chirps in the fringe pattern and the practical impact of various approximations, and assumptions in existing models are yet to be fully explored. Here, two independent ray tracing approaches are applied, analysed, contrasted, compared to experimental data, and improved upon by introducing explicit polarisation dependence. In doing so, the significance of the inner diameter, outer diameter, and material of the capillary to the resulting fringe pattern and subsequent analysis are elucidated for the first time. The inner diameter is shown to dictate the fringe pattern seen, and therefore, the effectiveness of any dechirping algorithm, demonstrating that current dechirping methods are only valid for a subset of capillary dimensions. Potential improvements are suggested in order to guide further research, increase sensitivity, and promote wider applicability.

Keywords: backscattering interferometry; capillary; ray tracing; refractive index.


Conflict of interest statement

The authors declare no conflict of interest.

Figures

Figure 1
Figure 1
A schematic diagram of the backscattering interferometry apparatus used in this work.
Figure 2
Figure 2
A diagram showing the different first-order rays that are possible in the capillary geometry of BSI. The incident angle of a given ray ϕi is simply the angle to the surface normal. In the Xu/You et al.’s methodology, the angle of incidence is related to the viewing angle βi of each ray, where βi is defined to be the angle to the horizontal in this geometry. The example of β6 is shown here. The diagram is adapted from that in You et al. [20]. The rays are demonstrative and not drawn with geometric accuracy.
Figure 3
Figure 3
A graph showing the change of fi with incident angle as set out in Equation (3). All rays excluding ray 5 and ray 6 are shown here due to suppression from the capillary geometry considered. Parameters used were r/R = 0.74, n1 = 1.457, n2 = 1.333. The cut off for rays 3, 4, and 7 at ϕi70° is due to these rays being unable to enter the core above this angle.
Figure 4
Figure 4
A graph showing the simulated intensity patterns seen for a capillary higher (A) and lower (B) than the ρ = 1 limit for both s- and p-polarised incident light. The data were taken 9 cm horizontally and 0.75 cm vertically from the capillary, with a simulated camera width of 1.3 cm. The angle is given in degrees from β = π. The data have been normalised between 0 and 1 to aid comparison.
Figure 5
Figure 5
A figure showing the experimental intensity patterns seen for a capillary both higher (A) and lower (B) than the ρ = 1 limit. The data were taken at ∼9 cm horizontally and ∼0.75 cm vertically from the capillary, with a camera width of 1.3 cm. The data were longitudinally averaged to reduce high-frequency noise and produce a more representative fringe pattern [13]. The data have been normalised between 0 and 1 to aid comparison.
Figure 6
Figure 6
A graph comparing the Fourier transforms of both the high (A) and low (B) ρ values. The data were taken at 10 cm horizontally and 1 cm vertically from the capillary with a fixed camera width of 1.3 cm. The black dashed lines show the overall Fourier transforms of the patterns shown in Figure 4, with each pairwise interference term transformed and shown separately. For example, the interference between rays 1 and 2 is shown in blue and labelled 2-1. The data were windowed and zero-padded to reduce ringing and other artefacts after transformation.
Figure 7
Figure 7
A spectrogram showing the rolling Fourier transform of the unchirped fringe pattern for both ρ > 1 (A) and ρ < 1 (B). Each distinct chirp rate αij is labelled with the corresponding beams that constitute it, e.g., 4-1 is the interference between rays 4 and 1.
Figure 8
Figure 8
A series of graphs showing how dechirping of the interference pattern affects the Fourier domain. As can be seen in (A,B), the dechirping of the high ρ fringe pattern (A) leads to equally spaced fringes as well a Fourier transform that is the convolution of the pairwise interference terms (B). On the other hand, the dechirping of the low ρ intensity pattern (C) does not aid in the reconstruction of the beam 5 terms (D) due to its differing chirp frequency (see Figure 7). The black dashed line in (B,D) denotes the Fourier transform of the overall dechirped fringe patterns (A,C). For brevity, interference between beams i and j is denoted ij. The data were windowed and zero-padded to reduce ringing and other artefacts after transformation, before finally dechirping.

References

    1. Bornhop D.J., Dovichi N.J. Simple Nanoliter Refractive Index Detector. Anal. Chem. 1986;58:504–505. doi: 10.1021/ac00293a057. - DOI
    1. Bornhop D.J., Latham J.C., Kussrow A., Markov D.A., Jones R.D., Sørensen H.S. Free-solution, label-free molecular interactions studied by back-scattering interferometry. Science. 2007;317:1732–1736. doi: 10.1126/science.1146559. - DOI - PubMed
    1. Wang Z., Bomhop D.J. Dual-capillary backscatter interferometry for high-sensitivity nanoliter-volume refractive index detection with density gradient compensation. Anal. Chem. 2005;77:7872–7877. doi: 10.1021/ac050752h. - DOI - PubMed
    1. Kammer M.N., Kussrow A.K., Olmsted I.R., Bornhop D.J. A Highly Compensated Interferometer for Biochemical Analysis. ACS Sens. 2018;3:1546–1552. doi: 10.1021/acssensors.8b00361. - DOI - PubMed
    1. Dunn R.C. Wavelength Modulated Back-Scatter Interferometry for Universal, On-Column Refractive Index Detection in Picoliter Volumes. Anal. Chem. 2018;90:6789–6795. doi: 10.1021/acs.analchem.8b00771. - DOI - PubMed

LinkOut - more resources