Review
. 2022 Mar 16;11(3):454.
doi: 10.3390/biology11030454.

Advanced Diffusion MRI of the Visual System in Glaucoma: From Experimental Animal Models to Humans

Affiliations
Review

Advanced Diffusion MRI of the Visual System in Glaucoma: From Experimental Animal Models to Humans

Monica Mendoza et al. Biology (Basel). .

Abstract

Glaucoma is a group of ophthalmologic conditions characterized by progressive retinal ganglion cell death, optic nerve degeneration, and irreversible vision loss. While intraocular pressure is the only clinically modifiable risk factor, glaucoma may continue to progress at controlled intraocular pressure, indicating other major factors in contributing to the disease mechanisms. Recent studies demonstrated the feasibility of advanced diffusion magnetic resonance imaging (dMRI) in visualizing the microstructural integrity of the visual system, opening new possibilities for non-invasive characterization of glaucomatous brain changes for guiding earlier and targeted intervention besides intraocular pressure lowering. In this review, we discuss dMRI methods currently used in visual system investigations, focusing on the eye, optic nerve, optic tract, subcortical visual brain nuclei, optic radiations, and visual cortex. We evaluate how conventional diffusion tensor imaging, higher-order diffusion kurtosis imaging, and other extended dMRI techniques can assess the neuronal and glial integrity of the visual system in both humans and experimental animal models of glaucoma, among other optic neuropathies or neurodegenerative diseases. We also compare the pros and cons of these methods against other imaging modalities. A growing body of dMRI research indicates that this modality holds promise in characterizing early glaucomatous changes in the visual system, determining the disease severity, and identifying potential neurotherapeutic targets, offering more options to slow glaucoma progression and to reduce the prevalence of this world's leading cause of irreversible but preventable blindness.

Keywords: diffusion; eye; glaucoma; magnetic resonance imaging; optic nerve; visual pathway.


Conflict of interest statement

The authors declare no conflict of interest.

Figures
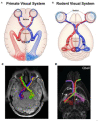
Figure 1
Figure 1
Representative illustrations (top) and diffusion MRI tractography (bottom) of primate (A,C) and rodent (B,D) visual systems. Visual structures including the retina, optic nerve (ON), optic chiasm (OC), optic tracts (OT), lateral geniculate nucleus (LGN), superior colliculus (SC), and visual cortex (VC) are labeled in the illustrations (top). Images are adapted with permission from Deng et al. [36]). Red and blue fiber tracts (A,B) represent proportion of projections from the left (L) and right (R) VC, respectively. Note the larger proportion of ON decussation in rodents than primates at the OC. Human optic nerve tractography (C) can depict both crossing (blue/green) and ipsilateral (red/yellow) projections. Image is adapted with permission from He et al. [37]. The mouse brain q-ball tractography (D) also demonstrates ipsilateral and contralateral projections at the optic nerve (white arrowhead), whereas white arrows and asterisk indicate areas where the model fitting fails. Image is adapted with permission from Moldrich et al. [38].
Figure 2
Figure 2
Anatomical MRI of the optic nerve (A, green arrows) and optic chiasm (D, red arrows) during early (B,E) and advanced stage (C,F) glaucoma. Image accreditation to Kasi et al. [51].
Figure 3
Figure 3
Reduction in fractional anisotropy in the outer retina layers of rd1 mice (A2,B2) relative to wild-type controls (A1,B1) (red vectors), consistent with histological evidence of photoreceptor layer deterioration. Images are adapted with permission from Chen et al. [64].
Figure 4
Figure 4
Whole ovine eye images acquired with T2-weighted MRI (a), color-encoded DTI mapping for fractional anisotropy (b), polarized light microscopy of a histological section (c), and intensity mapping of collagen density (d). Colors in (b) correspond to principal diffusional directions: caudal-rostral (blue), dorsal-ventral (green) and left-right (red). Images are adapted with permission from Ho et al. [73].
Figure 5
Figure 5
Longitudinal DTI at the level of the optic nerve (white rectangle) in the DBA/2J experimental glaucoma mouse model (D2) and healthy C57BL/6J mice (B6). (Left) Color-coded fractional anisotropy (FA) directionality map along caudal-rostral (blue), left-right (red), and dorsal–ventral (green) directions in a D2 mouse at 5 months old (mos). (Right) FA value maps of the D2 and B6 optic nerves from 5 to 12 mos. White arrows point to the deteriorating D2 optic nerves at 9 and 12 mos when intraocular pressure increased alongside the same period. Image adapted with permission from Yang et al. [12].
Figure 6
Figure 6
Changes in DTI parameters at different glaucoma stages. (a) Representative anatomical T1-weighted image from a 65-year-old male with severe glaucoma in the left eye (right side of image), with the optic nerve delineated by the green region of interest. Glaucoma progression is characterized by an increase in mean diffusivity (b) and by a decrease in fractional anisotropy (c) in the optic nerve. Glaucoma subjects were staged according to their visual field mean deviation score (MDS) as (0) increased intraocular pressure without visual field defects, MDS greater than 0 dB; (1) early, with an MDS between −0.01 and −6.00 dB; (2) moderate, with an MDS between −6.01 and −12.00 dB; (3) advanced, with MDS between −12.01 and −20.00 dB, (4) severe, with an MDS greater than −20.01 dB; (5) end-stage glaucoma. Images are reproduced from Garaci et al. [75].
Figure 7
Figure 7
Fractional anisotropy (FA) maps at the level of the optic radiations in glaucoma (left) and healthy control subjects (middle). (Right) Colored maps of group comparisons, estimated with tract-based spatial statistics (TBSS), are overlaid on a standard MNI152 T1 MRI template. Green pixels correspond to the white matter tracts skeleton, and blue pixels correspond to brain regions of reduced FA in advanced glaucoma compared to early glaucoma at the optic radiations (yellow arrows) and frontal lobe white matter (red arrows). Images are reproduced from Murphy et al. [94].
Figure 8
Figure 8
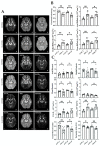
(A) Representative parametric maps of DTI [fractional anisotropy (FA)], DKI [radial kurtosis (RK), axial kurtosis (AK), mean kurtosis (MK)], and WMTI models [axial IAS diffusivity (Da), axial EAS diffusivity (De,//), radial EAS diffusivity (De,), axonal water fraction (AWF), tortuosity of the EAS (ratio of De,// and De,)] from glaucoma and healthy control groups at the level of the optic tracts (arrows). (B,C) Quantitative comparisons of DTI (B) and DKI and WMTI parameters (C) in the left (L) and right (R) optic tracts of glaucoma (Glau) and healthy control (CON) groups. Unpaired t-tests between glaucoma and healthy groups, * p < 0.05; ** p < 0.01; ns: not significant. Images are adapted with permission from Sun et al. [80].
Figure 9
Figure 9
Tract-based spatial statistics (TBSS) of major white matter skeletons (green) demonstrating reduced FA (red and yellow pixels) in the optic tract (OT), optic radiation (OR), and the left superior longitudinal fasciculus (SLF) of early glaucoma patients as compared to healthy controls. Images are adapted with permission from Trivedi et al. [119].
Figure 10
Figure 10
Representative DTI fractional anisotropy (FA) maps of the optic nerve (left panel) and optic tract (right panel) in an untreated rodent group with mild chronic intraocular pressure elevation to the right eye, a citicoline-treated group with mild chronic intraocular pressure elevation to the right eye, and an untreated sham group without intraocular pressure elevation. Top row illustrates the color-coded FA directionality maps, with principal diffusion directions denoted as blue (caudal-rostral), red (left-right direction), and green (dorsal-ventral). White arrows point to left and right optic nerves and optic tracts. Bottom row shows the lower FA in the right optic nerve and left optic tract of the untreated group with mild chronic intraocular pressure elevation relative to the opposite hemisphere. Such contralateral FA differences were not apparent in the other two groups. Images are adapted with permission from van der Merwe et al. [10].

Similar articles

Cited by

References

    1. Tham Y.-C., Li X., Wong T.Y., Quigley H.A., Aung T., Cheng C.-Y. Global Prevalence of Glaucoma and Projections of Glaucoma Burden through 2040: A systematic review and meta-analysis. Ophthalmology. 2014;121:2081–2090. doi: 10.1016/j.ophtha.2014.05.013. - DOI - PubMed
    1. Berdahl J.P., Allingham R.R. Intracranial pressure and glaucoma. Curr. Opin. Ophthalmol. 2010;21:106–111. doi: 10.1097/ICU.0b013e32833651d8. - DOI - PubMed
    1. Kapetanakis V.V., Chan M.P.Y., Foster P., Cook D., Owen C., Rudnicka A. Global variations and time trends in the prevalence of primary open angle glaucoma (POAG): A systematic review and meta-analysis. Br. J. Ophthalmol. 2015;100:86–93. doi: 10.1136/bjophthalmol-2015-307223. - DOI - PMC - PubMed
    1. Quigley H.A. Glaucoma. Lancet. 2011;377:1367–1377. doi: 10.1016/S0140-6736(10)61423-7. - DOI - PubMed
    1. Weinreb R.N., Aung T., Medeiros F.A. The Pathophysiology and Treatment of Glaucoma: A review. JAMA—J. Am. Med. Assoc. 2014;311:1901–1911. doi: 10.1001/jama.2014.3192. - DOI - PMC - PubMed

LinkOut - more resources