. 2022 Feb 23;14(3):454.
doi: 10.3390/v14030454.

Analyses of Long-Term Epidemic Trends and Evolution Characteristics of Haplotype Subtypes Reveal the Dynamic Selection on SARS-CoV-2

Affiliations

Analyses of Long-Term Epidemic Trends and Evolution Characteristics of Haplotype Subtypes Reveal the Dynamic Selection on SARS-CoV-2

Binbin Xi et al. Viruses. .

Abstract

The scale of SARS-CoV-2 infection and death is so enormous that further study of the molecular and evolutionary characteristics of SARS-CoV-2 will help us better understand and respond to SARS-CoV-2 outbreaks. The present study analyzed the epidemic and evolutionary characteristics of haplotype subtypes or regions based on 1.8 million high-quality SARS-CoV-2 genomic data. The estimated ratio of the rates of non-synonymous to synonymous changes (Ka/Ks) in North America and the United States were always more than 1.0, while the Ka/Ks in other continents and countries showed a sharp decline, then a slow increase to 1.0, and a dramatic increase over time. H1 (B.1) with the highest substitution rate has become the most dominant haplotype subtype since March 2020 and has evolved into multiple haplotype subtypes with smaller substitution rates. Many evolutionary characteristics of early SARS-CoV-2, such as H3 being the only early haplotype subtype that existed for the shortest time, the global prevalence of H1 and H1-5 (B.1.1) within a month after being detected, and many high divergent genome sequences early in February 2020, indicate the missing of early SARS-CoV-2 genomic data. SARS-CoV-2 experienced dynamic selection from December 2019 to August 2021 and has been under strong positive selection since May 2021. Its transmissibility and the ability of immune escape may be greatly enhanced over time. This will bring greater challenges to the control of the pandemic.

Keywords: Ka/Ks; SARS-CoV-2; epidemic trends; evolution; haplotype subtypes; substitution rate.


Conflict of interest statement

The authors declare no conflict of interest.

Figures

Figure 1
Figure 1
The estimated substitution rate of SARS-CoV-2. The estimated substitution rate of different continents, countries with genome sequences >10,000, and China were plotted, while that of Turkey was not plotted because it had a small Pearson correlation coefficient (r = 0.20).
Figure 2
Figure 2
The changes of the estimated ratio of the rates of non-synonymous to synonymous changes (Ka/Ks) of SARS-CoV-2. The Ka/Ks of SARS-CoV-2 between December 2019 and March 2020 was calculated as a whole as there are too few genome sequences in the early stage. (A) The changes of Ka/Ks in different continents. (B) The changes of Ka/Ks in different countries or regions with more than 10,000 genome sequences and China.
Figure 3
Figure 3
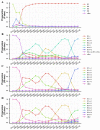
The changes of the proportion of different haplotype subtypes over time. (A) Proportion changes of the four haplotype subtypes defined by the nine specific mutation sites. (B) Proportion changes of the eight haplotype subtypes defined by the 16 specific mutation sites. (C) Proportion changes of the seven haplotype subtypes defined by the 30 specific mutation sites. (D) Proportion changes of the eight haplotype subtypes defined by the 33 specific mutation sites.
Figure 4
Figure 4
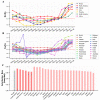
The Ka/Ks and substitution rate of H1 haplotype subtype. (A) The changes of the Ka/Ks of H1 haplotype subtype in different continents. (B) The changes of the Ka/Ks of H1 haplotype subtype in different countries or regions with more than 10,000 genome sequences and China. (C) The estimated substitution rate of the H1 haplotype subtype in different continents and countries or regions. The estimated substitution rate of the H1 haplotype subtype in Turkey was not plotted because it had a small Pearson correlation coefficient (r = 0.17).
Figure 5
Figure 5
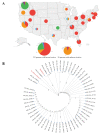
Early haplotype subtype distribution in the U.S. and the phylogenetic tree of early genome sequences in Washington State. (A) Genome sequences with the known location were plotted at the corresponding states of the U.S. on the map. (B) The reference sequence (NC_045512.2) and the genome sequences (MN985325.1) from the reported first case of the U.S. are marked in red.
Figure 6
Figure 6
The evolutionary divergence among global early genome sequences. The box extends from the first quartile (Q1) to the third quartile (Q3) of the data, with a line at the median (salmon color). The whiskers extend from the box by 1.5× the interquartile range (IQR). Flier points (silver color) are those past the end of the whiskers. (A) The pairwise distance between early genome sequences. (B) The pairwise distance between early genome sequences and the reference sequence (NC_045512.2).

References

    1. Bloom J.D., Chan Y.A., Baric R.S., Bjorkman P.J., Cobey S., Deverman B.E., Fisman D.N., Gupta R., Iwasaki A., Lipsitch M., et al. Investigate the origins of COVID-19. Science. 2021;372:694. doi: 10.1126/science.abj0016. - DOI - PMC - PubMed
    1. Wu C.-I., Wen H., Lu J., Su X., Hughes A.C., Zhai W., Chen C., Chen H., Li M., Song S., et al. On the origin of SARS-CoV-2—The blind watchmaker argument. Sci. China Life Sci. 2021;64:1560–1563. doi: 10.1007/s11427-021-1972-1. - DOI - PMC - PubMed
    1. Holmes E.C., Goldstein S.A., Rasmussen A.L., Robertson D.L., Crits-Christoph A., Wertheim J.O., Anthony S.J., Barclay W.S., Boni M.F., Doherty P.C., et al. The Origins of SARS-CoV-2: A Critical Review. Cell. 2021;184:4848–4856. doi: 10.1016/j.cell.2021.08.017. - DOI - PMC - PubMed
    1. Bai Y., Jiang D., Lon J.R., Chen X., Hu M., Lin S., Chen Z., Wang X., Meng Y., Du H. Comprehensive evolution and molecular characteristics of a large number of SARS-CoV-2 genomes reveal its epidemic trends. Int. J. Infect. Dis. 2020;100:164–173. doi: 10.1016/j.ijid.2020.08.066. - DOI - PMC - PubMed
    1. Xi B., Jiang D., Li S., Lon J.R., Bai Y., Lin S., Hu M., Meng Y., Qu Y., Huang Y., et al. AutoVEM: An automated tool to real-time monitor epidemic trends and key mutations in SARS-CoV-2 evolution. Comput. Struct. Biotechnol. J. 2021;19:1976–1985. doi: 10.1016/j.csbj.2021.04.002. - DOI - PMC - PubMed

Publication types