. 2022 Feb 25;14(3):472.
doi: 10.3390/v14030472.

Analysis of Genomic Characteristics of SARS-CoV-2 in Italy, 29 January to 27 March 2020

Affiliations

Analysis of Genomic Characteristics of SARS-CoV-2 in Italy, 29 January to 27 March 2020

Alessandra Lo Presti et al. Viruses. .

Abstract

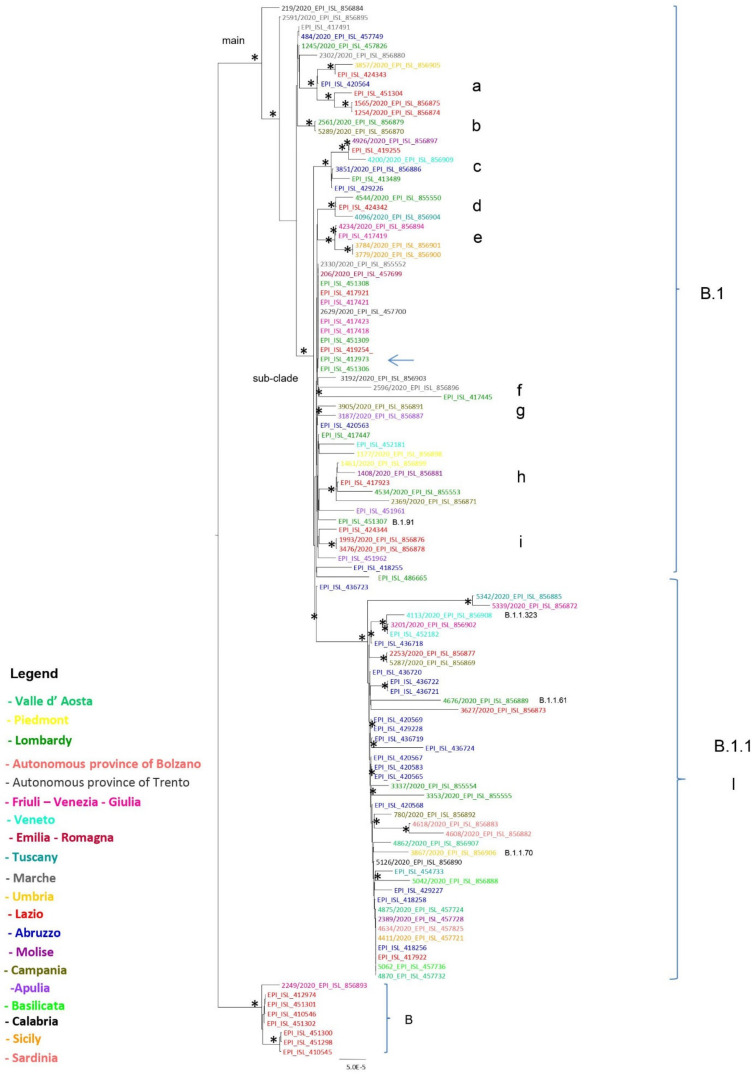
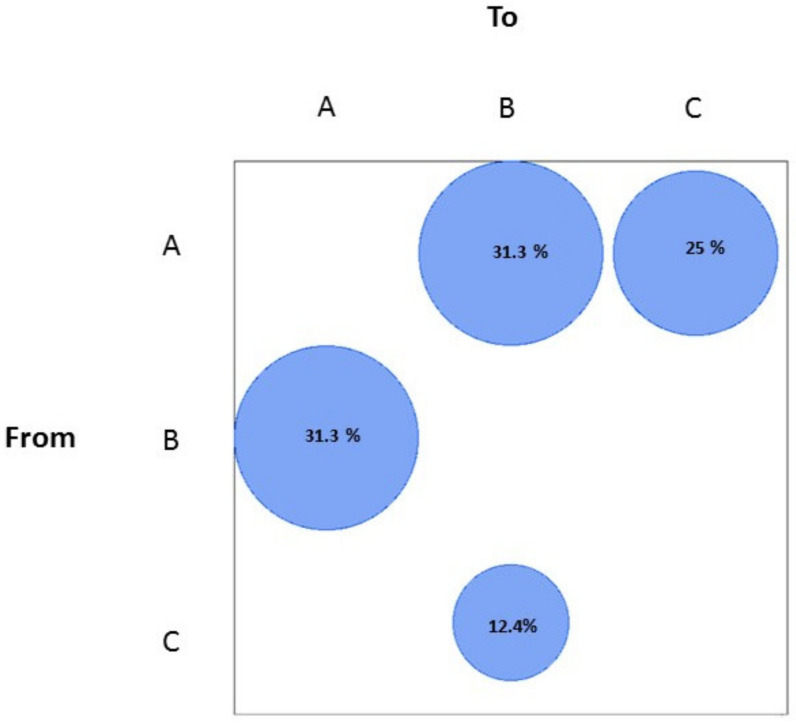
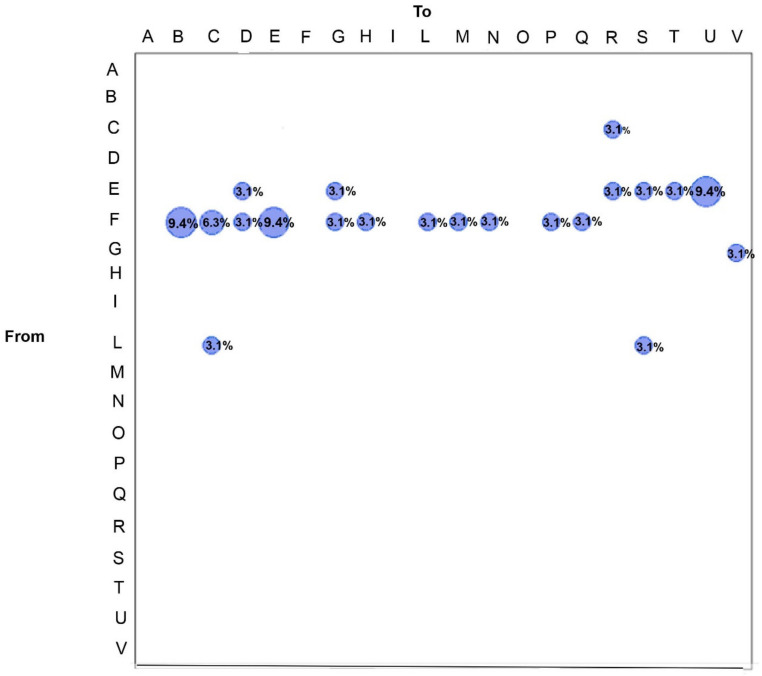
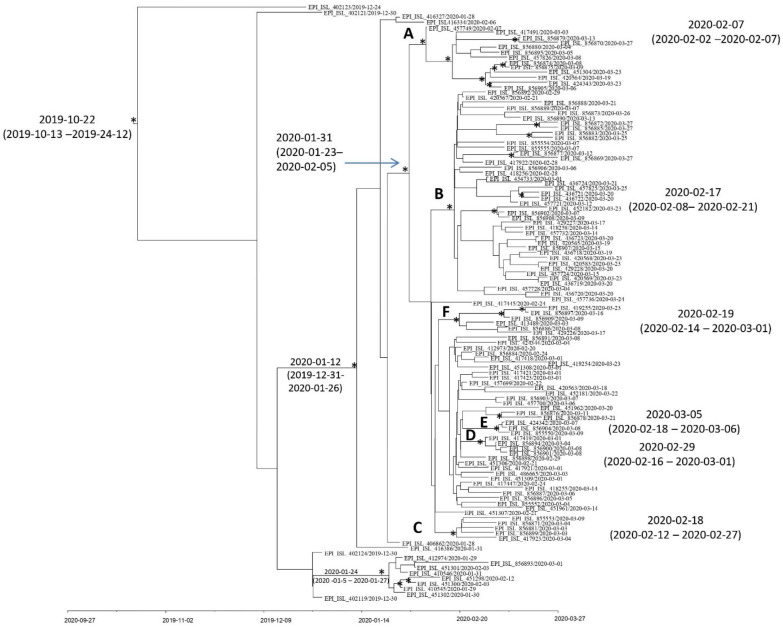
We performed next-generation sequencing (NGS), phylogenetic analysis, gene flows, and N- and O-glycosylation prediction on SARS-CoV-2 genomes collected from lab-confirmed cases from different Italian regions. To this end, a total of 111 SARS-CoV-2 genomes collected in Italy between 29 January and 27 March 2020 were investigated. The majority of the genomes belonged to lineage B.1, with some descendant lineages. The gene flow analysis showed that the spread occurred mainly from the north to the center and to the south of Italy, as confirmed by epidemiological data. The mean evolutionary rate estimated here was 8.731 × 10⁻⁴ (95% highest posterior density, HPD intervals 5.809 × 10⁻⁴ to 1.19 × 10⁻³), in line with values reported by other authors. The dated phylogeny suggested that SARS-CoV-2 lineage B.1 probably entered Italy between the end of January and early February 2020. Continuous molecular surveillance is needed to trace virus circulation and evolution.

Keywords: SARS-CoV-2 evolution; dated phylogeny; gene flows; genomics.


Conflict of interest statement

The authors reported no conflict of interest.

Figures

Figure 1
Figure 1
Maximum likelihood phylogenetic analysis of 58 SARS-CoV-2 Italian genomes from the Istituto Superiore di Sanità (Rome, Italy) and from the Italian Scientific Department of the Army Medical Center, plus 53 complete Italian genomes downloaded from GISAID (collected from other Institutes). The tree was rooted according to the cluster highlighted at the bottom of the figure, corresponding to SARS-CoV-2 lineage B sequences, as they are divergent from the rest of the taxa (B.1 and descendant lineages) and to give directionality to the tree. Branch lengths were estimated with the best-fitting nucleotide substitution model according to a hierarchical likelihood ratio test. The scale bar at the bottom represents nucleotide substitutions per site. An asterisk along a branch represents significant statistical support for the clusters subtending that branch (bootstrap support and aLRT > 80%). The main clades and clusters are highlighted. The colors of the tips represent strains from different Italian regions (Abruzzo, blue; Lazio, red; Lombardy, green; Friuli-Venezia Giulia, pink-fuchsia; Marche, grey; Veneto, light blue; Molise, violet; Sicily, ocra yellow; Sardinia, pink flesh; Campania, dark green; autonomous province (AP) of Trento, dark grey; Umbria, intermediate yellow; Tuscany, sea blue; Emilia Romagna, dark red; Apulia, light purple; Piedmont, very light yellow; Calabria, black; Basilicata, light green; Valle d’Aosta, green water; autonomous province (AP) of Bolzano, fuchsia). Lineages are indicated in the figure.
Figure 2
Figure 2
Maximum parsimony migration patterns of SARS-CoV-2 Italian genomes to/from different areas of the country (A, north; B, center; C, south). The bubblegram shows the frequency of gene flow (migrations) to/from different areas, as the percentage of total observed migrations estimated from the tree with a modified version of the Slatkin and Maddison test. Only statistically supported gene flows were reported. The surface of each circle is proportional to the percentage of observed migrations stated within the circle.
Figure 3
Figure 3
Maximum parsimony migration patterns of SARS-CoV-2 Italian genomes to/from different regions of the country (A, Basilicata; B, Friuli-Venezia Giulia; C, Lazio; D, Molise; E, Abruzzo; F, Lombardy; G, Veneto; H, Tuscany; I, Sicily; L, Campania; M, Marche; N, AP of Trento; O, Emilia Romagna; P, Apulia; Q, Piedmont; R, Umbria; S, Calabria; T, Sardinia; U, Valle d’Aosta; V, AP of Bolzano). The bubblegram shows the frequency of gene flow (migrations) to/from different regions, as the percentage of the total observed migrations estimated from the tree with a modified version of the Slatkin and Maddison test. The surface of each circle is proportional to the percentage of observed migrations stated within the circle.
Figure 4
Figure 4
Bayesian maximum clade credibility tree representing the timescale phylogeny and date estimates for the Italian genomes. The asterisk (*) along the branches represents significant statistical support for the clade subtending that branch (posterior probability > 0.80). The scale at the bottom of the tree represents time in dates (year, month, day). Main supported clades are indicated and dated.

References

    1. Fehr A.R., Perlman S. Coronaviruses: An overview of their replication and pathogenesis. Methods Mol. Biol. 2015;1282:1–23. - PMC - PubMed
    1. Wu F., Zhao S., Yu B., Chen Y.M., Wang W., Song Z.G. A new coronavirus associated with human respiratory disease in China. Nature. 2020;579:265–269. doi: 10.1038/s41586-020-2008-3. - DOI - PMC - PubMed
    1. World Health Organization (WHO) Statement on the Second Meeting of the International Health Regulations (2005) Emergency Committee Regarding the Outbreak of Novel Coronavirus (2019-nCoV). 30 January 2020. [(accessed on 29 September 2021)]. Available online: https://www.who.int/news/item/30-01-2020-statement-on-the-second-meeting...
    1. World Health Organization (WHO) WHO Director—General’s Opening Remarks at the Media Briefing on COVID-19. 11 March 2020. [(accessed on 29 September 2021)]. Available online: https://www.who.int/director-general/speeches/detail/who-director-genera....
    1. Capobianchi M.R., Rueca M., Messina F., Giombini E., Carletti F., Colavita F., Castilletti C., Lalle E., Bordi L., Vairo F., et al. Molecular characterization of SARS-CoV-2 from the first case of COVID-19 in Italy. Clin. Microbiol. Infect. 2020;26:954–956. doi: 10.1016/j.cmi.2020.03.025. - DOI - PMC - PubMed