

Protective Immunity of the Primary SARS-CoV-2 Infection Reduces Disease Severity Post Re-Infection with Delta Variants in Syrian Hamsters
- PMID: 35337002
- PMCID: PMC8950956
- DOI: 10.3390/v14030596
Protective Immunity of the Primary SARS-CoV-2 Infection Reduces Disease Severity Post Re-Infection with Delta Variants in Syrian Hamsters
Abstract
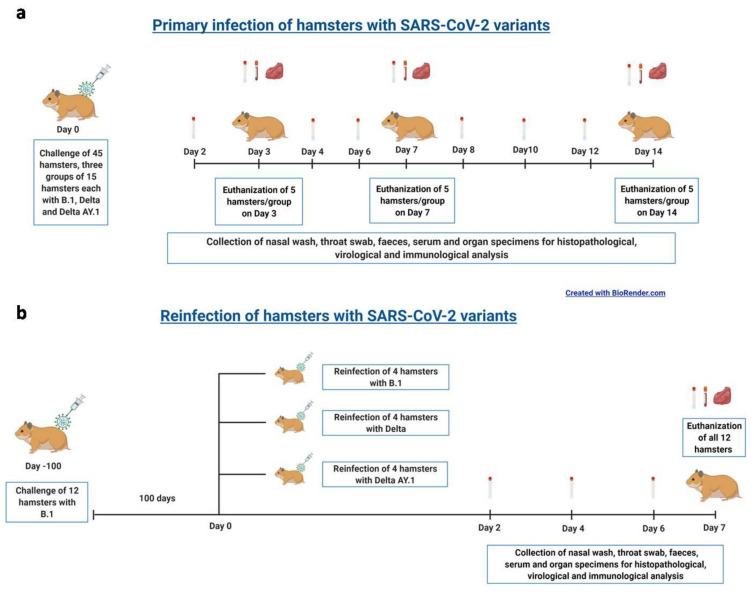
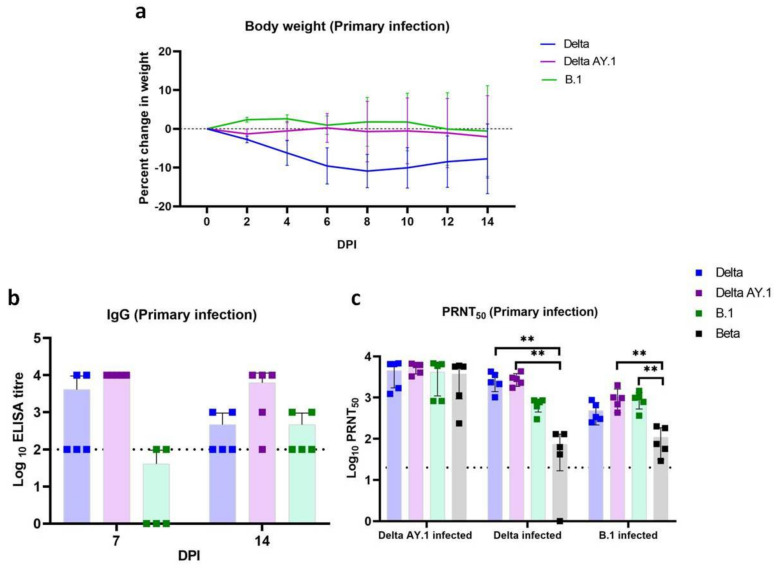
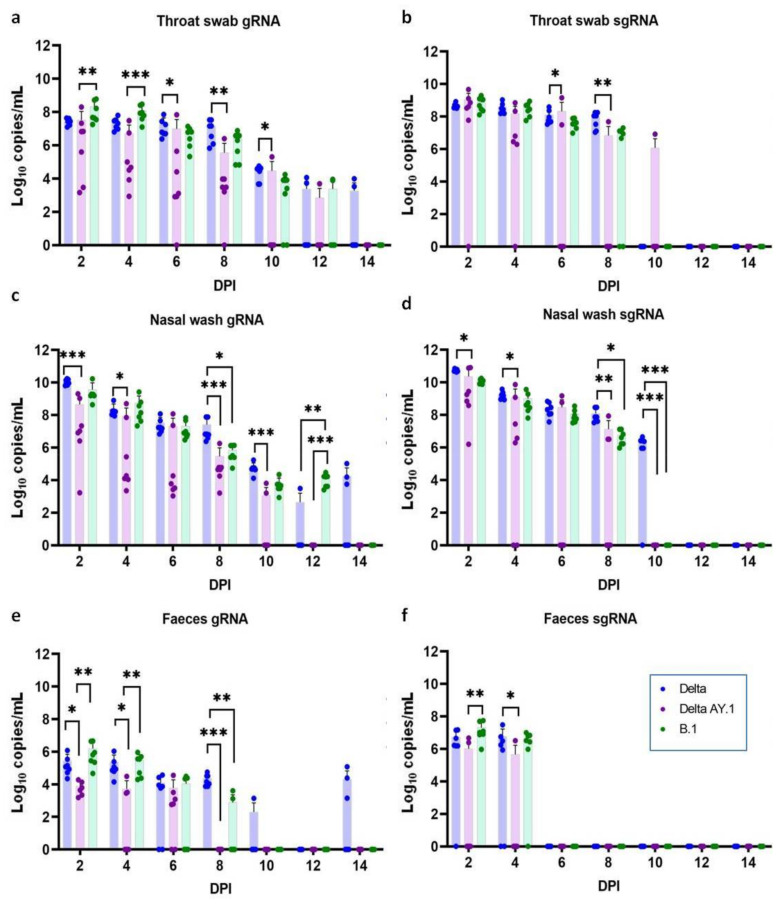
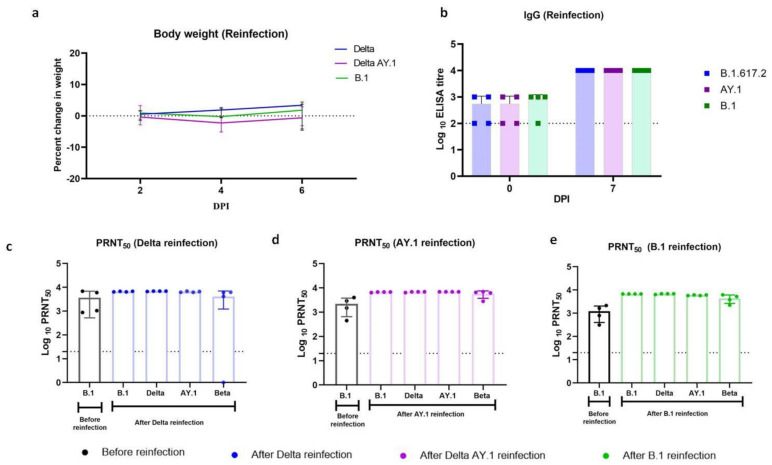
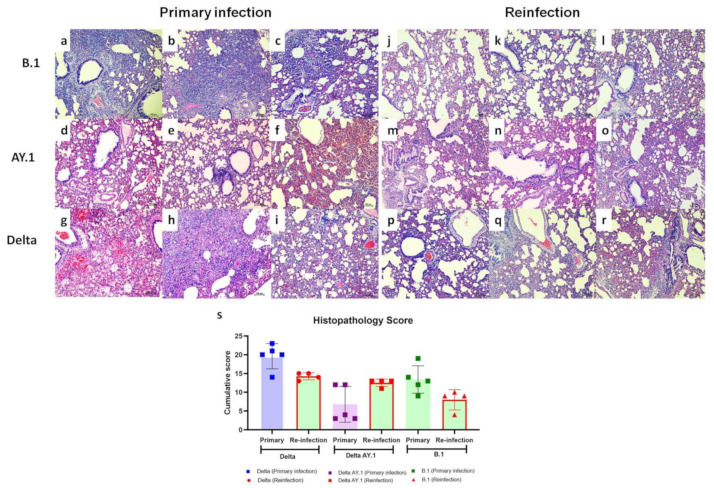
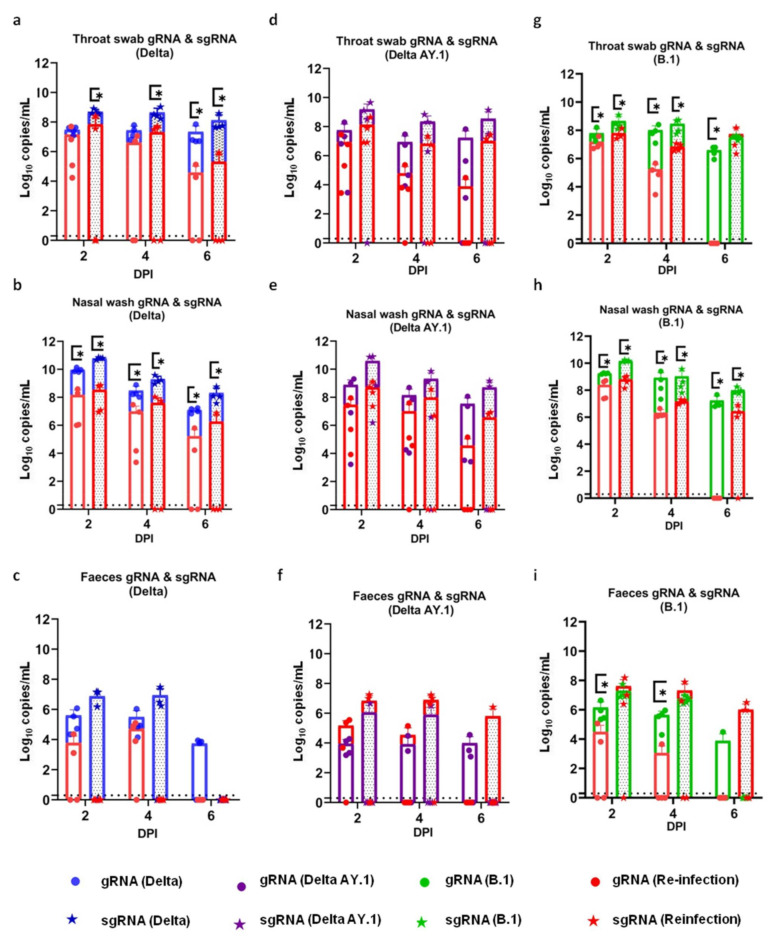
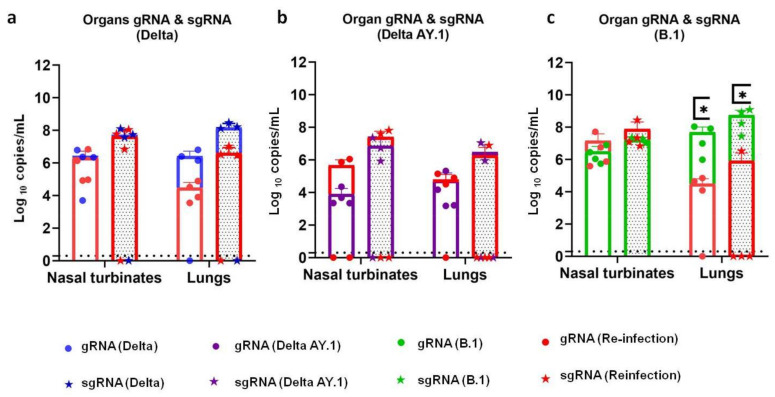
The Severe Acute Respiratory Syndrome Coronavirus-2 (SARS-CoV-2) Delta variant has evolved to become the dominant SARS-CoV-2 lineage with multiple sub-lineages and there are also reports of re-infections caused by this variant. We studied the disease characteristics induced by the Delta AY.1 variant and compared it with the Delta and B.1 variants in Syrian hamsters. We also assessed the potential of re-infection by these variants in Coronavirus disease 2019 recovered hamsters 3 months after initial infection. The variants produced disease characterized by high viral load in the respiratory tract and interstitial pneumonia. The Delta AY.1 variant produced mild disease in the hamster model and did not show any evidence of neutralization resistance due to the presence of the K417N mutation, as speculated. Re-infection with a high virus dose of the Delta and B.1 variants 3 months after B.1 variant infection resulted in reduced virus shedding, disease severity and increased neutralizing antibody levels in the re-infected hamsters. The reduction in viral load and lung disease after re-infection with the Delta AY.1 variant was not marked. Upper respiratory tract viral RNA loads remained similar after re-infection in all the groups. The present findings show that prior infection could not produce sterilizing immunity but that it can broaden the neutralizing response and reduce disease severity in case of reinfection.
Keywords: Delta AY.1; SARS-CoV-2; Syrian hamsters; pathogenicity; re-infection.
Conflict of interest statement
The authors declare no competing financial interests.
Figures
Similar articles
-
Pathogenicity of SARS-CoV-2 Omicron (R346K) variant in Syrian hamsters and its cross-neutralization with different variants of concern.EBioMedicine. 2022 May;79:103997. doi: 10.1016/j.ebiom.2022.103997. Epub 2022 Apr 8. EBioMedicine. 2022. PMID: 35405385 Free PMC article.
-
Impact of Reinfection with SARS-CoV-2 Omicron Variants in Previously Infected Hamsters.J Virol. 2023 Jan 31;97(1):e0136622. doi: 10.1128/jvi.01366-22. Epub 2023 Jan 12. J Virol. 2023. PMID: 36633406 Free PMC article.
-
SARS-CoV-2 Variant Pathogenesis Following Primary Infection and Reinfection in Syrian Hamsters.mBio. 2023 Apr 25;14(2):e0007823. doi: 10.1128/mbio.00078-23. Epub 2023 Apr 10. mBio. 2023. PMID: 37036339 Free PMC article.
-
Hamsters as a Model of Severe Acute Respiratory Syndrome Coronavirus-2.Comp Med. 2021 Oct 1;71(5):398-410. doi: 10.30802/AALAS-CM-21-000036. Epub 2021 Sep 29. Comp Med. 2021. PMID: 34588095 Free PMC article. Review.
-
Differentials of SARS-CoV-2 Viral RNA Re-positivity in Discharged COVID-19 Patients.AIDS Rev. 2021 Jun 3;23(3):153-163. doi: 10.24875/AIDSRev.21000023. AIDS Rev. 2021. PMID: 34082440 Review.
Cited by
-
Omicron breakthrough infections in vaccinated or previously infected hamsters.Proc Natl Acad Sci U S A. 2023 Nov 7;120(45):e2308655120. doi: 10.1073/pnas.2308655120. Epub 2023 Oct 30. Proc Natl Acad Sci U S A. 2023. PMID: 37903249 Free PMC article.
-
Pathogenicity of SARS-CoV-2 Omicron (R346K) variant in Syrian hamsters and its cross-neutralization with different variants of concern.EBioMedicine. 2022 May;79:103997. doi: 10.1016/j.ebiom.2022.103997. Epub 2022 Apr 8. EBioMedicine. 2022. PMID: 35405385 Free PMC article.
-
Nasal Mucosa Exploited by SARS-CoV-2 for Replicating and Shedding during Reinfection.Viruses. 2022 Jul 23;14(8):1608. doi: 10.3390/v14081608. Viruses. 2022. PMID: 35893674 Free PMC article.
-
Infection- or vaccine mediated immunity reduces SARS-CoV-2 transmission, but increases competitiveness of Omicron in hamsters.bioRxiv [Preprint]. 2022 Jul 29:2022.07.29.502072. doi: 10.1101/2022.07.29.502072. bioRxiv. 2022. Update in: Nat Commun. 2023 Oct 18;14(1):6592. doi: 10.1038/s41467-023-42346-8. PMID: 35982658 Free PMC article. Updated. Preprint.
-
Infection- or AZD1222 vaccine-mediated immunity reduces SARS-CoV-2 transmission but increases Omicron competitiveness in hamsters.Nat Commun. 2023 Oct 18;14(1):6592. doi: 10.1038/s41467-023-42346-8. Nat Commun. 2023. PMID: 37852960 Free PMC article.
References
-
- PANGO Lineages. 2021. [(accessed on 19 November 2021)]. Available online: https://cov-lineages.org/global_report_B.1.617.2.html.
-
- World Health Organization 2021. [(accessed on 19 November 2021)]. Available online: https://www.who.int/publications/m/item/weekly-epidemiological-update-on....
-
- Pan American Health Organisation 2021. [(accessed on 11 December 2021)]. Available online: https://www.paho.org/en/documents/epidemiological-update-coronavirus-dis....
-
- Woo P.C., Lau S.K., Wong B.H., Chan K.H., Chu C.M., Tsoi H.W., Huang Y., Peiris J.M., Yuen K.Y. Longitudinal profile of immunoglobulin G (IgG), IgM, and IgA antibodies against the severe acute respiratory syndrome (SARS) coronavirus nucleocapsid protein in patients with pneumonia due to the SARS coronavirus. Clin. Vaccine Immunol. 2004;11:665–668. doi: 10.1128/CDLI.11.4.665-668.2004. - DOI - PMC - PubMed
Publication types
MeSH terms
Supplementary concepts
Grants and funding
LinkOut - more resources
Full Text Sources
Medical
Miscellaneous
