. 2022 Mar 11;15(3):342.
doi: 10.3390/ph15030342.

Multiple Effects of Resveratrol on Osteosarcoma Cell Lines

Affiliations

Multiple Effects of Resveratrol on Osteosarcoma Cell Lines

Angela De Luca et al. Pharmaceuticals (Basel). .

Abstract

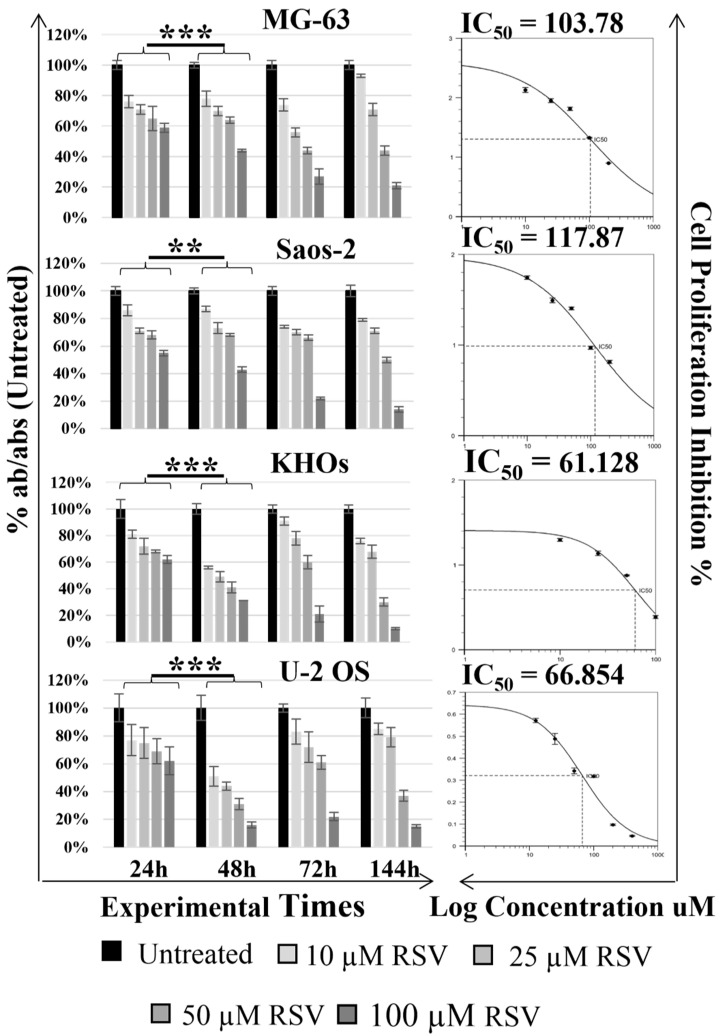
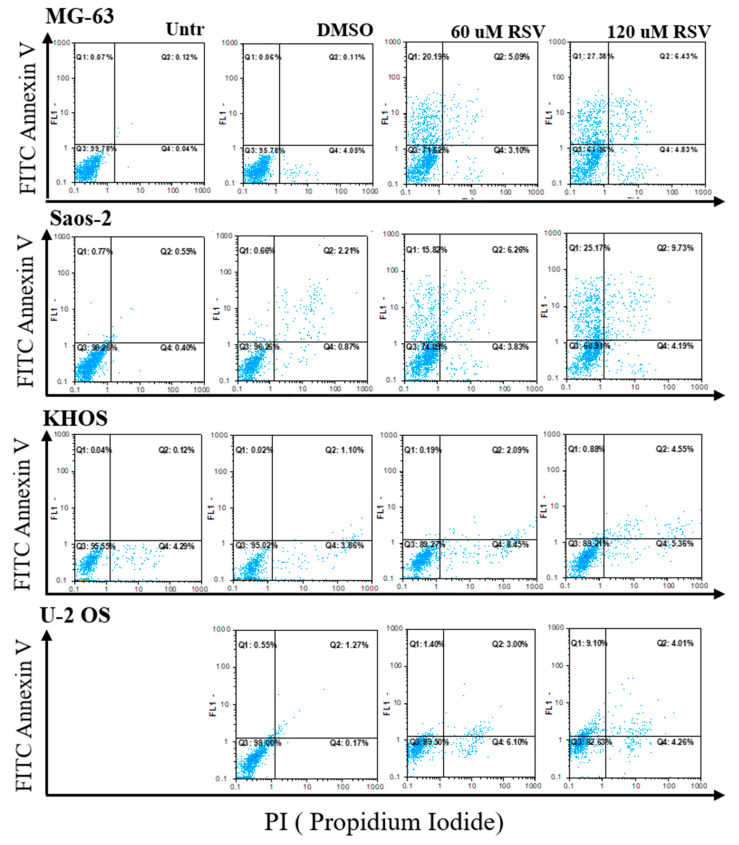
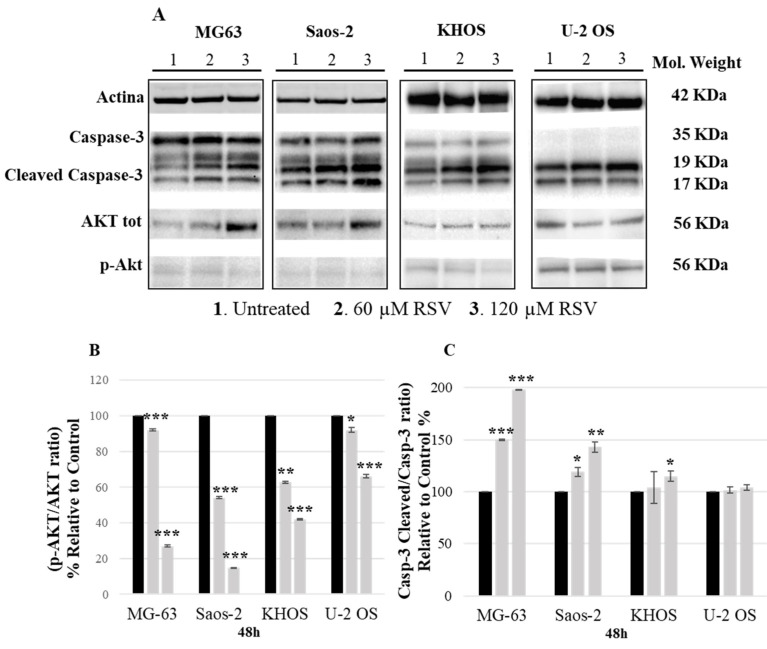
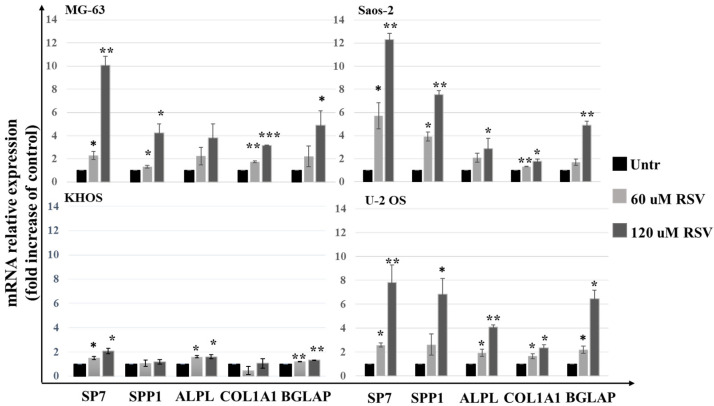
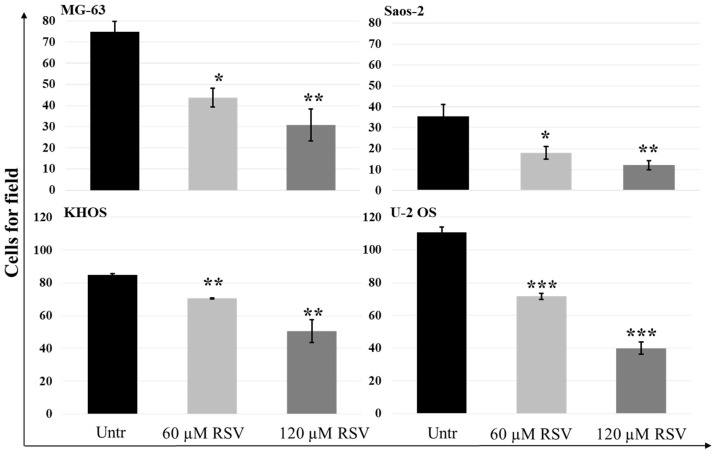
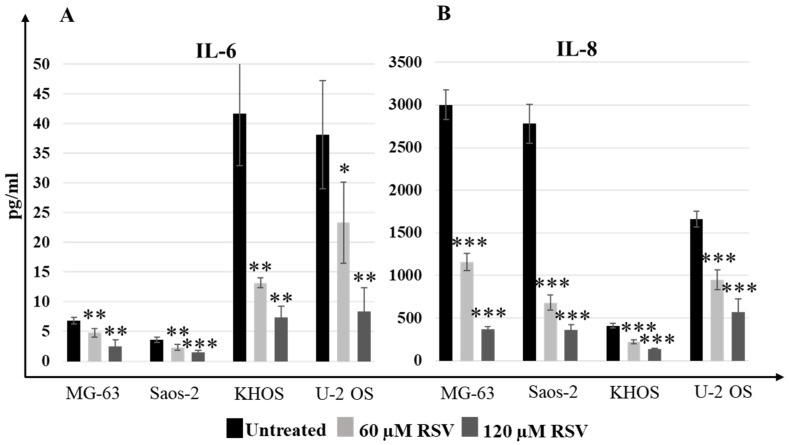
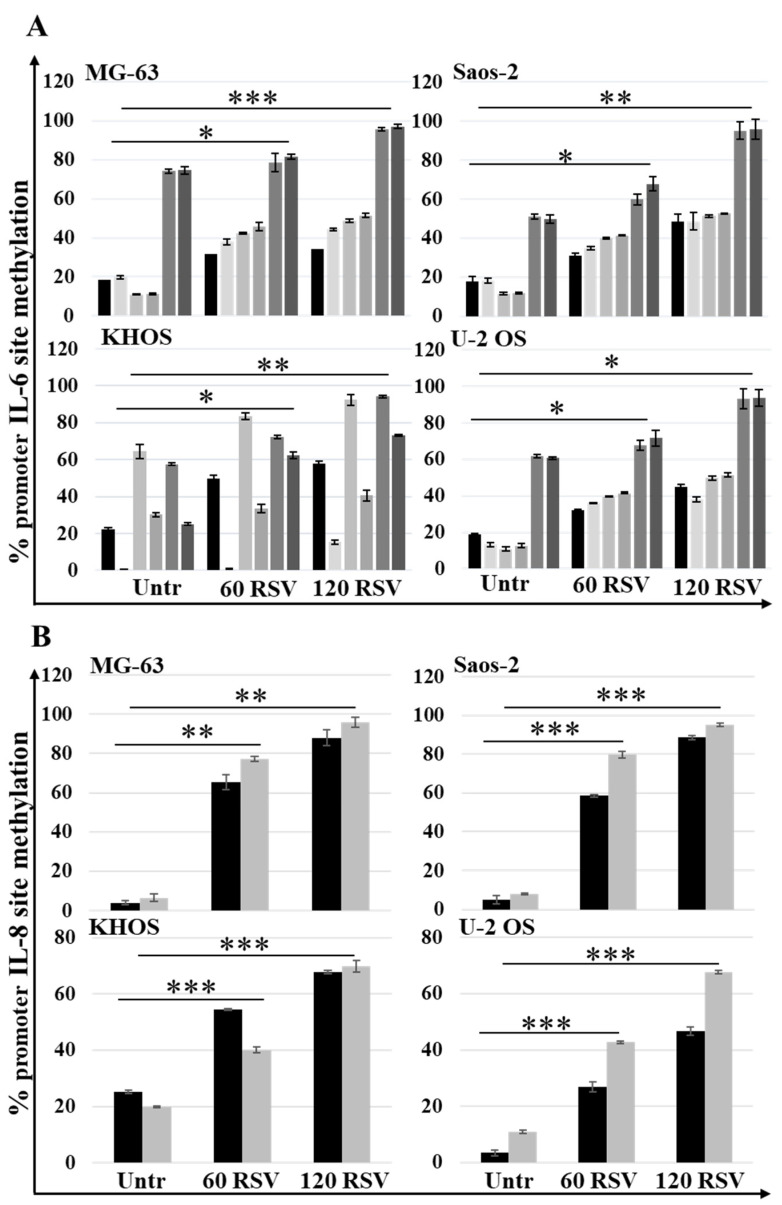
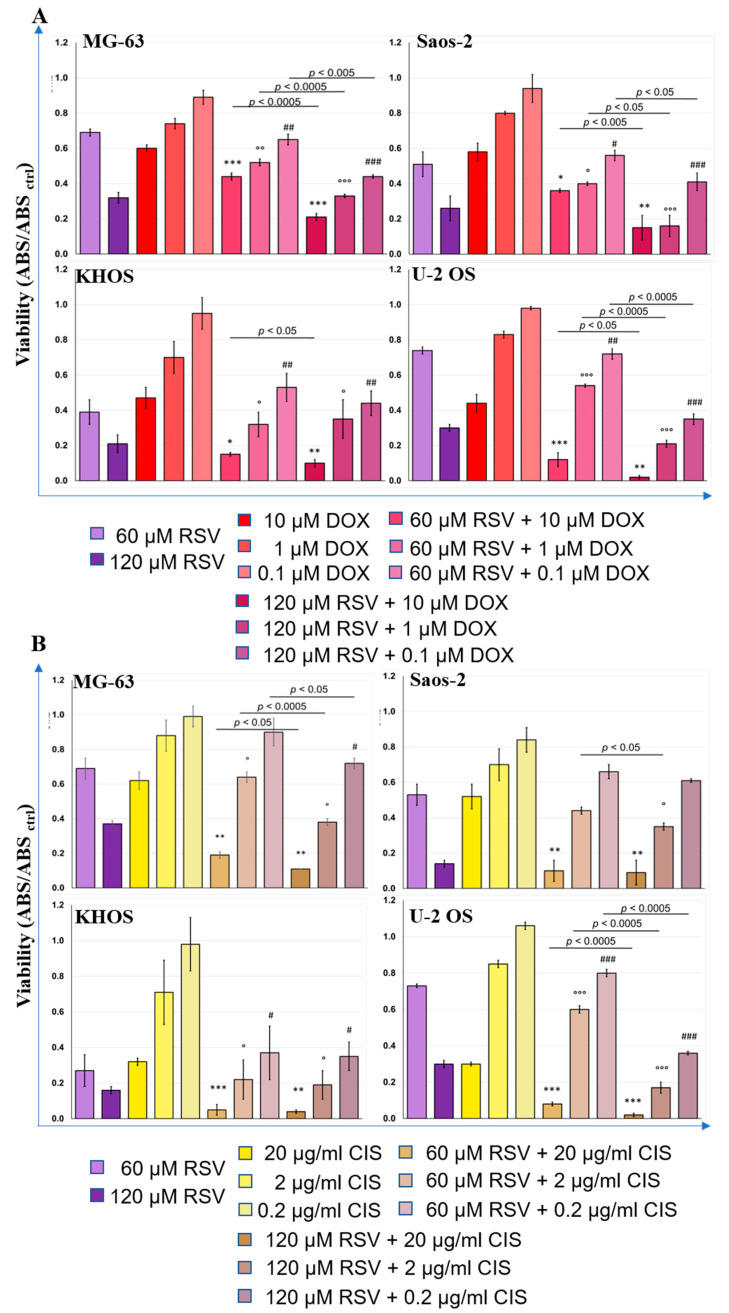
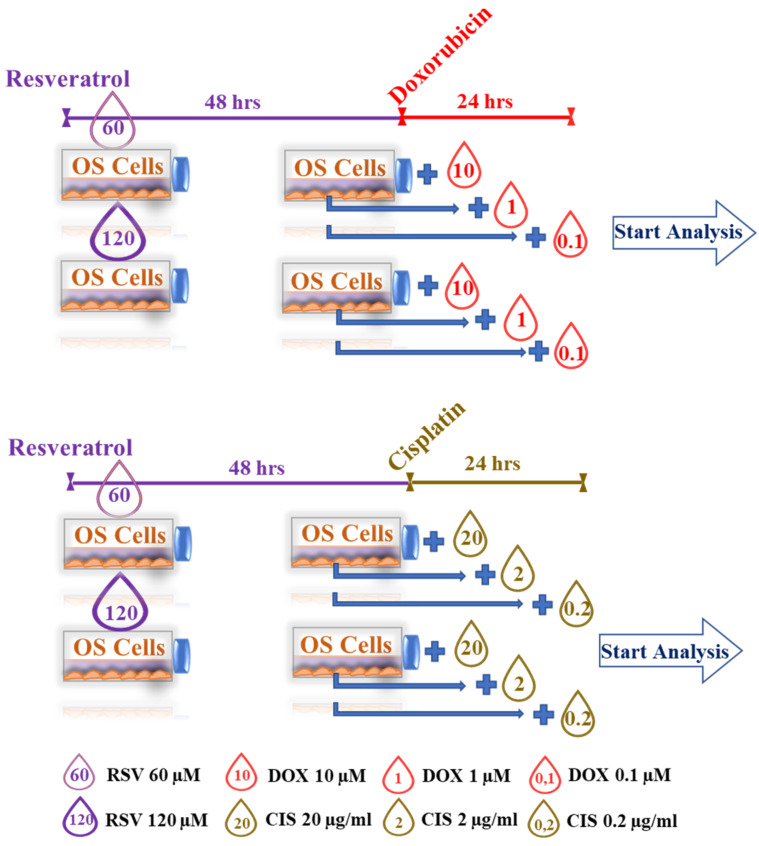
Osteosarcoma (OS) is the most common primary bone sarcoma affecting the life of pediatric patients. The clinical treatment faces numerous difficulties, including the adverse effects of chemotherapies, chemoresistance, and recurrences. In this study, the effects of resveratrol (RSV), a natural polyphenol, on OS cell lines were investigated to evaluate its action as an adjuvant therapy to the current chemotherapy regimens. RSV exhibited multiple tumor-suppressing activities on OS cell lines, inducing a series of critical events. We found (1) a cell growth inhibition due to an increase in cell distress, which was, in part, due to the involvement of the AKT and caspase-3 pathways, (2) an increase in cellular differentiation due to major gene expression levels of the osteoblastic differentiation genes, (3) an inhibition of IL-6 secretion due to an epigenetic effect on the IL-6 promoter, and (4) an inhibition of OS cells migration related to the decrease in IL-8 secretion levels due to an epigenetic effect on its promoter. Finally, the cotreatment of RSV with doxorubicin and cisplatin increased their cytotoxic effect on OS cells. Although further investigations are mandatory, it seems RSV might be a promising therapeutic adjuvant agent for OS cell treatment, exerting an antitumor effect when combined with chemotherapy.

Keywords: apoptosis; chemotherapeutic agents; cisplatin; doxorubicin; invasion; natural compound; osteosarcoma; proliferation; resveratrol.


Conflict of interest statement

The authors declare no conflict of interest.

Figures

Figure 1
Figure 1
Effect of resveratrol on the cellular proliferation of OS cell lines. Cell viability was tested by WST-1 assay at various times after 48 h. As reported in each histogram, the absorbance values were converted into percentage absorbance values with respect to the untreated cells of each cell line. RSV treatment effects a significant reduction of cell proliferation after 48 h (** symbols correspond to p < 0.005 and *** symbols to p < 0.0005). All experiments were triplicated, with the data expressed as mean ± SD. On the right of each histogram are reported the graphs of the IC50 values of RSV calculated for each cell line after 48 h. The IC50 values were estimated by: https://www.aatbio.com/tools/ic50-calculator-v1, accessed on 1 February 2022.
Figure 2
Figure 2
Results of annexin V/PI staining by flow cytometry analysis. For each OS cell line, the results of flow cytometry analysis are reported after 48 h of culture without any treatment (Untreated), or treated with DMSO, or with two different concentrations of RSV (60 or 120 μM). The Q2 quadrant shows the percentage of double-stained cells for annexin V/PI and apoptotic cells. DMSO is the vehicle-related control of RSV and exhibits negligible effect on OS cell lines.
Figure 3
Figure 3
RSV regulates caspese-3 and AKT in OS cells. (A)—Representative Western blotting analysis of OS cell expression proteins treated with 60 or 120 μM RSV for 48 h. Actin was used as a load control. (B,C)—Densitometric quantification of the percentage expression of the ratio p-Akt/Akt (B) and cleaved caspase-3/caspase-3 (C) of the untreated cells compared to the cells treated with RSV (mean ± SD, n = 4). A One-way ANOVA test was used to evaluate the effect of the RSV treatment factor (60 and 120 µM) on the regulation of caspase-3 (MG-63—F = 534, p < 0.0005; Saos-2—F = 123, p < 0.0005; KHOS—F = 2.5, p < 0.0005; U-2 OS—F = 2.2, p < 0.0005) and AKT (MG-63—F = 3011, p < 0.0005; Saos-2—F = 695, p < 0.0005; KHOS—F = 135, p < 0.0005; U-2 OS—F = 110, p < 0.0005). Dunnett’s test: *, p < 0.05; **, p < 0.005; ***, p < 0.0005 versus untreated cell culture.
Figure 4
Figure 4
Evaluation of OS cell lines differentiation after RSV treatment in 48 h. qPCR analysis was performed to study the mRNA expression levels of osteoblast differentiation genes. Each bar graph shows the increase in the expression expressed in FOI compared to the control (Untreated). Gene expression analysis was performed using the 2−ΔΔCT method using β-actin expression as the reference gene (mean ± SD, n = 4). A one-way ANOVA test was used to evaluate the effect of the RSV treatment factor (60 or 120 µM) on OS cell line differentiation. Dunnett’s test: *, p < 0.05; **, p < 0.005; ***, p < 0.0005 versus untreated cell culture.
Figure 5
Figure 5
Quantitation of RSV effects on OS cell lines motility by Transwell assay. The number of OS cells that invaded the membrane of the 8 µm Matrigel-coated pores decreased when the cells were treated with an increasing concentration of RSV. The bar charts represent the migration inhibition of OS cell lines as a decreasing number of cells counted in each field. For each cell culture, 5 fields were randomly selected, and the cell number was counted under a light microscope (mean ± SD, n = 4). A one-way ANOVA test was used to evaluate the effect of RSV treatment factor (60 and 120 µM) on OS cell line migration (MG-63—F = 23.3, p < 0.0005; Saos-2—F = 36.9, p < 0.0005; KHOS—F = 75.5, p < 0.0005; U-2 OS—F = 564, p < 0.0005). Dunnett’s test: *, p < 0.05; **, p < 0.005; ***, p < 0.0005 versus untreated cell culture.
Figure 6
Figure 6
Treatment with RSV reduced IL-6 and IL-8 secretion levels in OS cell lines. The ELISA assay results showed how IL-6 (A) and IL-8 (B) levels (pg/mL) decreased after 48-h RSV treatment (mean ± SD). Baseline expression of this proinflammatory cytokine was different in each OS cell line, but the decrease in IL-6 levels was observed for each OS cell line. A one-way ANOVA test was used to evaluate the effect of RSV treatment factor (60 and 120 µM) on IL-6 release (MG-63—F = 27.4, p < 0.0005; Saos-2—F = 34.7, p < 0.0005; KHOS—F= 53.6, p < 0.0005; U-2 OS—F = 24.3, p < 0.0005) and on IL-8 (MG-63—F = 583, p < 0.0005; Saos-2—F = 315, p < 0.0005; KHOS—F = 155, p < 0.0005; U-2 OS—F = 102, p < 0.0005). Dunnett’s test: *, p < 0.05, **, p < 0.005, ***, p < 0.0005 versus untreated cell culture.
Figure 7
Figure 7
Treatment with RSV induced IL-6 and IL-8 promoter methylation in OS cell lines. MSRE PCR analysis results show the methylation levels of six restriction sites analyzed in 3 regions of the IL-6 promoter (A) and the methylation levels of two restriction sites analyzed in 2 regions of the IL-8 promoter (B). Data are reported as mean ± SD of n = 4 triplicates. A one-way ANOVA test was used to evaluate the effect of the RSV treatment factor (60 and 120 µM) on restriction sites methylation in OS cell lines. Dunnett’s test: *, p < 0.05, **, p < 0.005, ***, p < 0.0005 versus untreated cell culture.
Figure 8
Figure 8
Results of RSV–DOX (A) and RSV–CIS (B) effects on OS cell lines viability (WST-1) (mean ± SD, n = 4). Each OS cell line culture was RSV pretreated (60 or 120 µM) in 48 h and then treated with DOX (10, 1, or 0.1 µM) or CIS (20, 2, or 0.2 µg/mL) within 24 h, except for control treatment cultures. These last were treated with DOX (10, 1, or 0.1 µM) or CIS (20, 2, or 0.2 µg/mL) within 24 h or with RSV (60 or 120 µM) within 48 h. The WST-1 values of OS cell control cultures (ABSCTRL) correspond to 1.0. After having observed a significant effect of the combined treatment factor (RSV–DOX or RSV–CIS) on cell viability ONE, pairwise comparison tests between treatment combinations and relative treatment controls were done. For each symbol (*, IC50, °, 10−1 IC50 and #, 10−2 IC50 dose of DOX or CIS) 1 symbol corresponds to p < 0.05; 2 symbols, p < 0.005; and 3 symbols, p < 0.0005. The line over bars highlights the presence of a significant difference between the two bars.
Figure 9
Figure 9
Set-up of RSV–DOX and RSV–CIS cotreatments.

References

    1. De Luca A., Raimondi L., Salamanna F., Carina V., Costa V., Bellavia D., Alessandro R., Fini M., Giavaresi G. Relevance of 3D culture systems to study Osteosarcoma environment. J. Exp. Clin. Cancer Res. 2018;37:2. doi: 10.1186/s13046-017-0663-5. - DOI - PMC - PubMed
    1. Marchandet L., Lallier M., Charrier C., Baud‘huin M., Ory B., Lamoureux F. Mechanisms of Resistance to Conventional Therapies for Osteosarcoma. Cancers. 2021;13:683. doi: 10.3390/cancers13040683. - DOI - PMC - PubMed
    1. Zhang B., Zhang Y., Li R., Li J., Lu X., Zhang Y. The efficacy and safety comparison of first-line chemotherapeutic agents (high-dose methotrexate, doxorubicin, cisplatin, and ifosfamide) for Osteosarcoma: A network meta-analysis. J. Orthop. Surg. Res. 2020;15:51. doi: 10.1186/s13018-020-1576-0. - DOI - PMC - PubMed
    1. Raimondi L., De Luca A., Gallo A., Costa V., Russelli G., Cuscino N., Manno M., Raccosta S., Carina V., Bellavia D., et al. Osteosarcoma cell-derived exosomes affect tumor microenvironment by specific packaging of microRNAs. Carcinogenesis. 2020;41:666–677. doi: 10.1093/carcin/bgz130. - DOI - PubMed
    1. Shukla S., Ohnuma S., Ambudkar S.V. Improving cancer chemotherapy with modulators of ABC drug transporters. Curr. Drug Targets. 2011;12:621–630. doi: 10.2174/138945011795378540. - DOI - PMC - PubMed