. 2022 Mar 21;15(3):381.
doi: 10.3390/ph15030381.

Metformin Enhances TKI-Afatinib Cytotoxic Effect, Causing Downregulation of Glycolysis, Epithelial-Mesenchymal Transition, and EGFR-Signaling Pathway Activation in Lung Cancer Cells

Affiliations

Metformin Enhances TKI-Afatinib Cytotoxic Effect, Causing Downregulation of Glycolysis, Epithelial-Mesenchymal Transition, and EGFR-Signaling Pathway Activation in Lung Cancer Cells

Pedro Barrios-Bernal et al. Pharmaceuticals (Basel). .

Abstract

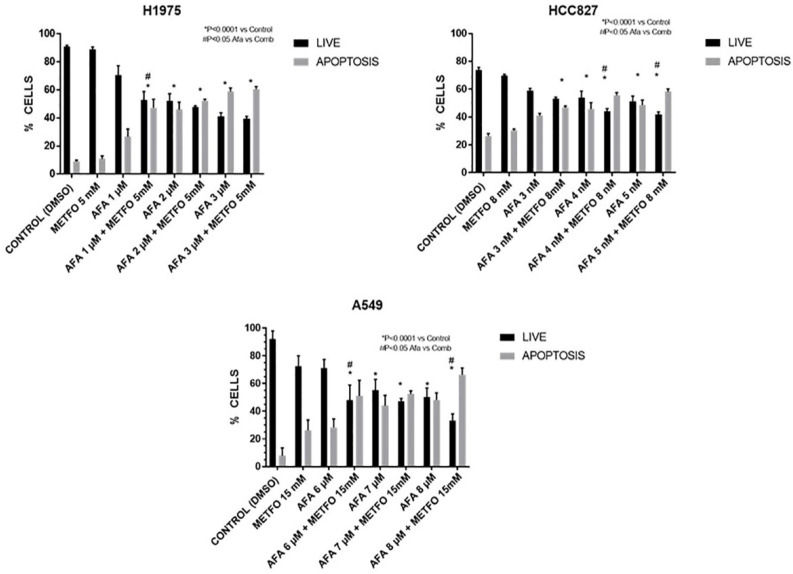
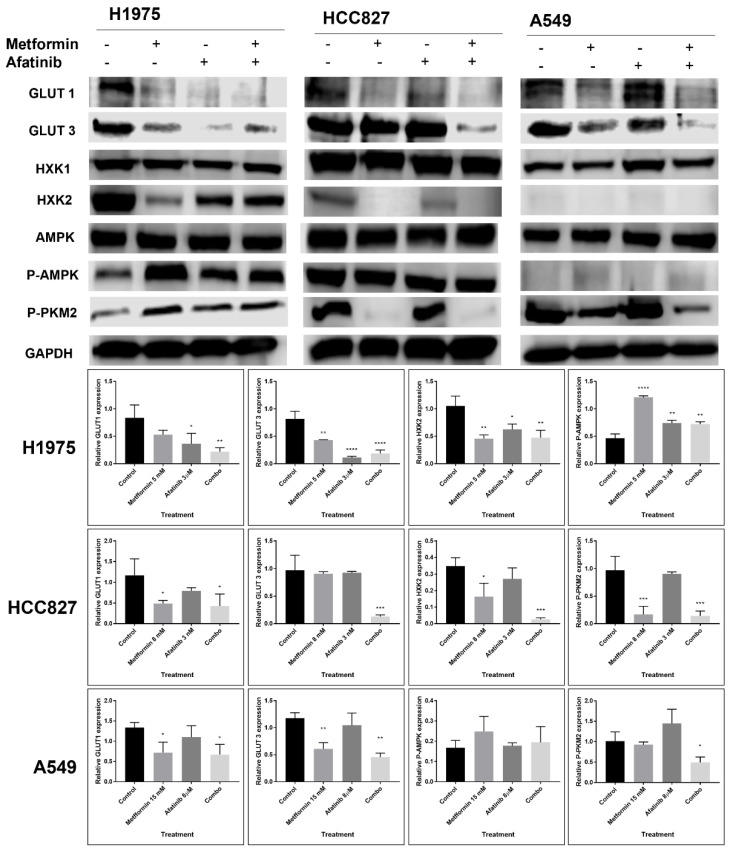
The combination of metformin and TKIs for non-small cell lung cancer has been proposed as a strategy to overcome resistance of neoplastic cells induced by several molecular mechanisms. This study sought to investigate the effects of a second generation TKI afatinib, metformin, or their combination on three adenocarcinoma lung cancer cell lines with different EGFRmutation status. A549, H1975, and HCC827 cell lines were treated with afatinib, metformin, and their combination for 72 h. Afterwards, several parameters were assessed including cytotoxicity, interactions, apoptosis, and EGFR protein levels at the cell membrane and several glycolytic, oxidative phosphorylation (OXPHOS), and EMT expression markers. All cell lines showed additive to synergic interactions for the induction of cytotoxicity caused by the tested combination, as well as an improved pro-apoptotic effect. This effect was accompanied by downregulation of glycolytic, EMT markers, a significant decrease in glucose uptake, extracellular lactate, and a tendency towards increased OXPHOS subunits expression. Interestingly, we observed a better response to the combined therapy in lung cancer cell lines A549 and H1975, which normally have low affinity for TKI treatment. Findings from this study suggest a sensitization to afatinib therapy by metformin in TKI-resistant lung cancer cells, as well as a reduction in cellular glycolytic phenotype.

Keywords: EGFR; afatinib–metformin; epithelial–mesenchymal transition; glycolysis; lung cancer; oxidative phosphorylation.


Conflict of interest statement

All authors have completed the ICMJE uniform disclosure form. The authors have no conflict of interest to declare.

Figures

Figure 1
Figure 1
(A) Cytotoxic effect of afatinib alone or in combination with metformin in H1975, HCC827, and A549 NSCLC cell lines. Cells were seeded and treated with the previously described schemes for 72 h and MTT assays were performed. Points represent the mean of 3 independent experiments by triplicate. Statistical analysis was performed through two-way ANOVA. ** p ≤ 0.01. (B) Combination index plots from NSCLC cell lines. Plots show the different afatinib concentrations for each cell line, in combination with metformin. We observed that the H1975 cell line had synergism with the two highest concentrations of afatinib (2 and 3 µM), the HCC827 cell line had a degree of synergy with the lowest afatinib concentration (3 nM), while a synergic effect in the three combined treatments of the A549 cell line was observed.
Figure 2
Figure 2
Apoptosis induction of afatinib plus metformin treatment in H1975, HCC827, and A549 cell lines. We observed similarities between the apoptosis test and cytotoxicity induction results. In total, 5000 events were analyzed in each assay. Cells were seeded and treated with the previously described scheme for 72 h and then analyzed with the apoptosis kit and flow cytometry. Bars represent the means of 3 independent experiments by triplicate. Statistical references are presented in each graph. * p < 0.0001 vs control, # p < Afa vs. Combo.
Figure 3
Figure 3
Membrane EGFR expression by metformin–afatinib. Cells were seeded and treated with respective schemes for 72 h, then, 5000 events were analyzed by flow cytometry with an EGFR-specific antibody. Bars represent the means of 3 independent experiments by triplicate. Statistical analysis was performed through one-way ANOVA. * p ≤ 0.05.
Figure 4
Figure 4
Effect of combination therapy metformin–afatinib on the EGFR signaling pathway. Cells were seeded and treated for 72 h with their respective metformin–afatinib concentrations. GAPDH was used as constitutive control, Western blot images were analyzed by image (NIH) and represented as bars. Images are representative of three independent experiments and results of area are presented as mean ± SD. Data were normalized regarding endogenous control and statistically analyzed by one-way ANOVA. * p ≤ 0.05, ** p ≤ 0.01, *** p ≤ 0.001, **** p ≤ 0.0001.
Figure 5
Figure 5
EMT biomarkers in NSCLC cell lines treated with metformin, afatinib, and the combination scheme. Cells were seeded and treated for 72 h with their respective metformin–afatinib concentrations. GAPDH was used as constitutive control, Western blot images were analyzed by image (NIH) and represented as bars. Images are representative of three independent experiments and results of area are presented as mean ± SD. For the zimogram assay, images are representative of two independent experiments. Data were normalized regarding endogenous control and statistically analyzed by one-way ANOVA. * p ≤ 0.05, ** p ≤ 0.01, *** p ≤ 0.001.
Figure 6
Figure 6
Effect of metformin–afatinib combined treatment on glycolytic enzymes and proteins. Cells were seeded and treated for 72 h with their respective metformin–afatinib concentrations. GAPDH was used as constitutive control, Western blot images were analyzed by image (NIH) and represented as bars. Images are representative of three independent experiments and results of area are presented as mean ± SD. Data were normalized regarding endogenous control and statistically analyzed by one-way ANOVA. * p ≤ 0.05, ** p ≤ 0.01, *** p ≤ 0.001, **** p ≤ 0.0001.
Figure 7
Figure 7
Cell glucose uptake and lactate secretion modifications. (A) For the glucose uptake assay, cells were seeded and metformin–afatinib treatment was administered in KRPH buffer over 3 h, then 2-DG6P was added and later its consumption was evaluated by ELISA. (B) Cells were seeded and later treated with metformin–afatinib for 3 h, levels of lactate present in the culture medium were measured by ELISA. Graphs represent the means of two independent experiments by duplicate. One-way ANOVA analysis was performed in order to determine statistical significance * p ≤ 0.05, ** p ≤ 0.01, *** p ≤ 0.001, **** p ≤ 0.0001.
Figure 8
Figure 8
Mechanism of action of combined treatment afatinib–metformin. In the EGFR mutant LC cell lines (H1975 and HCC827), afatinib exerts its basal inhibitory effects over the EGFR pathway, decreasing both processes, glycolysis, and EMT transition. Furthermore, this inhibition can be exacerbated with the complementary effect of metformin through AMPK stimulation and subsequent P70S6K inhibition coupled with a decrease in protein synthesis. On the other hand, the A549 cell line (EGFR wild-type) showed stimulation of the EGFR pathway associated with afatinib treatment as a single drug, however, with complementary metformin treatment, the combination can counteract the pathway activation caused by afatinib, decreasing protein synthesis, glycolytic phenotype, and EMT; also, our results suggest a sensitization of this cell line to afatinib treatment when metformin is added, acting synergistically in cytotoxic induction.

Similar articles

Cited by

References

    1. Barrón-Barrón F., Guzmán-De Alba E., Alatorre-Alexander J., Aldaco-Sarvider F., Bautista-Aragón Y., Blake-Cerda M., Blanco-Vázquez Y.C., Campos-Gómez S., Corona-Cruz J.F., Iñiguez-García M.A., et al. National Clinical Practice Guidelines for the management of non-small cell lung cancer in early, locally advanced and metastatic stages. Extended version. Salud Publica Mex. 2019;61:359–414. doi: 10.21149/9916. - DOI - PubMed
    1. Bray F., Ferlay J., Soerjomataram I., Siegel R.L., Torre L.A., Jemal A. Global cancer statistics 2018: GLOBOCAN estimates of incidence and mortality worldwide for 36 cancers in 185 countries. CA Cancer J. Clin. 2018;68:394–424. doi: 10.3322/caac.21492. - DOI - PubMed
    1. Carrot-Zhang J., Soca-Chafre G., Patterson N., Thorner A.R., Nag A., Watson J., Genovese G., Rodriguez J., Gelbard M.K., Corrales-Rodriguez L., et al. Genetic ancestry contributes to somatic mutations in lung cancers from admixed latin american populations. Cancer Discov. 2021;11:591–598. doi: 10.1158/2159-8290.CD-20-1165. - DOI - PMC - PubMed
    1. Malhotra J., Malvezzi M., Negri E., La Vecchia C., Boffetta P. Risk factors for lung cancer worldwide. Eur. Respir. J. 2016;48:889–902. doi: 10.1183/13993003.00359-2016. - DOI - PubMed
    1. Arrieta O., Cardona A.F., Martín C., Más-López L., Corrales-Rodríguez L., Bramuglia G., Castillo-Fernandez O., Meyerson M., Amieva-Rivera E., Campos-Parra A.D., et al. Updated frequency of EGFR and KRAS mutations in NonSmall-cell lung cancer in Latin America: The Latin-American consortium for the investigation of lung cancer (CLICaP) J. Thorac. Oncol. 2015;10:838–843. doi: 10.1097/JTO.0000000000000481. - DOI - PubMed