Review
. 2022 Mar 25;23(1):83.
doi: 10.1186/s13059-022-02653-7.

Statistical and machine learning methods for spatially resolved transcriptomics data analysis

Affiliations
Review

Statistical and machine learning methods for spatially resolved transcriptomics data analysis

Zexian Zeng et al. Genome Biol. .

Abstract

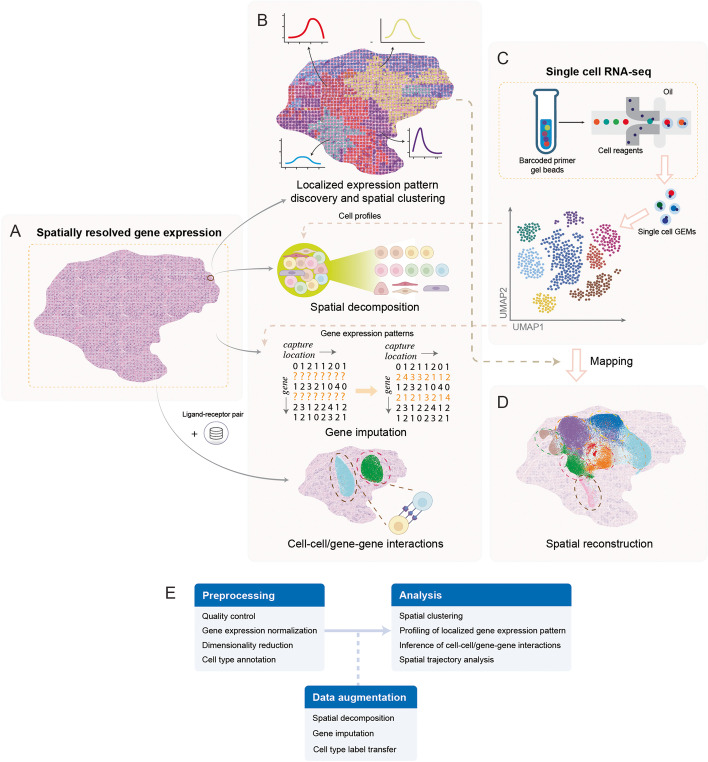
The recent advancement in spatial transcriptomics technology has enabled multiplexed profiling of cellular transcriptomes and spatial locations. As the capacity and efficiency of the experimental technologies continue to improve, there is an emerging need for the development of analytical approaches. Furthermore, with the continuous evolution of sequencing protocols, the underlying assumptions of current analytical methods need to be re-evaluated and adjusted to harness the increasing data complexity. To motivate and aid future model development, we herein review the recent development of statistical and machine learning methods in spatial transcriptomics, summarize useful resources, and highlight the challenges and opportunities ahead.


Conflict of interest statement

The authors declare that they have no competing interests.

Figures

Fig. 1
Fig. 1
Applications of computational approaches in spatial transcriptomics research. A Spatially resolved transcriptomics measures transcriptomes while preserving spatial information. Although spatial transcriptomics data retains spatial information, it is compromised with low cellular resolution and read coverage. B Computational approaches capable of harnessing the complexity of spatial transcriptomics data have been developed for applications of localized gene expression pattern identification, spatial decomposition, gene imputation, and cell-cell interaction. Some of these models leverage gene expression profiles from single-cell RNA-seq (scRNA-seq) data or prior ligand-receptor information from relevant databases to aid spatial transcriptomics research. C Sequencing protocols for scRNA-seq have achieved high-throughput profiling at single-cell resolution, but cellular spatial information is lost during sequencing. Compared to spatial transcriptomics, scRNA-seq is more accessible and can reach cellular resolution. D By leveraging information from the spatial transcriptomics data, spatial location reconstruction could be performed for scRNA-seq data with missing spatial information. In addition, spatial locations could be reconstructed de novo by integrating prior knowledge such as ligand-receptor pair information. E A typical analysis workflow for spatial transcriptomics data. GEMs, Gel beads-in-emulsions; UMAP, uniform manifold approximation and projection
Fig. 2
Fig. 2
Model workflow testing independencies between gene expression and spatial locations in spatial transcriptomics data. A Spatial transcriptomics technology has enabled multiplexed profiling of cellular transcriptomes and spatial locations. B In spatial transcriptomics data, the transcriptome information is represented by a matrix with genes as rows and spatial locations as columns. Distances between the spatial locations are obtained based on their coordinates. C Covariance matrices of gene expressions and spatial coordinates are calculated based on the gene expression and spatial coordinates, respectively. D Test of significance on whether the gene expressions are independent of the spatial coordinates using the covariance matrices. E Model spatial transcriptomics data using graphs, where each node corresponds to a spatial location, and two nodes are connected if they have proximate locations or similar expression profiles. Graph convolutional networks can aggregate features from each spatial location’s neighbors through convolutional layers and utilize the learned representation to perform node classification, community detection, and link prediction. Extended applications include spatial decomposition, localized expression pattern identification, and cell-cell interaction inference
Fig. 3
Fig. 3
Leveraging expression profiles from scRNA-seq data and spatial patterns from spatial transcriptomics data benefits the analysis of both types of data. A In sequencing protocols where the size of the capture location is larger than a cell, multiple cells are profiled as a mixture. Cell type-specific expression profiles derived from scRNA-seq data can be used to estimate cell type proportions at different capture locations. B With both scRNA-seq and spatial transcriptomics data projected to and clustered in a common latent space, complementary information from one type of data can be used for imputing features missing from the other type, for instance, spatial pattern prediction for scRNA-seq data and gene imputation for spatial transcriptomics data. C Graphs can next be constructed based on the feature similarities in the latent space, allowing downstream graph-based methods such as graph convolutional networks. UMAP, uniform manifold approximation and projection

References

    1. Lubeck E, Cai L. Single-cell systems biology by super-resolution imaging and combinatorial labeling. Nat Methods. 2012;9:743–748. - PMC - PubMed
    1. Lubeck E, Coskun AF, Zhiyentayev T, Ahmad M, Cai L. Single-cell in situ RNA profiling by sequential hybridization. Nat Methods. 2014;11:360–361. - PMC - PubMed
    1. Chen KH, Boettiger AN, Moffitt JR, Wang S, Zhuang X. Spatially resolved, highly multiplexed RNA profiling in single cells. Science. 2015;348:aaa6090. - PMC - PubMed
    1. Stahl PL, Salmen F, Vickovic S, Lundmark A, Navarro JF, Magnusson J, Giacomello S, Asp M, Westholm JO, Huss M, et al. Visualization and analysis of gene expression in tissue sections by spatial transcriptomics. Science. 2016;353:78–82. - PubMed
    1. Shah S, Lubeck E, Zhou W, Cai L. In situ transcription profiling of single cells reveals spatial organization of cells in the mouse hippocampus. Neuron. 2016;92:342–357. - PMC - PubMed

Publication types