Replacement per- and polyfluoroalkyl substances (PFAS) are potent modulators of lipogenic and drug metabolizing gene expression signatures in primary human hepatocytes
- PMID: 35337807
- PMCID: PMC9036616
- DOI: 10.1016/j.taap.2022.115991
Replacement per- and polyfluoroalkyl substances (PFAS) are potent modulators of lipogenic and drug metabolizing gene expression signatures in primary human hepatocytes
Abstract
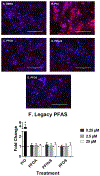
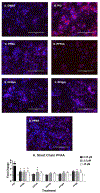
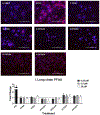
Per- and polyfluoroalkyl substances (PFAS) are a class of environmental toxicants, and some, such as perfluorooctanesulfonic acid (PFOS) and perfluorooctanoic acid (PFOA), have been associated with hepatic steatosis in rodents and monkeys. It was hypothesized that perfluorosulfonic acids (C4, 6, 8), perfluorocarboxylic acids (C4-14), perfluoro(2-methyl-3-oxahexanoic) acid (HFPO-DA), 1H, 1H, 2H, 2H-perfluorooctanesulfonic acid (6:2 FTS) along with 3 PFOS precursors could induce expression of lipid metabolism genes and lipid deposition in human hepatocytes. Five-donor pooled cryopreserved human hepatocytes were cultured and treated with 0.1% DMSO vehicle or various PFAS (0.25 to 25 μM) in media. After a 48-h treatment, mRNA transcripts related to lipid transport, metabolism, and synthesis were measured using a Quantigene Plex assay. After 72-h treatments, hepatocytes were stained with Nile Red dye to quantify intracellular lipids. Overall, PFAS were transcriptionally active at 25 μM. In this model, lipid accumulation was not observed with C8-C12 treatments. Shorter chain PFAS (C4-C5), 6:2 FTS, and PFOS precursor, metFOSA, induced significant liver lipid accumulation, and gene activation at lower concentrations than legacy PFAS. In summary short chain PFAS and other alternative PFAS were more potent gene inducers, and potential health effects of replacement PFAS should be critically evaluated in humans.
Keywords: Human hepatocytes; Lipids; PFAS; Perfluorinated compounds.
Copyright © 2022 Elsevier Inc. All rights reserved.
Conflict of interest statement
Declaration of interests
The authors declare that they have no known competing financial interests or personal relationships that could have appeared to influence the work reported in this paper.
Figures


Similar articles
-
Legacy and alternative per- and polyfluoroalkyl substances (PFAS) alter the lipid profile of HepaRG cells.Toxicology. 2024 Aug;506:153862. doi: 10.1016/j.tox.2024.153862. Epub 2024 Jun 10. Toxicology. 2024. PMID: 38866127
-
An assessment of serum-dependent impacts on intracellular accumulation and genomic response of per- and polyfluoroalkyl substances in a placental trophoblast model.Environ Toxicol. 2020 Dec;35(12):1395-1405. doi: 10.1002/tox.23004. Epub 2020 Aug 13. Environ Toxicol. 2020. PMID: 32790152 Free PMC article.
-
Impact of perfluoroalkyl substances (PFAS) and PFAS mixtures on lipid metabolism in differentiated HepaRG cells as a model for human hepatocytes.Arch Toxicol. 2024 Feb;98(2):507-524. doi: 10.1007/s00204-023-03649-3. Epub 2023 Dec 20. Arch Toxicol. 2024. PMID: 38117326 Free PMC article.
-
Health-related toxicity of emerging per- and polyfluoroalkyl substances: Comparison to legacy PFOS and PFOA.Environ Res. 2022 Sep;212(Pt C):113431. doi: 10.1016/j.envres.2022.113431. Epub 2022 May 13. Environ Res. 2022. PMID: 35569538 Review.
-
Per- and Polyfluoroalkyl Substances (PFAS): Significance and Considerations within the Regulatory Framework of the USA.Int J Environ Res Public Health. 2021 Oct 23;18(21):11142. doi: 10.3390/ijerph182111142. Int J Environ Res Public Health. 2021. PMID: 34769660 Free PMC article. Review.
Cited by
-
Risk-based prioritization of PFAS using phenotypic and transcriptomic data from human induced pluripotent stem cell-derived hepatocytes and cardiomyocytes.ALTEX. 2024;41(3):363-381. doi: 10.14573/altex.2311031. Epub 2024 Feb 22. ALTEX. 2024. PMID: 38429992 Free PMC article.
-
Metabolomic, Lipidomic, Transcriptomic, and Metagenomic Analyses in Mice Exposed to PFOS and Fed Soluble and Insoluble Dietary Fibers.Environ Health Perspect. 2022 Nov;130(11):117003. doi: 10.1289/EHP11360. Epub 2022 Nov 4. Environ Health Perspect. 2022. PMID: 36331819 Free PMC article.
-
Associations of perfluoroalkyl substances with metabolic-associated fatty liver disease and non-alcoholic fatty liver disease: NHANES 2017-2018.Cancer Causes Control. 2024 Sep;35(9):1271-1282. doi: 10.1007/s10552-024-01865-5. Epub 2024 May 19. Cancer Causes Control. 2024. PMID: 38764062
-
Assessment of Mouse Liver Histopathology Following Exposure to HFPO-DA With Emphasis on Understanding Mechanisms of Hepatocellular Death.Toxicol Pathol. 2023 Jan;51(1-2):4-14. doi: 10.1177/01926233231159078. Epub 2023 Mar 29. Toxicol Pathol. 2023. PMID: 36987989 Free PMC article.
-
Effects of PFAS on human liver transporters: implications for health outcomes.Toxicol Sci. 2024 Aug 1;200(2):213-227. doi: 10.1093/toxsci/kfae061. Toxicol Sci. 2024. PMID: 38724241 Free PMC article. Review.
References
-
- Abe T, Takahashi M, Kano M, Amaike Y, Ishii C, Maeda K, Kudoh Y, Morishita T, Hosaka T, Sasaki T, Kodama S, Matsuzawa A, Kojima H, Yoshinari K, 2017. Activation of nuclear receptor CAR by an environmental pollutant perfluorooctanoic acid. Arch Toxicol 91, 2365–2374. 10.1007/s00204-016-1888-3 - DOI - PubMed
Publication types
MeSH terms
Substances
Grants and funding
LinkOut - more resources
Full Text Sources
Miscellaneous

