. 2022 Mar 25;13(1):1590.
doi: 10.1038/s41467-022-28423-4.

Integrating deep learning and unbiased automated high-content screening to identify complex disease signatures in human fibroblasts

Affiliations

Integrating deep learning and unbiased automated high-content screening to identify complex disease signatures in human fibroblasts

Lauren Schiff et al. Nat Commun. .

Abstract

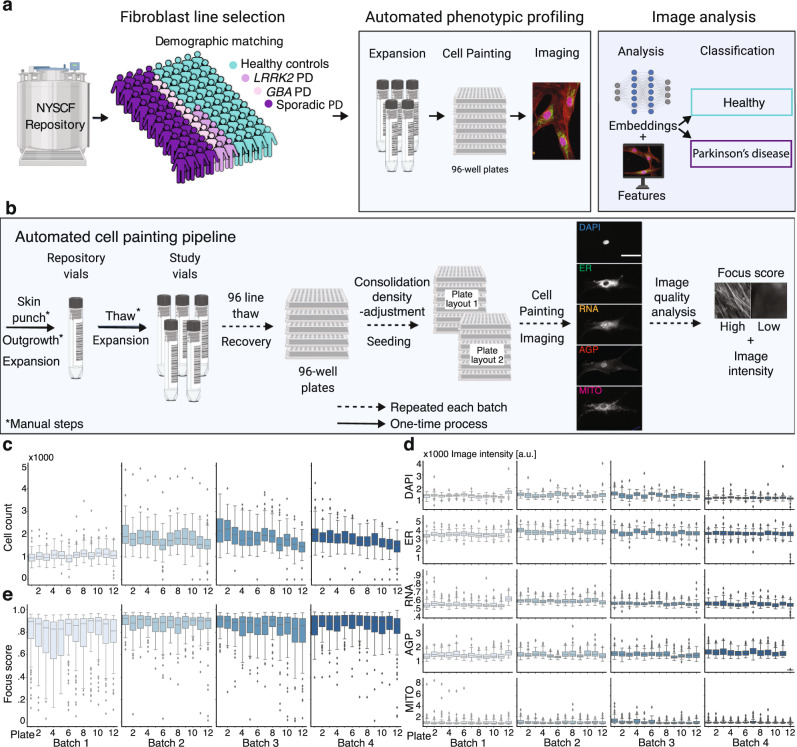
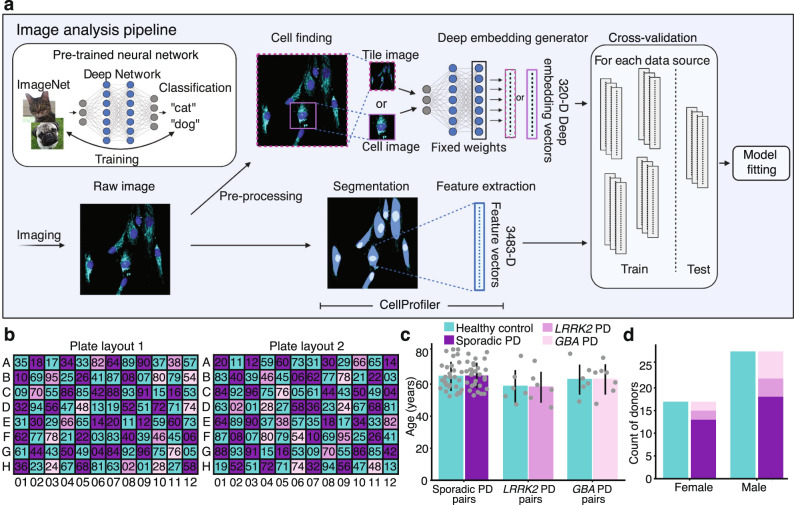
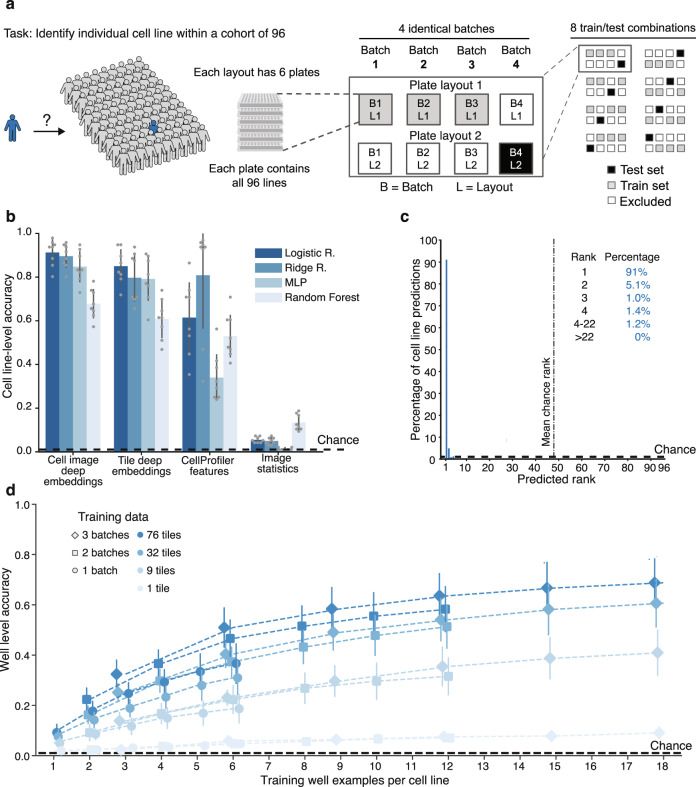
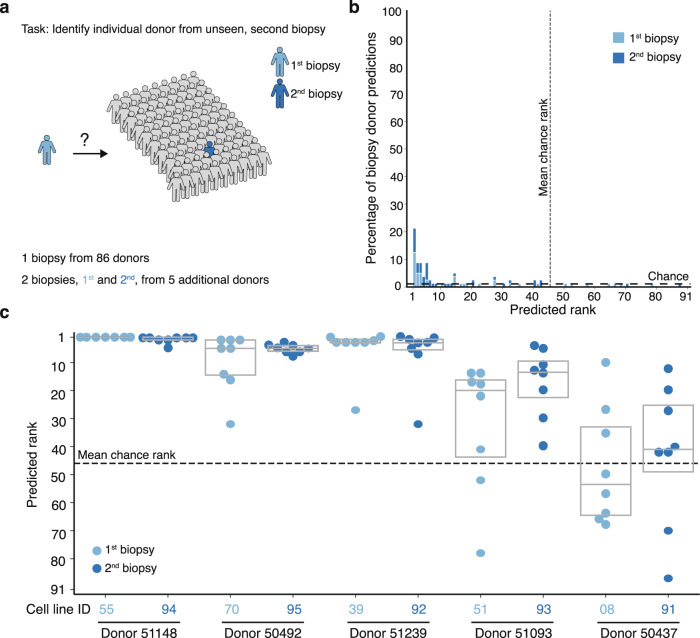
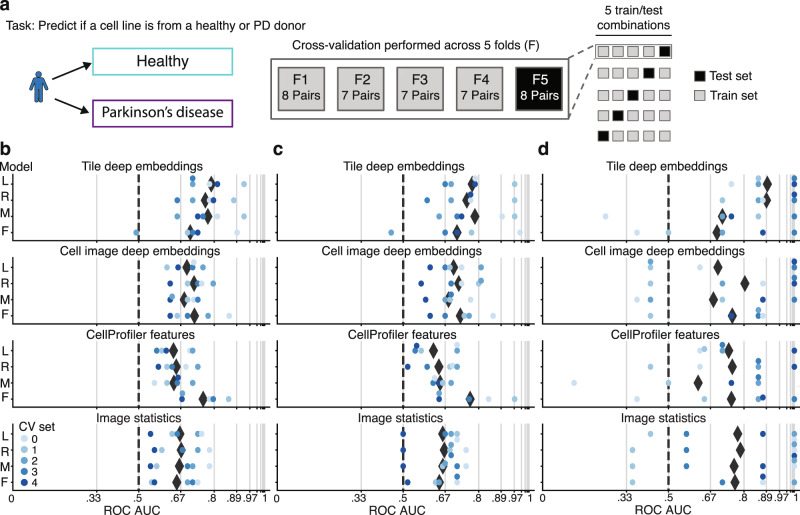
Drug discovery for diseases such as Parkinson's disease are impeded by the lack of screenable cellular phenotypes. We present an unbiased phenotypic profiling platform that combines automated cell culture, high-content imaging, Cell Painting, and deep learning. We applied this platform to primary fibroblasts from 91 Parkinson's disease patients and matched healthy controls, creating the largest publicly available Cell Painting image dataset to date at 48 terabytes. We use fixed weights from a convolutional deep neural network trained on ImageNet to generate deep embeddings from each image and train machine learning models to detect morphological disease phenotypes. Our platform's robustness and sensitivity allow the detection of individual-specific variation with high fidelity across batches and plate layouts. Lastly, our models confidently separate LRRK2 and sporadic Parkinson's disease lines from healthy controls (receiver operating characteristic area under curve 0.79 (0.08 standard deviation)), supporting the capacity of this platform for complex disease modeling and drug screening applications.


Conflict of interest statement

Y.C., M.F., S.A., A.G., S.V., A.N., Z.A., B.W., J.K., M.C., E.A.B., O.P., A.D., P.C.N., M.F., M.B., and S.J.Y. were employed by Google. M.F., A.G., S.V., A.N., Z.A., B.W., J.K., M.C., E.A.B., O.P., P.C.N., M.F., M.B., and S.J.Y. own Alphabet stock. The remaining authors declare no competing interests.

Figures

Fig. 1
Fig. 1. Automated high-content profiling platform demonstrates reproducibility across batches.
a Workflow overview. b Overview of automated experimental pipeline. Scale bar: 35 μm. Running this pipeline yielded low variation across batches in: c well-level cell count; d well-level foreground staining intensity distribution per channel and plate; and e well-level image focus across the endoplasmic reticulum (ER) channel per plate, for n = 96 wells per plate. Box plot components are: horizontal line, median; box, interquartile range; whiskers, 1.5× interquartile range; black squares, outliers.
Fig. 2
Fig. 2. Image analysis pipeline and rigorous experimental design enable unbiased deep learning–based high-content screening.
a A deep embedding generator (a neural network pre-trained on an independent object recognition task) maps each tile or cell image independently to a deep embedding vector, which along with CellProfiler features and basic image statistics were used as data sources for model fitting and evaluation for supervised learning prediction tasks including healthy vs. PD classification. b Two 96-well plate layouts used in each experimental batch control for location biases. In each layout, each well contained cells from one cell line denoted by the two-digit label. The second layout consisted of diagonally translating each of the four quadrants of the first. n = 45 healthy controls and n = 45 PD patients were matched in pairs based on demographics, including by c age and d sex. Data are presented as mean values ± standard deviation.
Fig. 3
Fig. 3. Robust identification of individual cell lines across batches and plate layouts.
a 96-way cell line classification task uses a cross-validation strategy with held-out batch and plate-layout. b Test set cell line–level classification accuracy is much higher than chance for both deep image embeddings and CellProfiler features using a variety of models (logistic regression, ridge regression, multilayer perceptron (MLP), and random forest). Error bars denote standard deviation across 8 batch/plate layouts. c Histogram of cell line–level predicted rank of true cell line for the logistic regression model trained on cell image deep embeddings from b shows that the correct cell line is ranked first in 91% of cases. d A multilayer perceptron model trained on smaller cross sections of the entire dataset, down to a single well (average of cell image deep embeddings across 76 tiles) per cell line, can identify a cell line in a held-out batch and plate layout with higher than chance well-level accuracy; accuracy rises with increasing training data. Data are presented as mean values ± standard deviation. Dashed black lines denote chance performance.
Fig. 4
Fig. 4. Donor-specific signatures revealed in analysis of repeated biopsies from individuals.
a The 91-way biopsy donor classification task uses a cross-validation strategy with held-out cell lines, and also held-out batch and plate layout as in Fig. 3a. b Histogram and c box plots of test set cell line–level predicted rank among 91 biopsy donors of the 8 held-out batch/plate layouts for 10 biopsies (first and second from 5 individuals) assessed, showing the correct donor is identified in most cases for 4 of 5 donors. Dashed lines denote chance performance. Box plot components are: horizontal line, median; box, interquartile range.
Fig. 5
Fig. 5. PD-specific signatures identified in sporadic and LRRK2 PD primary fibroblasts.
a PD vs. healthy classification task uses a k-fold cross-validation strategy with held-out PD-control cell line pairs. Cell line–level ROC AUC, the probability of correctly ranking a random healthy control and PD cell line evaluated on held out–test cell lines for b LRRK2/sporadic PD and controls c sporadic PD and controls and d LRRK2 PD and controls, for a variety of data sources and models (logistic regression (L), ridge regression (R), multilayer perceptron (M), and random forest (F)), range from 0.79–0.89 ROC AUC for the top tile deep embedding model and 0.75–0.77 ROC AUC for the top CellProfiler feature model. Black diamonds denote the mean across all cross-validation (CV) sets. Grid line spacing denotes a doubling of the odds of correctly ranking a random control and PD cell line and dashed lines denote chance performance.
Fig. 6
Fig. 6. PD classification is driven by a large variety of cell features.
a Frequency among 5 cross-validation folds of 3 models where a CellProfiler feature was within the 1200 most significant of the 3483 features reveals a diverse set of features supporting PD classification. b Frequency of each class of Cell Painting features of the 100 most common features in a, with correlated features removed. c Images of representative cells and respective cell line–level mean (n = 74 individuals, over all 4 batches) feature values (points and box plot; point colors denote disease state) for 4 features randomly selected from those in b. Cells closest to the 25th, 50th and 75th percentiles were selected. Scale bar: 20 μm. Box plot components are: horizontal line, median; box, interquartile range; whiskers, 1.5× interquartile range. arb. units: arbitrary units. Two-sided Mann–Whitney U test: ns: P > 0.05; *0.01 < P ≤ 0.05; ****P ≤ 0.0001; P values from top to bottom: P < 0.0001, P < 0.0001, P = 0.062, P = 0.44, P = 0.15, P = 0.011, P < 0.0001, P = 0.012.

References

    1. Chandrasekaran SN, Ceulemans H, Boyd JD, Carpenter AE. Image-based profiling for drug discovery: due for a machine-learning upgrade? Nat. Rev. Drug Discov. 2020;20:1–15. doi: 10.1038/s41568-019-0232-7. - DOI - PMC - PubMed
    1. Ando, D. M., McLean, C. & Berndl, M. Improving phenotypic measurements in high-content imaging screens. Preprint (2017).
    1. Ashdown, G. W. et al. A machine learning approach to define antimalarial drug action from heterogeneous cell-based screens. Sci. Adv.6, eaba9338 (2020). - PMC - PubMed
    1. Mohs RC, Greig NH. Drug discovery and development: role of basic biological research. Alzheimers Dement. 2017;3:651–657. doi: 10.1016/j.trci.2017.10.005. - DOI - PMC - PubMed
    1. Stokes JM, et al. A deep learning approach to antibiotic discovery. Cell. 2020;180:688–702.e13. doi: 10.1016/j.cell.2020.01.021. - DOI - PMC - PubMed