. 2022 Mar 25;13(1):1625.
doi: 10.1038/s41467-022-29234-3.

A synthetic lipopeptide targeting top-priority multidrug-resistant Gram-negative pathogens

Affiliations

A synthetic lipopeptide targeting top-priority multidrug-resistant Gram-negative pathogens

Kade D Roberts et al. Nat Commun. .

Abstract

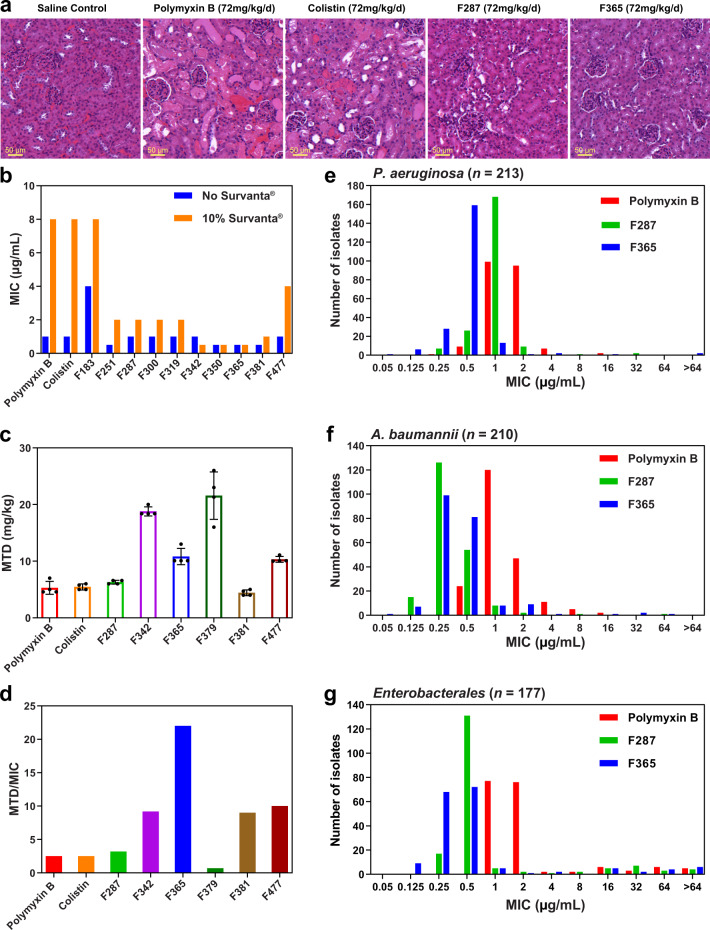
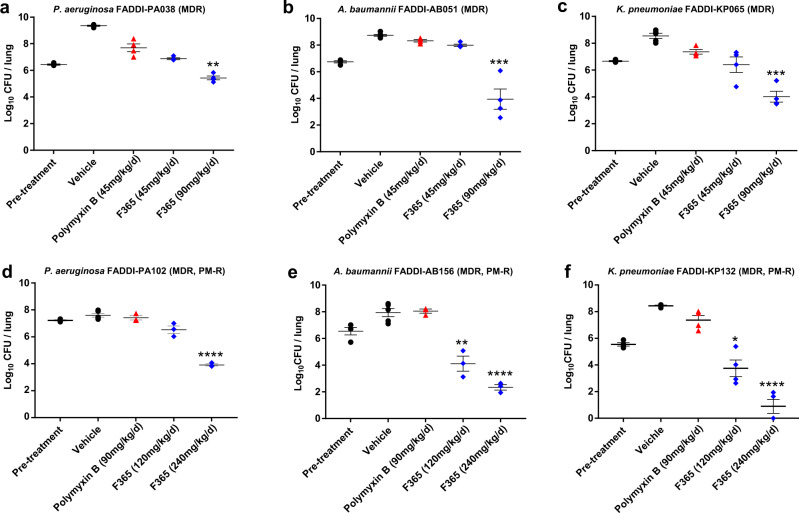
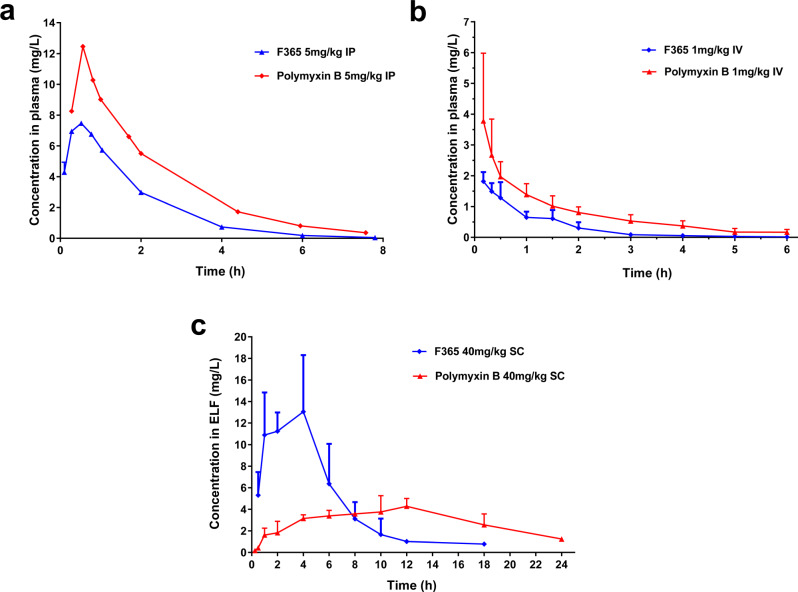
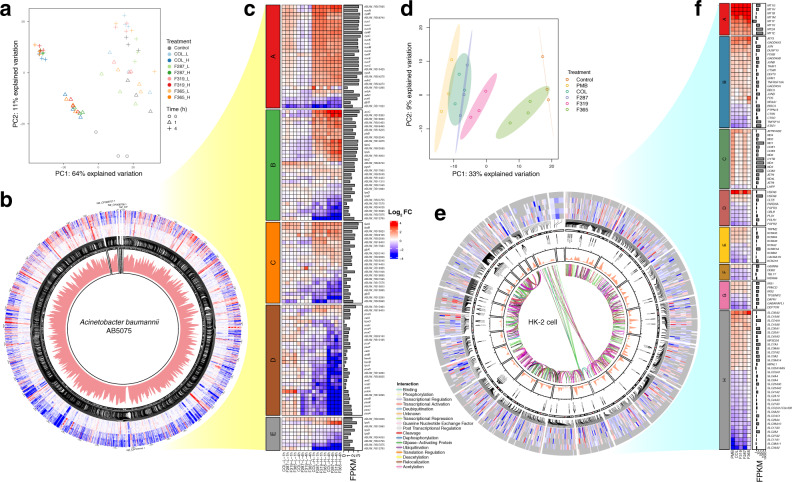
The emergence of multidrug-resistant (MDR) Gram-negative pathogens is an urgent global medical challenge. The old polymyxin lipopeptide antibiotics (polymyxin B and colistin) are often the only therapeutic option due to resistance to all other classes of antibiotics and the lean antibiotic drug development pipeline. However, polymyxin B and colistin suffer from major issues in safety (dose-limiting nephrotoxicity, acute toxicity), pharmacokinetics (poor exposure in the lungs) and efficacy (negligible activity against pulmonary infections) that have severely limited their clinical utility. Here we employ chemical biology to systematically optimize multiple non-conserved positions in the polymyxin scaffold, and successfully disconnect the therapeutic efficacy from the toxicity to develop a new synthetic lipopeptide, structurally and pharmacologically distinct from polymyxin B and colistin. This resulted in the clinical candidate F365 (QPX9003) with superior safety and efficacy against lung infections caused by top-priority MDR pathogens Pseudomonas aeruginosa, Acinetobacter baumannii and Klebsiella pneumoniae.


Conflict of interest statement

J.Li., T.V., R.L.N., K.D.R., P.E.T. are listed as inventors on the patent application WO2015149131 ‘Polymyxin Derivatives as Antimicrobial Compounds’ which covers F365 and the other lipopeptides listed in this manuscript and has been licensed to Qpex Biopharma. O.L., S.J.H., D.C.G., and M.N.D are employees of Qpex Biopharma and hold equity in that company. All other authors declare no competing interests.

Figures

Fig. 1
Fig. 1. Chemical structures of the polymyxins and lipopeptide design strategy.
a Structures of polymyxin B1, polymyxin B2, colistin A, and colistin B, the two major components in commercial polymyxin B and colistin drug products, respectively. Polymyxin B and colistin differ by only a single amino acid at position 6 (highlighted in red). The structures of the other minor components identified in commercial polymyxin B and colistin products are shown in Supplementary Table 1. b Molecular model of the interaction of a polymyxin B molecule with LPS showing key ionic and hydrophobic interactions of individual residues. c Optimization of SAR, STR, and SPR resulted in the discovery of the synthetic lipopeptide F365 (QPX9003). d Molecular model of the interaction of the F365 (QPX9003) molecule with LPS showing key ionic and hydrophobic interactions of individual residues. Although the hydrophobicity is decreased at both the N-terminus and positions 6 and 7 compared to polymyxin B, F365 appears to retain the ability to form a similar folded conformation to polymyxin B upon interacting with the LPS. Substitution of the Dab residue at position 3 to Dap, does not appear to impact the electrostatic interaction of this position with the Kdo moiety.
Fig. 2
Fig. 2. Nephrotoxicity and acute toxicity in mice and in vitro activity of polymyxin B, colistin, and synthetic lipopeptides.
a Representative kidney histology images for saline control (n = 4), polymyxin B, colistin, F287, and F365 treatment groups (n = 3) from the initial nephrotoxicity screening (Table 1). Images of saline control, F287 and F365 show no damage (SQS = 0) while polymyxin B and colistin caused severe damage (SQS = +5), including large tubular casts, areas of necrosis, acute cortical necrosis of tubules, and tubular degeneration. b MICs against P. aeruginosa ATCC 27853 for polymyxin B, colistin, and synthetic lipopeptides in the absence and presence of 10% Survanta®. c Maximum tolerated dose (MTD, mg/kg) for polymyxin B, colistin, and synthetic lipopeptides after a single IV bolus dose (n = 4, data are shown as mean ± s.d.). d Relative safety profiles for polymyxin B, colistin, and synthetic lipopeptides, measured as the ratio of average MTD to the MIC of an MDR clinical isolate P. aeruginosa FADDI-PA025 (an isolate in our initial screening panel that polymyxin B and colistin were the least active against, see Table 1). eg MIC distributions of polymyxin B, F287 and F365 against panels of MDR clinical isolates of P. aeruginosa (n = 213, 55 carbapenem-resistant), A. baumannii (n = 210, 200 carbapenem-resistant) and Enterobacterales (n = 177, including K. pneumoniae [n = 129], Escherichia coli [n = 13], Enterobacter cloacae [n = 27], K. oxytoca [n = 3], En. aerogenes [n = 1], Citrobacter freundii [n = 4]; 152 carbapenem-resistant).
Fig. 3
Fig. 3. Efficacy of F365 and polymyxin B in a neutropenic mouse pneumonia model against polymyxin-susceptible (a–c) and polymyxin-resistant (PM-R) (d–e) MDR clinical isolates.
a P. aeruginosa FADDI-PA038 (F365 MIC = 0.5 μg/mL, polymyxin B MIC = 0.5 μg/mL; n = 4). b A. baumannii FADDI-AB051 (carbapenem-resistant, F365 and polymyxin B MIC = 0.5 μg/mL; n = 4). c K. pneumoniae FADDI-KP065 (carbapenem-resistant, F365 MIC  <0.125 μg/mL, polymyxin B MIC = 0.25 μg/mL; n = 4). d P. aeruginosa FADDI-PA102 (carbapenem-resistant, F365 and polymyxin B MIC = 4 μg/mL; n = 3). e A. baumannii FADDI-AB156 (carbapenem-resistant, F365 MIC = 4 μg/mL, polymyxin B MIC = 8 μg/mL; n = 3). f K. pneumoniae FADDI-KP132 (mcr-1 positive, F365 and polymyxin B MIC = 8 μg/mL; n = 4). F365, polymyxin B or the vehicle was administered (in three divided doses) intraperitoneally (ac) or subcutaneously (df) every 8 h over 24 h. Data are shown as mean ± s.e.m. Two-tailed one-way ANOVA with Tukey HSD post-hoc test (FDR adjustment for multiple comparisons) was used to compare different groups. Statistical details are provided as a Source Data file. FDR-adjusted P-values *P < 0.05, **P < 0.01, ***P < 0.001, ****P < 0.0001 relative to the pre-treatment group. EUCAST breakpoints of colistin were employed: Susceptible ≤ 2 μg/mL, Resistant > 2 μg/mL.
Fig. 4
Fig. 4. Pharmacokinetics of F365 and polymyxin B in rodents.
a Plasma concentration versus time profiles of F365 and polymyxin B (n = 3 mice) following an intraperitoneal dose (5 mg/kg) in mice. b Plasma concentration versus time profiles of F365 (n = 5 rats) and polymyxin B (n = 11 rats) following an intravenous dose (1 mg/kg) in rats. c ELF concentration versus time profiles following a subcutaneous dose (40 mg/kg) in mice (n = 3 mice). All data are shown as mean ± s.d.
Fig. 5
Fig. 5. Gene expression changes in A. baumannii AB5075 and HK-2 following treatments with polymyxin B (PMB, HK-2 only), colistin (COL), F287, F319 and F365.
a PCA plot of gene expression in A. baumannii AB5075. b Gene expression changes in A. baumannii AB5075 following treatments with colistin and synthetic lipopeptides at low (L) and high (H) concentrations at 1 and 4 h (n = 3 biologically independent samples). Data from innermost-to-outermost circles are the average values of normalized read abundance (FPKM) under all treatments, gene names, and heatmap of gene expression changes (linear model and empirical Bayes statistics for differential expression in limma package, fold change ≥ 2, FDR-adjusted P-value ≤ 0.05). Enlarged for details. c Heatmap of key gene expression changes and average values of normalized read abundance (FPKM, in log10 scale) under all treatments. Groups of genes: (A) respiration; (B) fatty acid biosynthesis; (C) fatty acid degradation; (D) aromatic compound degradation; (E) lipid A biosynthesis. d PCA plot of gene expression in HK-2. e Gene expression changes in HK-2 cells following treatments with colistin and synthetic lipopeptides at 24 h (n = 3 biologically independent samples). Data from innermost-to-outermost circles are gene regulation pairs from Signor database, averaged read abundance (FPKM), critical genes of polymyxin toxicity identified by previous CRISPR screening, chromosome cytotypes, and heatmap of gene expression changes (linear model and empirical Bayes statistics for differential expression in limma package, fold change ≥ 1.5, FDR-adjusted P-value < 0.05) under treatments with polymyxin B, colistin, F287, F319, and F365, with insignificant genes indicated by gray. Enlarged for detail. f Heatmap of key gene expression changes and averaged values of normalized read abundance (FPKM, in log10 scale) under all treatments. Groups of genes: (A) metallothionein; (B) apoptosis; (C) mitochondrial respiratory chain; (D) endocytosis; (E) ion channels; (F) ubiquitination; (G) cell proliferation; (H) SLC transporter family. Fig. 5c, f share the same Log2FC scale bar. Source data are provided as a Source Data file.
Fig. 6
Fig. 6. Transcriptomic changes in human kidney proximal tubular HK-2 cells following treatments with polymyxin B (PMB), colistin (COL), F287, F319, and F365.
a Numbers of differentially expressed genes. Distinctive intersections are color-coded. b Cell viability difference (two-tailed Student’s t-test, n = 4 biologically independent cells, Benjamini–Hochberg adjusted P-values) between wild-type HK-2 and KCNJ16 knockout (KO) cells following 24 h treatment with lipopeptides. n.s., not significant; *adjusted P < 0.05, **adjusted P < 0.01, ***adjusted P < 0.001. Data are shown as mean ± s.d. and individual data points. c Extracted transcriptional regulatory network from Signor database with 1-step neighbor constraints (enlarged for detail). Source data are provided as a Source Data file.
Fig. 7
Fig. 7. ME-SALDI-MS imaging of polymyxin distribution, accumulation, and metabolism in mouse kidneys.
Mice (n = 3) were administered lipopeptides (10 μmol/kg) subcutaneously, 6 doses (2-h interval) on Day 1 and 3 doses (2-h interval) on Day 2. Histological examination revealed that all the kidneys exposed to polymyxin B1, polymyxin B2, colistin A, and colistin B had severe microscopic damage with SQS scores up to +5; whereas the kidneys exposed to F365 showed no significant microscopic damage and were not graded for damage. a Representative cryo-images of mouse kidney tissue sections after treatment with polymyxin B1, colistin A, F365, and saline control; and the corresponding ME-SALDI-MS image of the tissue sections after scanning for the parent ions [M + K]+ for polymyxin B1, colistin A, F365, respectively. b Representative ME-SALDI-MS images highlighting the distribution and accumulation of polymyxin B1, polymyxin B2, colistin A, colistin B, and F365 in mouse kidney tissue. c Representative ME-SALDI-MS images showing the distribution and accumulation of F365 and its metabolites M2 and M3 in mouse kidney tissue after treatment. All ME-SALDI-MS images were normalized to total ion count based on the highest intensity peak across each tissue section and its corresponding concentration curve. Selected lipopeptide-related ions are displayed with a scale between 0 and 40% relative to the highest intensity peak in the summed spectrum of the whole tissue. A default color intensity gradient is used to visualize and differentiate low concentrations (purple to blue), mid-range concentrations (green to yellow), and high concentrations (orange to red) of lipopeptide disposition.

References

    1. Brown ED, Wright GD. Antibacterial drug discovery in the resistance era. Nature. 2016;529:336–343. doi: 10.1038/nature17042. - DOI - PubMed
    1. World Health Organization. Global Priority List of Antibiotic-Resistant Bacteria to Guide Research, Discovery, and Development of New Antibiotics. (World Health Organization, 2017).
    1. Barbier F, Andremont A, Wolff M, Bouadma L. Hospital-acquired pneumonia and ventilator-associated pneumonia: recent advances in epidemiology and management. Curr. Opin. Pulm. Med. 2013;19:216–228. doi: 10.1097/MCP.0b013e32835f27be. - DOI - PubMed
    1. Bassetti M, et al. Risk stratification and treatment of ICU-acquired pneumonia caused by multidrug-resistant/extensively drug-resistant/pandrug-resistant bacteria. Curr. Opin. Crit. Care. 2018;24:385–393. doi: 10.1097/MCC.0000000000000534. - DOI - PubMed
    1. Ibn Saied W, et al. A comparison of the mortality risk associated with ventilator-acquired bacterial pneumonia and nonventilator ICU-acquired bacterial pneumonia. Crit. Care Med. 2019;47:345–352. doi: 10.1097/CCM.0000000000003553. - DOI - PubMed

Publication types

MeSH terms