. 2022 Mar 25;13(1):1618.
doi: 10.1038/s41467-022-29227-2.

Comprehensive characterization of PTEN mutational profile in a series of 34,129 colorectal cancers

Affiliations

Comprehensive characterization of PTEN mutational profile in a series of 34,129 colorectal cancers

Ilya G Serebriiskii et al. Nat Commun. .

Abstract

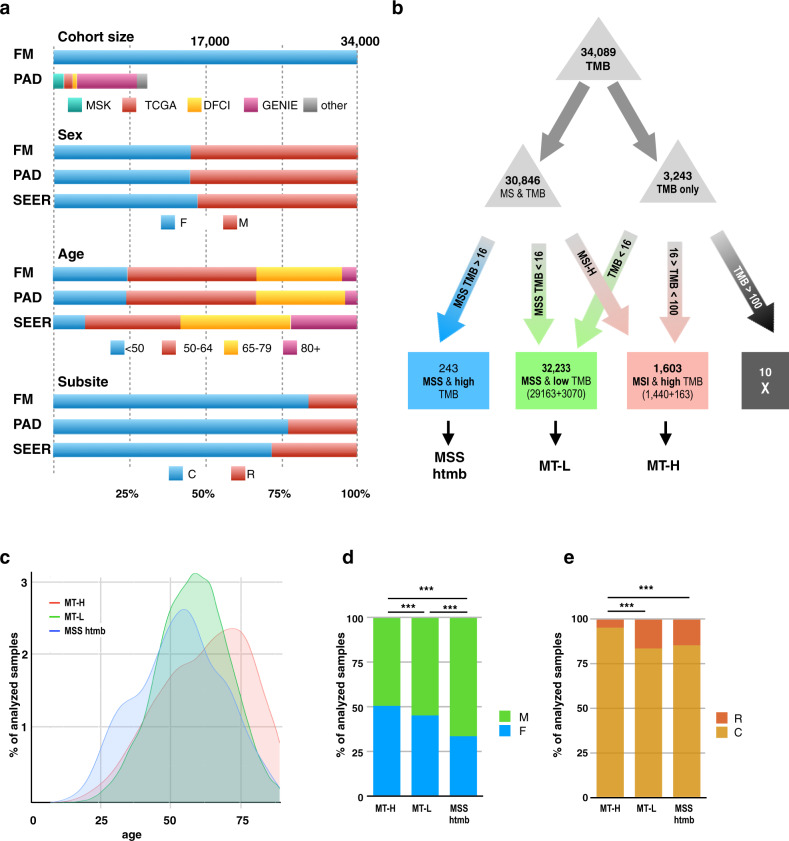
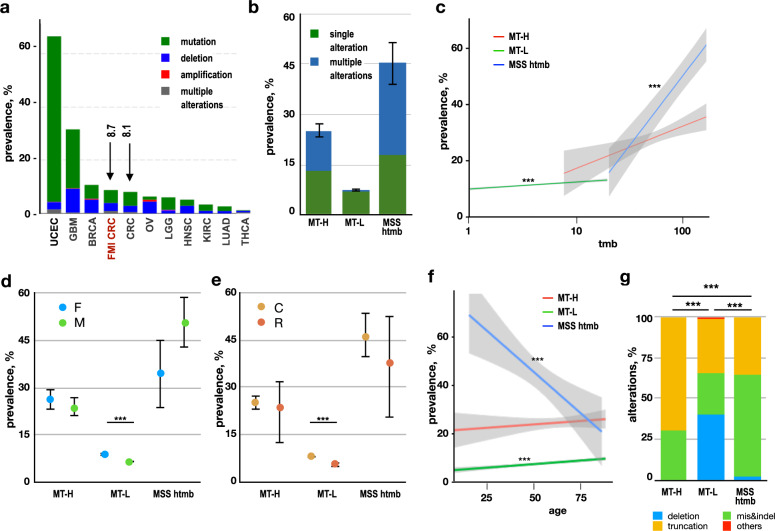
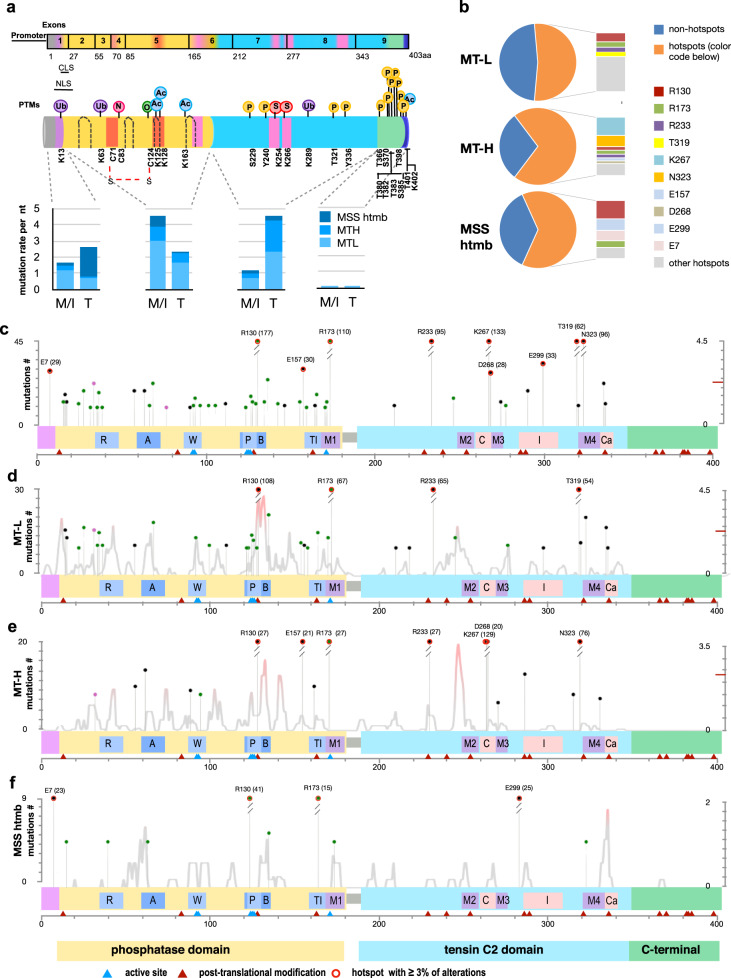
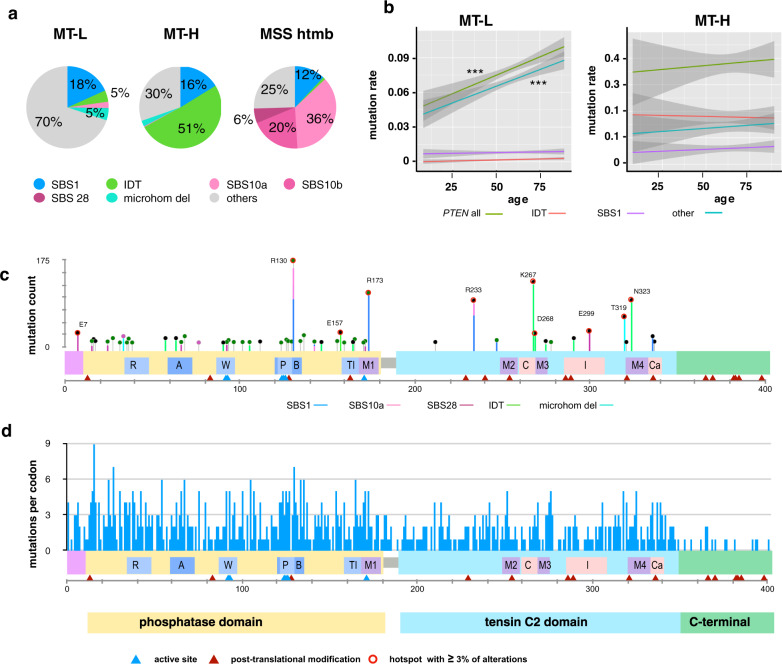
Loss of expression or activity of the tumor suppressor PTEN acts similarly to an activating mutation in the oncogene PIK3CA in elevating intracellular levels of phosphatidylinositol (3,4,5)-trisphosphate (PIP3), inducing signaling by AKT and other pro-tumorigenic signaling proteins. Here, we analyze sequence data for 34,129 colorectal cancer (CRC) patients, capturing 3,434 PTEN mutations. We identify specific patterns of PTEN mutation associated with microsatellite stability/instability (MSS/MSI), tumor mutational burden (TMB), patient age, and tumor location. Within groups separated by MSS/MSI status, this identifies distinct profiles of nucleotide hotspots, and suggests differing profiles of protein-damaging effects of mutations. Moreover, discrete categories of PTEN mutations display non-identical patterns of co-occurrence with mutations in other genes important in CRC pathogenesis, including KRAS, APC, TP53, and PIK3CA. These data provide context for clinical targeting of proteins upstream and downstream of PTEN in distinct CRC cohorts.


Conflict of interest statement

J.N. and G.F. are employed by FMI and own stock in Roche. The remaining authors declare no competing interests.

Figures

Fig. 1
Fig. 1. Overall characterization of the dataset.
a Comparison of FMI dataset in the present study versus a benchmark group of publicly available data (PAD) for colorectal cancer (CRC) published by Memorial Sloan-Kettering (MSK), the Dana Farber Cancer Institute (DFCI), the Genomics Evidence Neoplasia Information Exchange (GENIE), and The Cancer Genome Atlas (TCGA). Population characteristics are also compared to the overall population reported in SEER (Surveillance, Epidemiology, and End Results); contents accessed 5.5.2020. b Flowchart and analysis tree for populations defined by FMI as having microsatellite instability (MSI-H) or being microsatellite stable (MSS), and/or with known tumor mutation burden (TMB) (see also c, d). TMB cutpoints of >16 and <100 were used to generate MSI-H/high TMB (MT-H), MSS/low TMB (MT-L), and MSS/high TMB (MSS-htmb) analysis cohorts. Briefly, we previously determined that a TMB = 16 mutations/Mb segregated MSI-H tumors (TMB 16) from MSS tumors (TMB < 16) in 99% of cases; similarly, in this dataset (Supplementary Fig. 1d), 98% of MSI-H tumors are above this threshold, and 99% of MSS tumors below this threshold. Hence, using this metric to segregate the remaining 3243 of 3244 tumors for which only TMB was available, all specimens with TMB < 16 were grouped with MSS tumors, resulting in 32,233 CRC tumors designated MT-L (MSS plus TMB-Low). Among tumors with defined MSI-H status, ~95% had TMB < 100; however, among tumors with a very high TMB (>100), there were comparable numbers of MSI-H and MSS tumors (Supplementary Fig. 1c, left panel). Hence, among tumors where only TMB was known, those with TMB 16, but <100 were assigned as MT-H (MSI-H plus TMB-High), and those with TMB > 100 were not considered further. Graphics design of panels a, b is slightly modified from, reporting a smaller dataset. c Age distribution of patients with CRC designated as MT-H (pink), MT-L (green), or MSS-htmb (blue). d, e Composition of the MT-H, MT-L, and MSS-htmb groups by (d) sex or (e) colon (C) versus rectum (R) tumor subsite. *** indicate p < 0.001. Sample sizes: MT-H – 1600; MT-L – 32212; MSS htmb—242. Calculated sex and subsite fractions, as well as p-values for the comparisons between subsets (calculated using the two-sample test for equality of proportions with continuity correction) are provided in Supplementary Tables 3 and 4. Summary level data for the FMI CRC dataset are provided as Supplementary Data 1.
Fig. 2
Fig. 2. Frequency of PTEN alterations.
a Frequency of PTEN alterations in distinct cancer subtypes, based on analysis of the TCGA Pancancer datasets with over 500 samples accessed through cBioportal,, benchmarked to data in this study (CRC-FMI). Green, mutation (missense, small indel); blue, deep deletion; red, amplification; purple, fusion; gray, multiple alterations. GBM glioblastoma multiforme, BRCA breast cancer, CRC colorectal cancer (COAD-READ, colon adenocarcinoma, and rectal adenocarcinoma), LGG low-grade glioma, KIRC clear cell renal cell carcinoma (kidney renal carcinoma), LUAD lung adenocarcinoma. b Frequency of tumors with PTEN alterations (any type) in MT-L, MT-H, and MSS-htmb tumors, indicating tumors bearing single (green) versus multiple (dark blue) mutations in PTEN. Sample sizes, calculated prevalence, and values of the error bars (which represent 95% confidence intervals for the prevalence of any PTEN alterations) are provided in Supplementary Table 4. c Frequency of tumors with PTEN alterations (any type) as a factor of TMB for MT-L (green), MT-H (red), or MSS-htmb (blue) tumors. Shaded areas represent 95% confidence intervals. *** indicates statistically significant trends (using logistic regression model), with p = 3.07e−15 for MT-L and p = 2.83e−10 for MSS htmb; p = 0.0053 for MT-H subset was not considered significant. d, e Frequency of tumors with PTEN mutations (any type) based on sex (panel d; F, female; M, male) or tumor subsite (panel e; C, colon; R, rectum). Error bars represent 95% confidence intervals for the estimate of the prevalence of mutations in the general population of individuals with CRC, based on the size of the current sample; relationships between PTEN mutation prevalence and patient characteristics were assessed using the two-sample test for equality of proportions with continuity correction); *** indicate p < 0.001. Sample sizes, calculated prevalence, and exact p-values are provided in Supplementary Tables 5 and 6. f Frequency of PTEN mutations (any type) based on age in the MT-L, MT-H, and MSS-htmb groups. Shaded areas represent 95% confidence intervals. *** indicates statistically significant trends (using a logistic regression model), with p = 1.6E−07 for MT-L and p = 0.00067 for MSS htmb; sample sizes, logistic regression coefficients, and exact p-values are provided in Supplementary Table 7. g Frequency of mutation types in MT-H, MT-L, and MSS-htmb CRC. Blue, deep deletion; green, missense, and inframe indels; gold, truncating (nonsense, splice, frameshift); red, others (including amplification and rearrangements). *** indicates statistically significant differences in types of mutation, with a p-value < 2.2e−16 in each case, calculated using a chi-squared contingency table test. Source data and exact proportions are provided in Supplementary Table 10. Sample sizes for panels bg: MT-H-1587; MT-L-31,772; MSS htmb-239.
Fig. 3
Fig. 3. Mutation hotspots affecting the PTEN protein.
a Top, schematic of PTEN protein domain structure. Structural domains include a phosphatidylinositol 4,5-bisphosphate (PIP2)-binding domain (PBD; 6-15aa; purple), a phosphatase domain (14–185aa; yellow), C2 domain (190–350aa; light blue), a C-terminal tail (352-402aa; green) and a PDZ-binding domain (PDZ-BD; 401–403aa; blue). ATP-binding motifs (orange), intermotifs (pink), and loops (dashed lines) are also indicated. Post-translational modifications that regulate PTEN enzymatic activity are indicated (references are in Supplementary Table 14). U: ubiquitynation; N: S-nitrosylation; O: oxidation; Ac: acetylation; S: sumoylation; P: phosphorylation. Exon structure is indicated above protein. M/I, missense or inframe indel. T, truncating mutation (frameshift, nonsense). NLS: Nuclear localization sequence (8–32aa); CLS cytoplasmic localization sequence (19–25aa). Bottom, distribution of total number of mutations in the PBD, phosphatase, C2, and C-terminal domains is indicated for the MT-L, MT-H, and MSS-htmb tumors. b Percent of total mutations occurring at hotspot mutations (piechart), and concentration of mutations at strongly preferred amino acid hotspots (>3% of total mutations observed) for MT-L (top), MT-H (middle), and MSS-htmb (bottom) tumors. cf Location of hotspots, and density of non-hotspot mutations (all classes, including truncating mutations) identified in the complete CRC cohort (c), or the MT-L (d), MT-H (e), or MSS-htmb (f) subsets. The height of each lollipop indicates the count of the corresponding mutation in the dataset (left Y-axis). Red circles on lollipops, hotspots representing >3% of total mutations observed in at least one subset. Density distribution (light gray line) represents the probability of statistically significant concentration of non-hotspot mutations along the primary structure of PTEN and is plotted as −log10(p) on the right y-axis, with the values above the indicated 2.3 threshold corresponding to p-values below 0.005. Protein features shown in cf (coordinates in aa): R, Arginine loop (35-49); A, ATP-binding type-A motif (60–73); W, WPD loop (88–98); P, P loop (123–131); B, ATP-binding type-B motif (122–136); TI, TI loop (160–171); M1, Inter-domain Motif 1 (169–180); M2, Inter-domain Motif 2 (250–259); C, CBR3 loop (260–269); M3, Inter-domain Motif 3 (264–276); I, Internal loop in C2 domain (286–309); M4, Inter-domain Motif 4 (321–334); Cα, Cα2 loop (321–342). Blue triangles, active site (aa 92, 93, 124–126, 129, 130, 171); brown triangles, most common post-translational modifications as in (a). A number of PTEN mutations analyzed in panels (bf): MT-H − 581; MT-L- 1319; MSS htmb − 203.
Fig. 4
Fig. 4. Mutation signatures associated with non-synonymous PTEN mutations affecting coding sequence.
a Distribution of mutational signatures across the CRC subtypes. A number of PTEN mutations were analyzed: MT-H − 606; MT-L − 1440; MSS htmb − 208. b Age trends for all mutations affecting PTEN nucleotide sequence, mutations associated with the SBS1 and IDT signatures, and mutations not defined by either SBS1 or IDT signatures (other). Shaded areas represent 95% confidence intervals. *** indicates statistically significant trends (using a generalized linear model), with p = 7.07E−07 for MT-L (all PTEN mutations) and p = 1.44E−06 for MT-L (non-SBS1, non-IDT PTEN mutations); sample sizes, regression coefficients, and exact p-values are provided in Supplementary Table 17. c Mutational signatures defining some of the hotspots; line color reflects key in (a). d Diversity of changes occurring at each codon. Bar height indicates the number of different alterations (including missense mutations, truncating mutations, or indels) arising from mutations at each indicated codon, underscoring the complexity of the mutational landscape.
Fig. 5
Fig. 5. Distribution of mutations in PTEN protein domains.
a Location of the key elements of the phosphatase domain on PTEN 3D structure (modeled from pdb: 1D5R). Light orange: WDP loop (aa 88–98); Limon: P loop and ATP-B binding site (123–136); Pale Cyan: TI loop (160–171); Light pink: the rest of the phosphatase domain. b 3D representation of the location of essential motifs for PTEN phosphatase function. b, c Location of missense/indel hotspots in the complete FMI CRC cohort, shown in overall structure (b) or zoomed into the catalytic cleft (c). Yellow: counts >6 (R15, D24, N31, M35, P38, R47, P95, I101, C105, H123, C124, G127, G129, T131, G132, R159, Q171, D252, and T277); Orange: counts >10 (Y27, I33, G36, Y68, H93, A126, C136, Y155, G165, and P246 (see Supplementary Table 20); Red: counts >90 (R130 and R173).
Fig. 6
Fig. 6. LPA and abundance analysis of PTEN protein associated with mutations common in distinct tumor subtypes.
a, b Distribution of lipid phosphatase activity (LPA) (a) and abundance (VAMP-seq) (b) scores for MT-L, MT-H, and MSS-htmb tumors. LPA scores less than −1.10 (horizontal dashed line) are considered significantly impaired for phosphatase activity. VAMP-seq scores of 0.4 (horizontal dashed line) or less are considered significantly less abundant than wt protein. Box plots indicate median (middle line), 25th, 75th percentile (box), and 5th and 95th percentile (whiskers). Sample sizes and box plot parameters (low whisker, 25th percentile, median, 75th percentile, high whisker) for LPA are: MT-H, n = 233, boxplotstats = (−4.79; −3.49; −2.04; −1.26; 0.41); MT-L, n = 915, boxplotstats = (5.41; −3.58; −2.69; −1.43; 1.73); MSS htmb, n = 195, boxplotstats = (−5.69; −3.38; −2.04; −1.26; 0.56), sample sizes and box plot parameters (low whisker, 25th percentile, median, 75th percentile, high whisker) for abundance data are: MT-H, n = 92, boxplotstats = (−0.08; 0.29; 0.33; 0.70; 1.24); MT-L, n = 441, boxplotstats = (−0.12; 0.25; 0.33; 0.80; 1.31); MSS htmb, n = 84, boxplotstats = (−0.05; 0.16; 0.32; 0.73; 1.24), Exact p-values for the comparisons (using a Welch’s unequal variances t-test and a Kolmogorov–Smirnov test) are provided in Supplementary Tables 21 and 22. c. Flowchart for dichotomization of variants into tentative loss of function (LoF) versus wild type-like (WT). See Materials and Methods for details. NA, information not available. d. Fraction of variants assigned as having some degree of LoF for MT-L, MT-H, and MSS-htmb tumors. Sample sizes: MT-H − 581; MT-L − 1319; MSS htmb − 203. e Combined LPA/abundance analysis for the complete CRC cohort. A pink color indicates dominant-negative variants, according to and references therein. The size of the circle represents the number of samples for a given variant. fh Distribution of mutation categories (f), lipid phosphatase activity (LPA) (g), and abundance (h) scores for the hotspot and non-hotspot subsets of PTEN mutations in the full CRC cohort. *** in (f), indicates p-value < 2.2e−16, as calculated using chi-squared contingency table test; Source Data are provided as a Source Data file. Dominant-negative mutations are significantly more common in the MT-L subset than in the MT-H subset, ~11% vs ~7.6% (p-value 0.0004), but the difference becomes insignificant if only point mutations are considered (12.4% versus 8.9%, p-value 0.24, calculated using the 2-sample test for equality of proportions with continuity correction). Box plots in (g, h) indicate median (middle line), 25th, 75th percentile (box), and 5th and 95th percentile (whiskers). *** indicates a p-value < 0.005, as calculated using a Kolmogorov–Smirnov test. Sample sizes: non-hotspots—764, hotspots—1360 (panels fh); box plot parameters and exact p-values for the comparisons are provided in Supplementary Table 23.
Fig. 7
Fig. 7. PTEN mutation patterns and copy number alterations.
a Patterns of loss of heterozygosity (LOH) in MT-L, MT-H, and MSS-htmb tumors. The values shown indicate the frequency of co-occurrence of PTEN mutations with altered copy number of PTEN alleles. The vertical axis, the estimated total PTEN copy number; a value of 1 indicates loss of one allele, while values of 3 or higher indicate increased gene copy number. The horizontal axis, the estimated copy number for the allele carrying a PTEN mutation. Numbers in the cells indicate the percent of all mutations with a combination of total/altered copy numbers, with more intense red shading emphasizing a greater abundance of the indicated combination of alleles. Sample sizes: MT-H, 601; MT-L,1332; MSS htmb, 202. b Occurrence of indicated hotspot mutations with wild type or additional mutated allele(s) (“with the second mut”) in PTEN for MT-L cohort. “Mut only”, the only mutated allele is present. Sample sizes: R130*, 81; R130G/Q, 87; R173C, 60; R173H, 48; R233*, 92; T319fs, 60. c Skewed frequency of multiple PTEN mutations. The actual frequencies of 0, 1, or >1 mutations in PTEN were normalized to the frequencies expected based on a random distribution of mutation, and the log(2) of the resulting ratio was plotted. Zero on the vertical axis would correspond to a perfect match between predicted and actual frequencies; positive values indicate higher than predicted frequencies (with 1 corresponding to 2-fold), and negative values indicate the relative scarcity versus predicted numbers. Multiple mutations appear much more frequently than by chance in MT-L and MT-H subsets, while single mutations are much less frequent in the MT-H and MSS-htmb subsets. ***indicates p-value < 0.001, using a binomial distribution model; values for ratios plotted and exact p-values are provided in Supplementary Table 25. d Specific pairwise co-occurrences of PTEN hotspot mutations. Network visualization: Edge width reflects the degree of significance (−log10 of p-value, calculated using a binomial distribution model). The green edge indicates the presence of co-occurring POLE mutations; most of these co-mutations involve the MSS-htmb cohort. A black edge indicates co-occurrence between the mutations compatible with signatures characteristic for MMR deficiency (dMMR; either IDT or SBS44). Mult. Mut—share of samples with a given mutation that co-occur with a second PTEN mutation. Node color: darker color corresponds to a higher fraction of double mutation for a given mutation. Node border: increased width and shift towards purple color indicate a higher mutation count in the examined set.
Fig. 8
Fig. 8. Co-occurrence patterns of PTEN mutations.
a Co-occurrence of LoF mutations or deletions in PTEN with any mutations in TP53, KRAS, APC, and SMAD4, in the MT-L, MT-H, and MSS-htmb cohorts. Co-occurrence is expressed as log2 of odds ratio, with the 95% confidence intervals shown (thicker bars indicate the result is statistically significant). Blue, PTEN LoF in MSS-htmb; red, PTEN LoF in MT-H; green, PTEN LoF in MT-L; orange, deletions in MT-L. Overall count of samples (panels a, d) bearing mutations in APC, 26910; KRAS, 17379; SMAD4, 7112; TP53, 26183; PIK3CA, 6665. Values for odds ratios plotted and exact p-values are provided in Supplementary Table 28. b Frequency of PTEN alteration in MT-L tumors containing mutations in A, APC; K, KRAS; P, TP53; N, none; in combinations as indicated. On the horizontal axis, the width of each column represents the fraction of MT-L tumors containing the indicated mutations in A, K, and/or P. For each group, the fraction of the overall PTEN alterations pool is indicated at the top. c Matrix of significance in PTEN alteration rate between the groups in panel (b); white, non-significant; pink to red, significant (FDR 0.05 to 10e−10). Sample sizes for groups (panels b, c): APC KRAS TP53, 9993, APC TP53, 10638; APC KRAS, 4027; KRAS TP53, 831; APC, 1177; KRAS, 850; TP53,2934; none, 783. d Co-occurrence of mutations in PTEN with mutations in PI3KCA, in subsets, as indicated. Cmbn all, all PTEN alterations in the analyzed set of CRC; MT-L all, all PTEN alterations in MT-L subset; MT-L pt, all PTEN mutations excluding copy number variations in the MT-L subset; MT-L pt LoF, same as preceding but only including PTEN mutations causing predicted loss of function; MT-L del, deletion of PTEN. Error bars indicate 95% confidence intervals. Values for odds ratios plotted and exact p-values are provided in Supplementary Table 28. e Co-occurrence of PI3KCA mutation with alterations in PTEN, as a function of age, in MT-L tumors. Orange, all alterations including deletions; blue, PTEN LoF mutations only. Data points with error bars (95% confidence intervals) crossing the horizontal axis line (OR = 1) are not statistically significant. f The TMB distribution for samples with single (pink) and multiple (blue) PTEN mutations; inset, co-occurrence of PI3KCA mutations with alterations in PTEN, as a function of the number of independent PTEN mutations in each sample (single, red, versus multiple, blue). Error bars represent 95% confidence intervals. Source Data are provided as a Source Data file.

Similar articles

Cited by

References

    1. Siegel RL, et al. Colorectal cancer statistics. CA Cancer J. Clin. 2021;71:7–33. - PubMed
    1. Dienstmann R, et al. Consensus molecular subtypes and the evolution of precision medicine in colorectal cancer. Nat. Rev. Cancer. 2017;17:79–92. - PubMed
    1. Liu Y, et al. Comparative molecular analysis of gastrointestinal adenocarcinomas. Cancer Cell. 2018;33:721–735 e728. - PMC - PubMed
    1. Benedix F, et al. Comparison of 17,641 patients with right- and left-sided colon cancer: differences in epidemiology, perioperative course, histology, and survival. Dis. Colon Rectum. 2010;53:57–64. - PubMed
    1. Loupakis, F. et al. Primary tumor location as a prognostic factor in metastatic colorectal cancer. J. Natl Cancer Inst. 107, dju427 (2015). - PMC - PubMed

Publication types

MeSH terms

Substances