. 2022 Mar 25;12(1):5205.
doi: 10.1038/s41598-022-08937-z.

Impact of baseline culture conditions of cancer organoids when determining therapeutic response and tumor heterogeneity

Affiliations

Impact of baseline culture conditions of cancer organoids when determining therapeutic response and tumor heterogeneity

Rebecca A DeStefanis et al. Sci Rep. .

Abstract

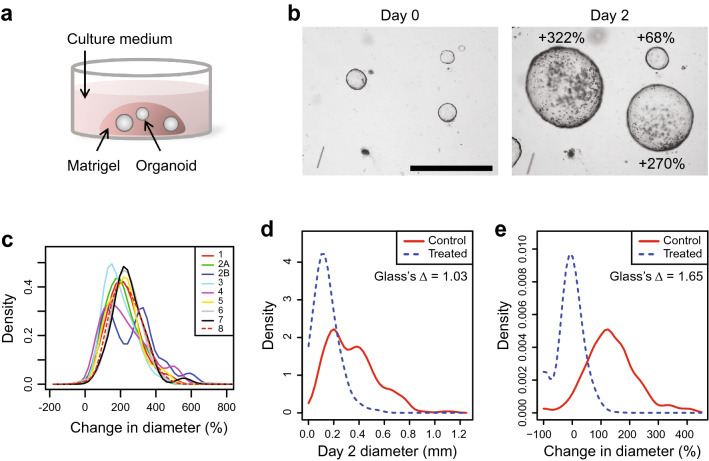
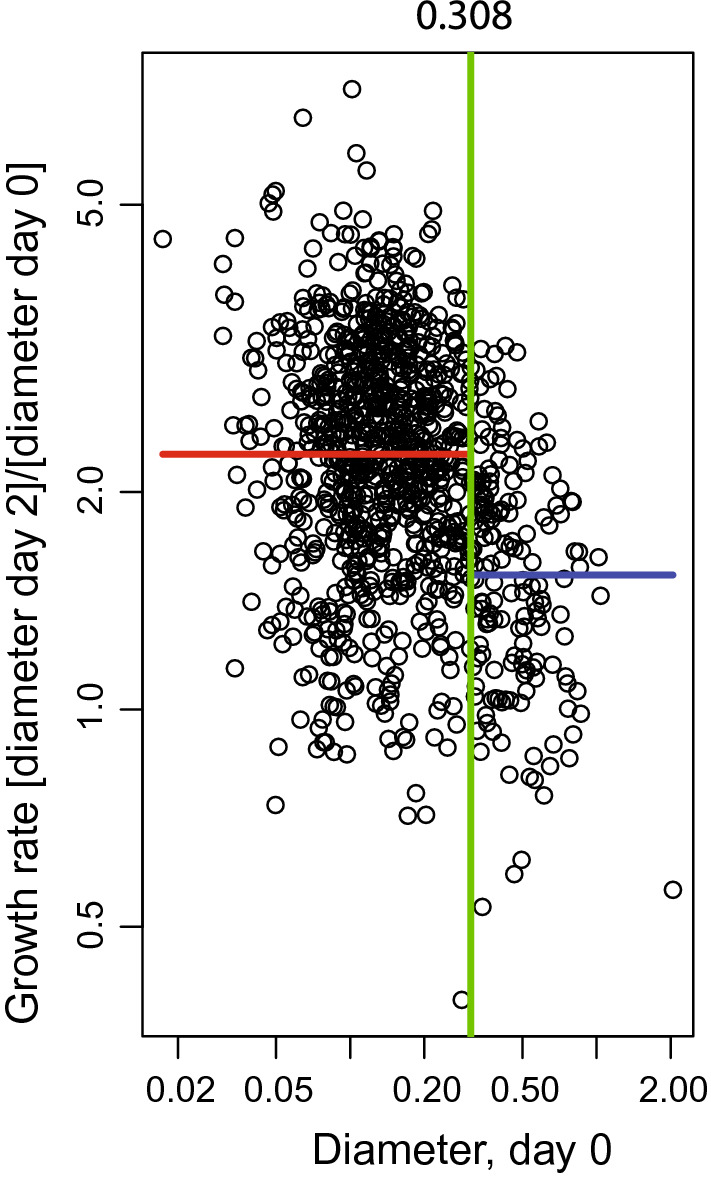
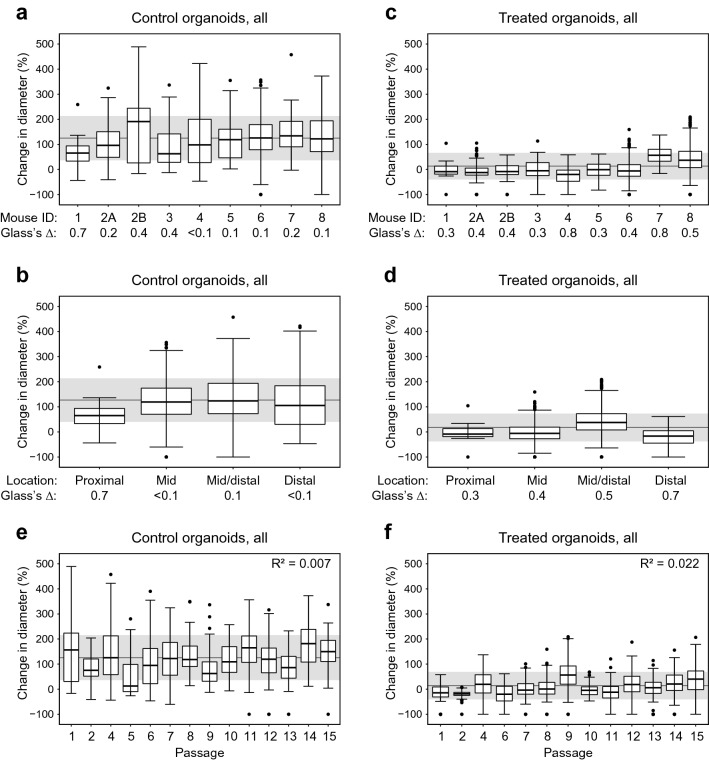
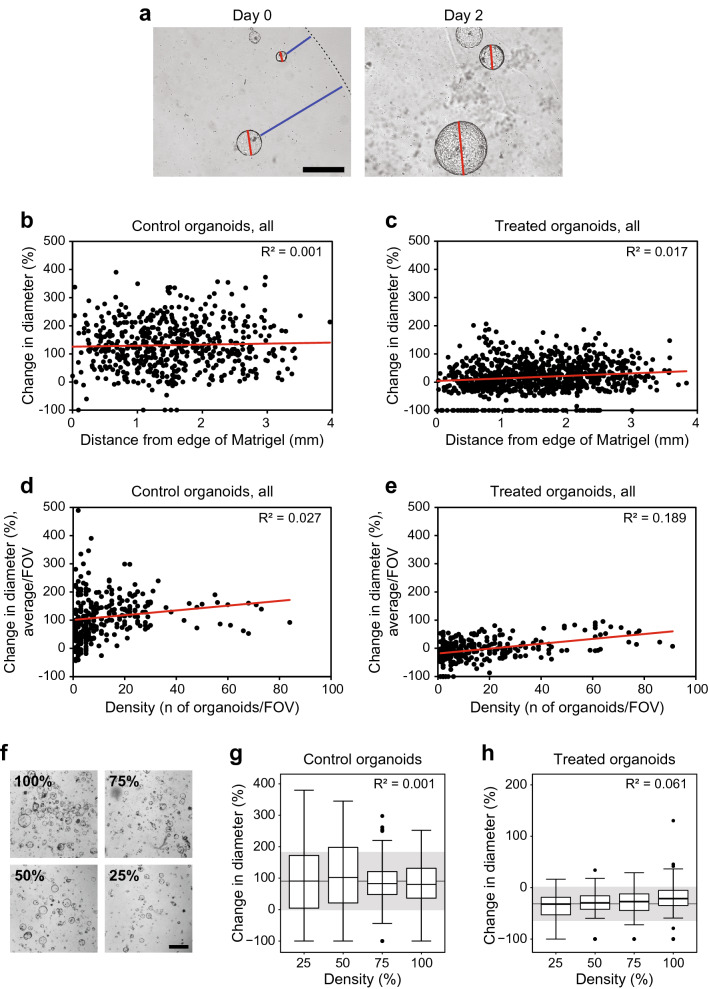
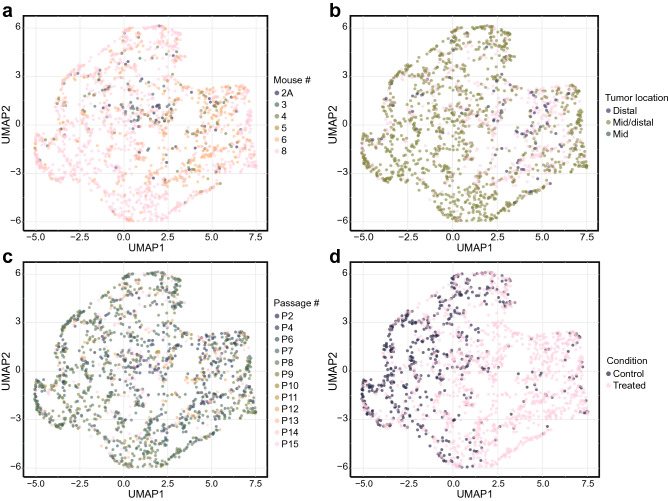
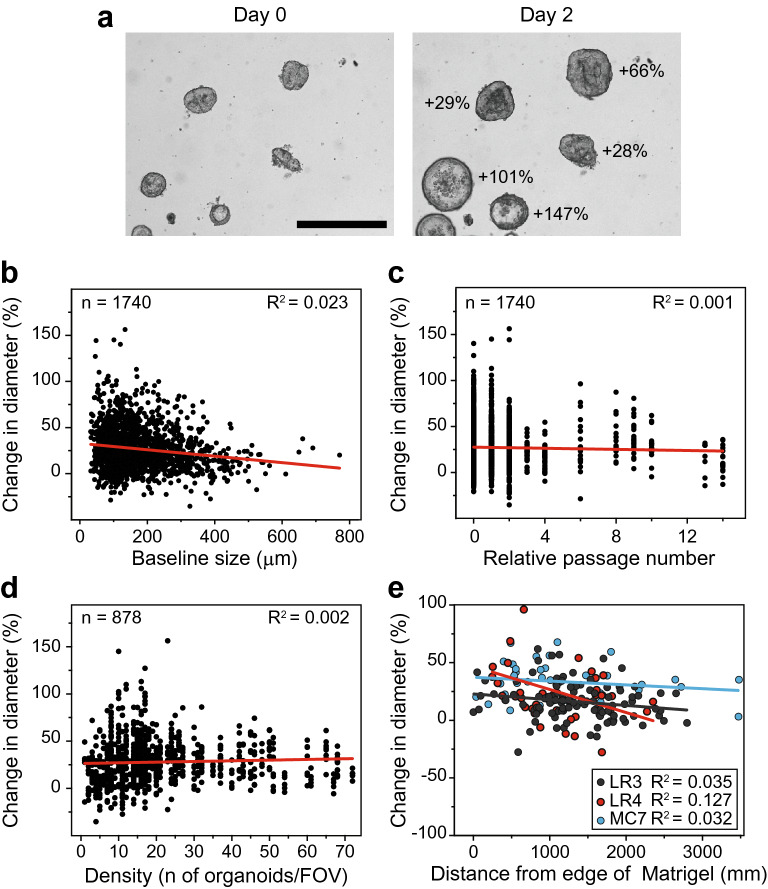
Representative models are needed to screen new therapies for patients with cancer. Cancer organoids are a leap forward as a culture model that faithfully represents the disease. Mouse-derived cancer organoids (MDCOs) are becoming increasingly popular, however there has yet to be a standardized method to assess therapeutic response and identify subpopulation heterogeneity. There are multiple factors unique to organoid culture that could affect how therapeutic response and MDCO heterogeneity are assessed. Here we describe an analysis of nearly 3500 individual MDCOs where individual organoid morphologic tracking was performed. Change in MDCO diameter was assessed in the presence of control media or targeted therapies. Individual organoid tracking was identified to be more sensitive to treatment response than well-level assessment. The impact of different generations of mice of the same genotype, different regions of the colon, and organoid specific characteristics including baseline size, passage number, plating density, and location within the matrix were examined. Only the starting size of the MDCO altered the subsequent growth. These results were corroborated using ~ 1700 patient-derived cancer organoids (PDCOs) isolated from 19 patients. Here we establish organoid culture parameters for individual organoid morphologic tracking to determine therapeutic response and growth/response heterogeneity for translational studies.


Conflict of interest statement

Dr. Deming has participated in advisory boards and received research funding from Bayer, Takeda and Eli Lilly. The other authors declare no potential conflict of interest.

Figures

Figure 1
Figure 1
Mouse derived cancer organoids grow heterogeneously within a culture. (a) Graphic illustrating how MDCOs isolated from Fc1 Apcfl/+ Pik3caH1047R mice are cultured within a Matrigel matrix, with feeding media overlayed. For therapeutic studies, overlayed feeding media is replaced with new media containing drug. (b) Kernel density plot comparing the growth of MDCOs at the population level derived from 8 different mice of the same genotype. Each line indicates the growth of MDCOs in feeding media derived from one mouse. Note that mouse 2 had two MDCO lines derived from two distinct tumors (line 2A and 2B). (c) Representative image of the heterogeneous growth rates of MDCOs within a culture over 48 h. (d) Density plot comparing the growth and response of MDCOs using only the final diameter (mm) after 48 h. This analysis represents a well level analysis where MDCOs are only evaluated on the final day of a study. Effect size was calculated using Glass’s delta to compare the treatment group to the control group. (e) Kernel density plot comparing the growth and response of MDCOs using their percent change in diameter over the 48-h incubation. This analysis examines the MDCOs on an individual level to determine how individual MDCOs change in diameter over the course of a study. Effect size was calculated using Glass’s delta to compare the treatment group to the control group. The studies used in (d) and (e) include MDCOs treated with normal feeding media (Control) or copanlisib (200 nmol/L) (Treated) for 48 h. Representative images from (c) are shown at the same magnification. Size bar, 1 mm.
Figure 2
Figure 2
A standard change point analysis demonstrates that the growth rates of the MDCOs vary as a function of their size. A change point analysis at 308 µm was determined using all control APPK MDCOs. When the change point analysis was applied to all studies, only MDCOs < 308 µm on day 0 were used in the analyses (Suppl. Figs. S2–S6). The green line indicates the calculated change point value. The red line indicates the geometric mean of the data points that are lower than the determined change point value. The blue line indicates the geometric mean of the data points that are greater than the determined change point value (n = 994).
Figure 3
Figure 3
MDCOs derived from different mice of the same genotype or from different regions of the colon and passage number do not vary significantly in growth or drug response. Box and whisker plots displaying control organoids from (a) different mice of the same genotype and (b) tumors isolated from different regions of the colon. Box and whisker plots displaying treated organoids (c) derived from different mice of the same genotype and (d) tumors isolated from different regions of the colon. Each number represents a different mouse (1: n = 25 and n = 9, 2a: n = 125 and n = 234, 2b: n = 21 and n = 43, 3: n = 61 and n = 49, 4: n = 76 and n = 85, 5: n = 30 and n = 31, 6: n = 269 and n = 539, 7: n = 38 and n = 46, 8: n = 356 and n = 755, growth and response, respectively). Note that the MDCO line derived from mouse 1 was isolated from a proximal colon tumor and mouse 2 had two MDCO lines derived from two different colon tumors (distal: n = 106 and n = 116, mid/distal: n = 394 and n = 801, mid: n = 330 and n = 588, prox: n = 25 and n = 9, growth and response, respectively). Closest to the small intestine is the proximal colon moving more distally to the mid colon and finally the distal colon. Note the proximal colon has a different gross histology than the mid or distal colon. Box and whisker plots displaying the percent change in diameter for (e) growth and (f) drug response of MDCOs from passages 1–15 (P1: n = 26 and n = 69, P2: n = 23 and n = 63, P3: n = 0, P4: n = 87 and n = 91, P5: n = 10 and n = 0, P6: n = 68 and n = 83, P7: n = 82 and n = 84, P8: n = 57 and n = 132, P9:, n = 101 and n = 268, P10: n = 44 and n = 56, P11: n = 98 and n = 156, P12: n = 90 and n = 115, P13: n = 96 and n = 223, P14: n = 104 and n = 201, P15: n = 82 and n = 150, growth and response, respectively). In all box and whisker plots the grey line indicates the population change in diameter mean while the grey shading indicates one standard deviation above and below the population mean. Effect size was calculated using Glass’s delta to compare each mouse or tumor to the appropriate population mean.
Figure 4
Figure 4
Location within the Matrigel matrix or density does not affect MDCO growth or drug response. (a) Representative images illustrating how location within the Matrigel matrix was done. Briefly, for each MDCO, the shortest distance (blue line) from the edge of the organoid to the edge of the Matrigel (dashed line) at the beginning of the study was measured using ImageJ. Scatter plots display individual organoids’ location within the Matrigel matrix vs their change in diameter in (b) growth and (c) drug response (n = 554 and n = 932, respectively). Linear trend lines are indicated in red. The R2 values displayed in the top right corner indicate that no significant correlation exists between the MDCOs change in diameter and location within the Matrigel matrix. Representative images from (a) are shown at the same magnification. Size bar, 500 µm. Scatter plots display if the density of MDCO cultures affect (d) growth or (e) drug response (n = 3580 and n = 4771, respectively). Density was determined by calculating the number of organoids per field of view (FOV) and was plotted against the average change in diameter per FOV. Linear trend lines are indicated in red. The R2 values displayed in the top right corner indicate the lack of significant correlation between change in diameter and the culture density. (f) Representative images illustrating starting density percentages used for the prospective analyses to validate observations seen in (d) and (e). Box and whisker plots displaying (g) control organoids and (h) treated organoids at different culture densities in the prospective study (n = 362 and n = 498). In all box and whisker plots the grey line indicates the population change in diameter mean while the grey shading indicates one standard deviation above and below the population mean. Representative images from (f) are shown at the same magnification. Size bar, 1 mm.
Figure 5
Figure 5
Multivariate analysis validates the finding that most baseline culture conditions do not affect growth or drug response. UMAP data-reduction examined four key variables (baseline diameter, distance to the edge of the Matrigel droplet, day 2 diameter, and percent change in diameter) to determine if baseline culture conditions caused clustering of individual MDCOs. UMAP visual representations showed that (a) MDCOs derived from different mice of the same genotype, (b) location of the original tumor within the colon, or (c) passage number did not cause clustering of MDCOs. Only (d) control and treated MDCOs showed any clear separation. (n = 1835 organoids).
Figure 6
Figure 6
Growth of patient derived cancer organoids is heterogeneous and not affected by baseline culture conditions. Representative image of the heterogeneous growth rates of PDCOs within a culture over 48 h (a). Scatter plots display individual organoids’ baseline diameter size (µm) (b), relative passage number (c), and PDCOs per field of view (d) vs their change in diameter (n = 1740, n = 1740, n = 878, respectively). Scatter plots of three CRC PDCO lines location within the Matrigel droplet vs their changes in diameter (LR3 n = 213, LR4 n = 82, and MC7 n = 136). Glass’s delta was calculated to determine the effect size of the change in diameter vs location in the Matrigel droplet for each PDCO line. (e) Representative images from (a) are shown at the same magnification. Size bar, 500 µm.

References

    1. American Cancer Society. Key statistics for colorectal cancer. https://www.cancer.org/cancer/colon-rectal-cancer/about/key-statistics.html. Accessed 19 August 2021.
    1. Fight Colorectal Cancer. https://fightcolorectalcancer.org/about-colorectal-cancer/general-inform.... Accessed 19 August 2021.
    1. Benson AB, et al. Colon cancer, Version 2.2021, NCCN clinical practice guidelines in oncology. J. Natl. Compr. Cancer Netw. 2021;19:329–359. - PubMed
    1. Tveit KM, Pihl A. Do cell lines in vitro reflect the properties of the tumours of origin? A study of lines derived from human melanoma xenografts. Br. J. Cancer. 1981;44:775–786. - PMC - PubMed
    1. Esquenet M, Swinnen JV, Heyns W, Verhoeven G. LNCaP prostatic adenocarcinoma cells derived from low and high passage numbers display divergent responses not only to androgens but also to retinoids. J. Steroid Biochem. Mol. Biol. 1997;62:391–399. - PubMed

Publication types