. 2022 Sep;29(9):1850-1863.
doi: 10.1038/s41418-022-00970-9. Epub 2022 Mar 25.

Long noncoding RNA NEAT1 promotes ferroptosis by modulating the miR-362-3p/MIOX axis as a ceRNA

Affiliations

Long noncoding RNA NEAT1 promotes ferroptosis by modulating the miR-362-3p/MIOX axis as a ceRNA

Ying Zhang et al. Cell Death Differ. 2022 Sep.

Abstract

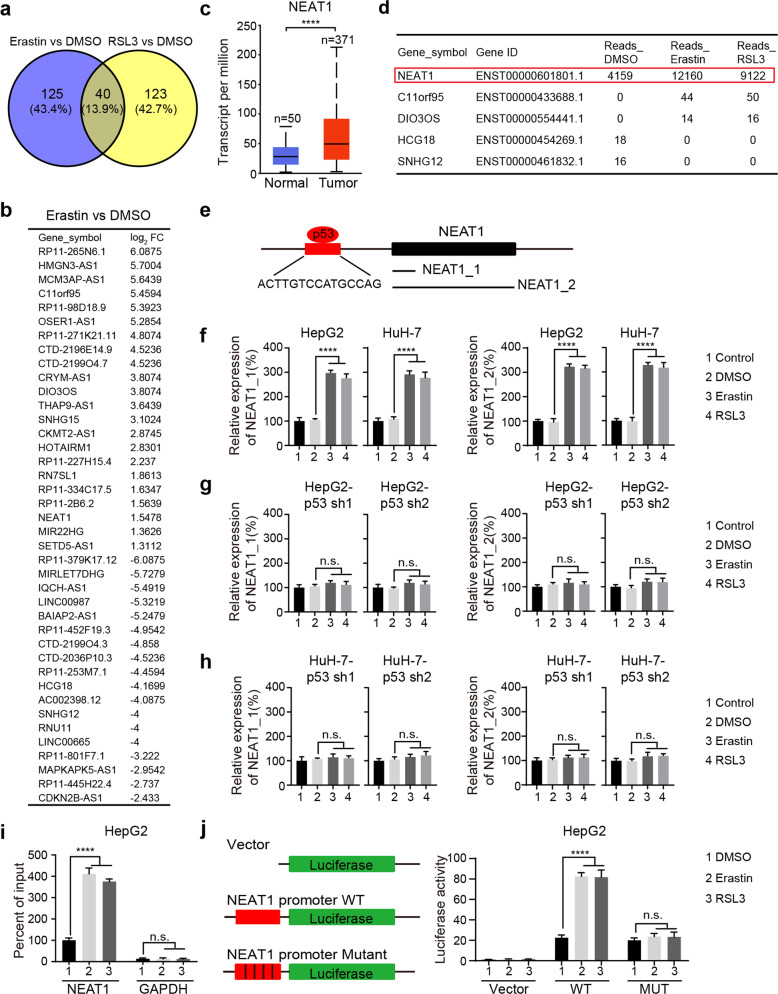
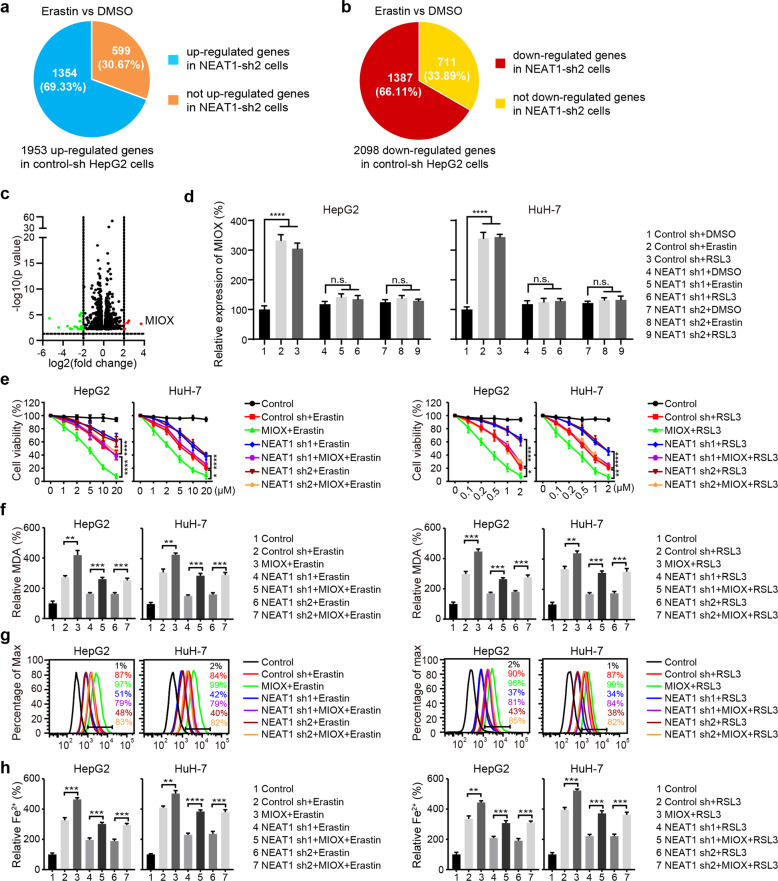
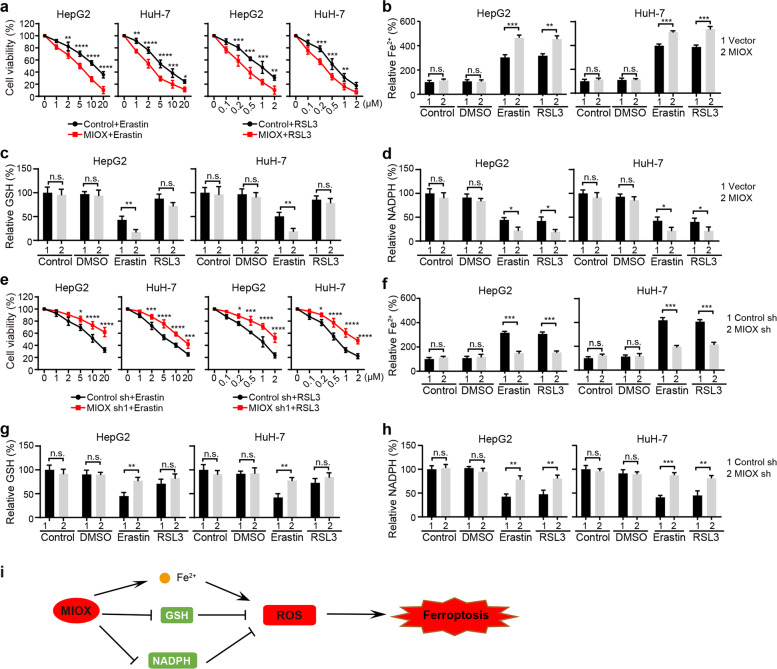
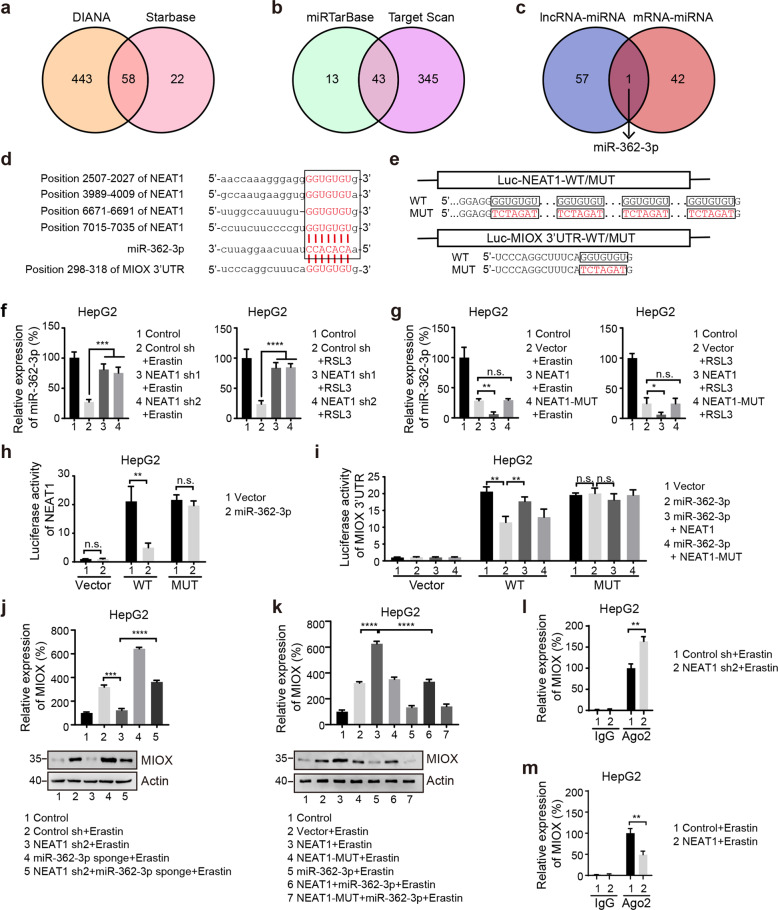
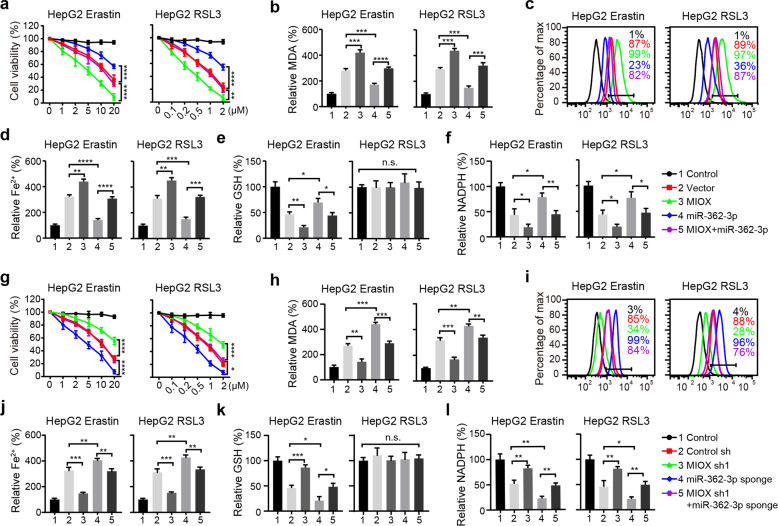
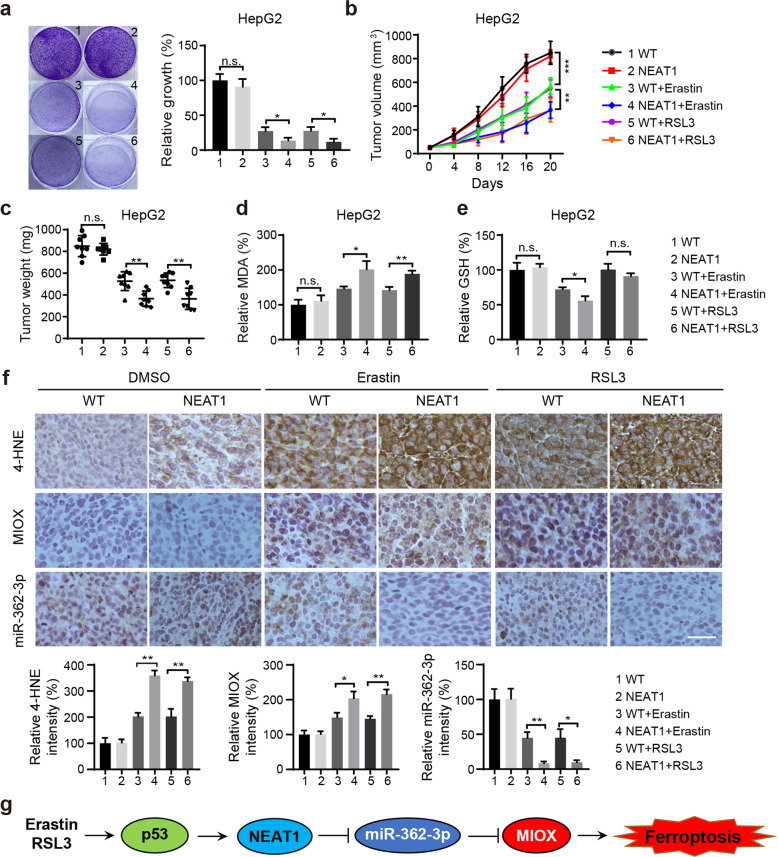
Ferroptosis, a novel form of regulated cell death induced by iron-dependent lipid peroxidation, plays an essential role in the development and drug resistance of tumors. Long noncoding RNA (lncRNA) nuclear paraspeckle assembly transcript 1 (NEAT1) has been reported to be involved in the regulation of cell cycle, proliferation, apoptosis, and migration of tumor cells. However, the function and molecular mechanism of NEAT1 in regulating ferroptosis in tumors remain unclear. Here, we found that ferroptosis inducers erastin and RSL3 increased NEAT1 expression by promoting the binding of p53 to the NEAT1 promoter. Induced NEAT1 promoted the expression of MIOX by competitively binding to miR-362-3p. MIOX increased ROS production and decreased the intracellular levels of NADPH and GSH, resulting in enhanced erastin- and RSL3-induced ferroptosis. Importantly, overexpression of NEAT1 increased the anti-tumor activity of erastin and RSL3 by enhancing ferroptosis both in vitro and in vivo. Collectively, these data suggest that NEAT1 plays a novel and indispensable role in ferroptosis by regulating miR-362-3p and MIOX. Considering the clinical findings that HCC patients are insensitive to chemotherapy and immunotherapy, ferroptosis induction may be a promising therapeutic strategy for HCC patients with high NEAT1 expression.


Conflict of interest statement

The authors declare no competing interests.

Figures

Fig. 1
Fig. 1. Induced expression of NEAT1 in ferroptosis depends on p53.
a Veen map shows the number of genes that were significantly differentially expressed in HepG2 cells treated with erastin or RSL3 versus HepG2 cells treated with DMSO (more than onefold and p < 0.05). b The log2 FC values of the 40 overlapping genes were compared between erastin group and DMSO group. c NEAT1 is significantly upregulated in HCC tumor tissues. The relative expression of NEAT1 in tumor tissue (n = 371) and corresponding normal tissue (n = 50) was analyzed using UALCAN, and the data were derived from the cancer genome atlas database. d The read counts of five lncRNAs in HepG2 cells treated with DMSO, erastin, or RSL3. e Schematic representation of the p53 binding site in the promoter region of NEAT1 and two isoforms of NEAT1. The p53 binding site (ACTTGTCCATGCCAG) is marked red, and the two isoforms (NEAT1_1 and NEAT1_2) are transcribed from the same locus. f Erastin and RSL3 induced the expression of NEAT1_1 and NEAT1_2 in HepG2 and HuH-7 cells. Cells were treated with erastin (5 µM) or RSL3 (0.5 µM) for 12 h; the mRNA levels of NEAT1_1 and NEAT1_2 were measured by qRT-PCR. Control group represents non-transfected cells. g, h Knockdown of p53 inhibited the upregulation of NEAT1_1 and NEAT1_2 induced by erastin and RSL3. HepG2 and HuH-7 cells stably expressing p53 shRNA constructs were treated with erastin (5 µM) or RSL3 (0.5 µM) for 12 h, and the mRNA levels of NEAT1_1 and NEAT1_2 were measured by qRT-PCR. Control group represents non-transfected cells. i ChIP-qPCR showed that erastin or RSL3 treatment increased the binding of p53 to the NEAT1 promoter. HepG2 cell was treated with erastin (5 µM) or RSL3 (0.5 µM) for 8 h, the DNA fragments purified after co-immunoprecipitation were amplified by qPCR, GAPDH was the negative control. j Luciferase reporter assay showed that erastin or RSL3 treatment increased the activity of NEAT1 promoter, but not the mutant form. The NEAT1 promoter-reporter constructs were transfected into HepG2 cells for 24 h, and the dual-luciferase activity was determined after erastin (5 µM) or RSL3 (0.5 µM) treatment for 12 h. Data shown represent mean ± SD from three independent experiments. ****p < 0.0001; n.s., not significant.
Fig. 2
Fig. 2. NEAT1 promotes erastin- and RSL3-induced ferroptosis.
a Schematic diagram of the positions of two NEAT1 shRNA sequences. b The relative expression levels of NEAT1_1 and NEAT1_2 in HepG2 and HuH-7 cells transfected with indicated constructs were detected by northern blot. See Supplementary figure 7 for uncropped data. Knockdown of NEAT1 suppressed erastin- and RSL3-induced ferroptosis. Cells transfected with indicated constructs were treated with erastin (1–20 µM) or RSL3 (0.1–2 µM) for 12 h, cell viability was determined with a CCK-8 kit (c), lipid formation was measured by MDA assay (d), lipid ROS accumulation was analyzed by flow cytometry with C11-BODIPY staining (e), and the intracellular Fe2+ was measured by iron detection assay (f). Control group represents non-transfected cells. Data shown represent mean ± SD from three independent experiments. ***p < 0.001; ****p < 0.0001; n.s., not significant.
Fig. 3
Fig. 3. NEAT1 promotes ferroptosis by regulating MIOX.
a Veen maps show that 1953 genes are upregulated in erastin treated HepG2 cells transfected with control shRNA. Note that 1354 genes are still upregulated in cells transfected with NEAT1 shRNA, while 599 genes are not upregulated. b Veen maps show that 2098 genes are downregulated in erastin treated HepG2 cells transfected with control shRNA. Note that 1387 genes are still downregulated in cells transfected with NEAT1 shRNA, while 711 genes are not downregulated. c The volcano plot reflects the differentially expressed genes regulated by NEAT1 in a and b. Red marks, log2 FC > 2 and p value < 0.05; green marks, log2 FC < −2 and p value < 0.05. d Erastin- and RSL3-induced expression of MIOX is dependent on NEAT1. HepG2 and HuH-7 cells transfected with indicated constructs were treated with erastin (5 µM) or RSL3 (0.5 µM) for 12 h, and the mRNA level of MIOX was measured by qRT-PCR. Overexpression of MIOX enhanced erastin- and RSL3-induced ferroptosis, which was inhibited by NEAT1 shRNA. HepG2 and HuH-7 cells transfected with indicated constructs were treated with erastin (1–20 µM) or RSL3 (0.1–2 µM) for 12 h, cell viability was determined with a CCK-8 kit (e), lipid formation was measured by MDA assay (f), lipid ROS accumulation was analyzed by flow cytometry with C11-BODIPY staining (g), and the intracellular Fe2+ was measured by iron detection assay (h). Control group represents non-transfected cells. Data shown represent mean ± SD from three independent experiments. *p < 0.05; **p < 0.01; ***p < 0.001; ****p < 0.0001; n.s., not significant.
Fig. 4
Fig. 4. MIOX promotes ferroptosis by regulating Fe2+, GSH, and NADPH.
Overexpression of MIOX increased erastin- and RSL3-induced cell death (a), Fe2+ accumulation (b). c, d Overexpression of MIOX suppressed the concentration of GSH in erastin treated cells and NADPH levels after erastin or RSL3 treatment. Knockdown of MIOX suppressed erastin or RSL3-induced cell death (e), intracellular level of Fe2+ (f). Knockdown of MIOX increased the concentration of GSH in erastin treated cells (g) and NADPH levels after erastin or RSL3 treatment (h). Control group represents non-transfected cells. Data shown represent mean ± SD from three independent experiments. *p < 0.05; **p < 0.01; ***p < 0.001; ****p < 0.0001; n.s., not significant. i Schematic of the mechanism by which MIOX-regulates ferroptosis.
Fig. 5
Fig. 5. MiR-362-3p interacts with NEAT1 and MIOX.
a A total of 58 overlapping miRNAs interacting with NEAT1 were predicted by DIANA and Starbase databases. b A total of 43 overlapping miRNAs interacting with MIOX were predicted by miRTarBase and Target Scan databases. c MiR-362-3p is the only overlapping miRNA in figure a and b. d Sequence alignment of NEAT1, MIOX, and miR-362-3p. NEAT1 contains four binding sequences (GGUGUGU) of miR-362-3p. e Schematic representation of wild type and mutant sequences of NEAT1 and MIOX 3’UTR. Knockdown of NEAT1 promoted miR-362-3p expression in ferroptosis (f), whereas overexpression of NEAT1, but not the mutant form, suppressed miR-362-3p (g). HepG2 cells transfected with indicated constructs were treated with erastin (5 µM) or RSL3 (0.5 µM) for 12 h, and the mRNA level of miR-362-3p was measured by qRT-PCR. Control group represents non-transfected cells. h MiR-362-3p inhibits the expression of a NEAT1-luciferase reporter in HepG2 cells, but not the mutant reporter. i Overexpression of wild-type NEAT1, but not the mutant form, increased the expression of a MIOX 3’UTR-luciferase reporter which was suppressed by miR-362-3p. Knockdown of miR-362-3p increased the expression of MIOX inhibited by NEAT1 shRNA (j), whereas overexpression of miR-362-3p decreased the expression of MIOX promoted by NEAT1 (k). HepG2 cells transfected with indicated constructs were treated with erastin (5 µM) for 12 h. The expression of MIOX was detected by qRT-PCR and western blot. See Supplementary figure 8 for uncropped western blot image. Control group represents non-transfected cells. l, m The interaction between MIOX and miR-362-3p was affected by the expression level of NEAT1, which was verified by RIP assay using anti-Ago2 antibody, followed by qPCR to detected the MIOX level. Data shown represent mean ± SD from three independent experiments. *p < 0.05; **p < 0.01; ***p < 0.001; ****p < 0.0001; n.s., not significant.
Fig. 6
Fig. 6. MiR-362-3p inhibits ferroptosis by regulating MIOX.
Overexpression of MIOX promotes erastin- and RSL3-induced ferroptosis, which was inhibited by miR-362-3p. HepG2 cells transfected with indicated constructs were treated with erastin (1–20 µM) or RSL3 (0.1–2 µM) for 12 h, cell viability was determined with a CCK-8 kit (a), lipid formation was measured by MDA assay (b), lipid ROS accumulation was analyzed by flow cytometry with C11-BODIPY staining (c), the intracellular Fe2+ was measured by iron detection assay (d), GSH concentration in the cells was measured using a glutathione assay kit (e), and NADPH level was determined using an NADPH assay kit (f). Knockdown of MIOX inhibits erastin- and RSL3-induced ferroptosis, which was enhanced by miR-362-3p sponge. HepG2 cells transfected with indicated constructs were treated with erastin (1–20 µM) or RSL3 (0.1–2 µM) for 12 h, cell viability was determined with a CCK-8 kit (g), lipid formation was measured by MDA assay (h), lipid ROS accumulation was analyzed by flow cytometry with C11-BODIPY staining (i), the intracellular Fe2+ was measured by iron detection assay (j), GSH concentration in the cells was measured using a glutathione assay kit (k) and NADPH level was determined using an NADPH assay kit (l). Control group represents non-transfected cells. Data shown represent mean ± SD from three independent experiments. *p < 0.05; **p < 0.01; ***p < 0.001; ****p < 0.0001; n.s., not significant.
Fig. 7
Fig. 7. Overexpression of NEAT1 inhibits erastin or RSL3 resistance in vitro and in vivo.
a Overexpression of NEAT1 promoted erastin- and RSL3-induced ferroptosis detected by the colony formation assay. HepG2 cells were treated with DMSO, erastin (5 µM), or RSL3 (0.5 µM) for 12 h and cultured for 10 days without erastin or RSL3, and the number of cell colonies was calculated. Overexpression of NEAT1 enhanced erastin- and RSL3-induced ferroptosis in vivo. Corresponding HepG2 cells were cultured and injected subcutaneously into 7-week-old immunodeficient mice (8 mice per group) at 5 × 106 cells per mouse, and erastin (15 mg/kg, twice every other day) or RSL3 (10 mg/kg, twice every other day) were injected intraperitoneally when the tumor volume of the mice reached 50 mm3. Tumor volume b was measured every 4 days, tumor weight c was measured on day 20. The relative levels of MDA d and GSH e were measured. f The expression level of 4NHE, MIOX and miR-362-3p of tumor xenografts was detected by immunohistochemical analysis and in situ hybridization staining. of miR-362-3p. Quantitative analysis of intensity was also shown. Scale bar, 50 µm. The experiment was repeated twice independently with similar results. Data shown represent mean ± SD from three independent experiments. *p < 0.05; **p < 0.01; ***p < 0.001; n.s., not significant. g Schematic diagram of NEAT1/miR-362-3p/MIOX axis regulating ferroptosis in HCC cells. NEAT1 positively regulates MIOX expression through the sponge to miR-362-3p, which promotes ferroptotic cell death.

References

    1. Stockwell BR, Angeli J, Bayir H. Ferroptosis: A regulated cell death nexus linking metabolism, redox biology, and disease. Cell. 2017;171:273–85. doi: 10.1016/j.cell.2017.09.021. - DOI - PMC - PubMed
    1. Sousa L, Oliveira MM, Pessa MTC, Barbosa LA. Iron overload: effects on cellular biochemistry. Clin Chim Acta. 2019;504:180–9. doi: 10.1016/j.cca.2019.11.029. - DOI - PubMed
    1. Yang WS, SriRamaratnam R, Welsch ME, Shimada K, Skouta R, Viswanathan VS, et al. Regulation of ferroptotic cancer cell death by GPX4. Cell. 2014;156:317–31. doi: 10.1016/j.cell.2013.12.010. - DOI - PMC - PubMed
    1. Xie Y, Hou W, Song X, Yu Y, Huang J, Sun X, et al. Ferroptosis: process and function. Cell Death Differ. 2016;23:369–79. doi: 10.1038/cdd.2015.158. - DOI - PMC - PubMed
    1. Mercer TR, Dinger ME, Mattick JS. Long non-coding RNAs: insights into functions. Nat Rev Genet. 2009;10:155–9. doi: 10.1038/nrg2521. - DOI - PubMed

Publication types