. 2022 Jun 9;139(23):3418-3429.
doi: 10.1182/blood.2021014103.

Functional mapping of PHF6 complexes in chromatin remodeling, replication dynamics, and DNA repair

Affiliations

Functional mapping of PHF6 complexes in chromatin remodeling, replication dynamics, and DNA repair

Silvia Alvarez et al. Blood. .

Abstract

The Plant Homeodomain 6 gene (PHF6) encodes a nucleolar and chromatin-associated leukemia tumor suppressor with proposed roles in transcription regulation. However, specific molecular mechanisms controlled by PHF6 remain rudimentarily understood. Here we show that PHF6 engages multiple nucleosome remodeling protein complexes, including nucleosome remodeling and deacetylase, SWI/SNF and ISWI factors, the replication machinery and DNA repair proteins. Moreover, after DNA damage, PHF6 localizes to sites of DNA injury, and its loss impairs the resolution of DNA breaks, with consequent accumulation of single- and double-strand DNA lesions. Native chromatin immunoprecipitation sequencing analyses show that PHF6 specifically associates with difficult-to-replicate heterochromatin at satellite DNA regions enriched in histone H3 lysine 9 trimethyl marks, and single-molecule locus-specific analyses identify PHF6 as an important regulator of genomic stability at fragile sites. These results extend our understanding of the molecular mechanisms controlling hematopoietic stem cell homeostasis and leukemia transformation by placing PHF6 at the crossroads of chromatin remodeling, replicative fork dynamics, and DNA repair.


Figures

None
Graphical abstract
Figure 1.
Figure 1.
PHF6 associates with protein complexes involved in chromatin regulation and DNA repair. (A) Purified proteins after tandem affinity purification visualized by silver staining. Molecular weight marker is indicated on the left. (B) ConsensusPathDB over-representation analysis of protein complexes. (C) ConsensusPathDB over-representation analysis showing enrichment in chromatin remodeling pathways. (D) ConsensusPathDB over-representation analysis showing enrichment in DNA repair pathways. (E) ConsensusPathDB over-representation analysis showing enrichment in rRNA expression regulation pathways. ALL-1, leukemia acute lymphocytic susceptibility to 1; BAF, BRG1/BRM-associated factor; BRD7, bromodomain-containing protein 7; BRG1, brahma-related gene 1; CHD4, chromodomain helicase DNA binding protein 4; COMPASS, complex proteins associated with Set1; CoREST, RE1-silencing transcription factor corepressor; GG-NER, global-genome nucleotide excision repair; HCF1N, host cell factor 1; HDAC1/2, histone deacetylase 1/2; hSWI/SNF, human SWItch/sucrose nonfermentable; HuCHRAC, human chromatin accessibility complex; KIF1, kinesin family member 1a; LARC, LCR-associated remodeling complex; MBD3, methyl-CpG binding domain protein 3; MLL3/4, mixed-lineage leukemia-like protein 3/4; NuRD, nucleosome remodeling and deacetylase; PBAF, polybromo Brg1-associated factor; PRC2, polycomb repressive complex 2; RBBP4/7, retinoblastoma-binding protein 4/7; RMT, histone arginine methylase; RNA Pol I, RNA polymerase I; SETD1, SET domain containing 1A; SIN3, Swi-independent 3; SNF2h, sucrose nonfermenting 2 homolog; SNF5, switching defective/sucrose nonfermenting subunit 5.
Figure 2.
Figure 2.
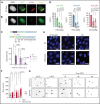
PHF6 is recruited to the vicinity of DNA breaks for efficient DNA repair. (A) Representative confocal images showing PHF6 colocalization with γ-H2AX after UV micro-irradiation in U2OS cells. (B) Representative confocal images showing PHF6 colocalizing with γ-H2AX in a single double-strand break (DSB) induced by I-SceI expression in U2OS-DR GFP cells. (C) Upper panel, schematics of DSB induction after doxycycline and PHF6 recruitment to the vicinity of a DSB (region A) and to 2 different regions away from the DSB (regions B and C). Lower panel, quantification of ChIP assay showing PHF6 recruitment to the vicinity of the I-SceI DSB site in U2OS-DR-GFP cells in 3 different genomic regions (regions A-C) in 2 independent experiments. Bar graphs represent mean ± standard error of the mean. EV (empty-vector, not I-SceI-induced DSB control). (D) GFP percentage measured by flow cytometry in U2OS cells expressing 2 different short hairpin RNAs (shRNAs) targeting PHF6 or control shRNA containing integrated reporters to measure DNA repair efficiency through homologous recombination (U2OS-DR-GFP), single-strand annealing (SA-GFP), or non-homologous end-joining (EJ5-GFP). The percentage of GFP-positive cells is plotted as percent relative to the control cells. Data are representative of 4 independent experiments. Bar graphs represent mean ± standard error of the mean. (E) Representative images of Rad51 foci (red) obtained after 1- or 6-hour recovery from neocarzinostatin (NCS) treatment in control (EV, control sgRNA) and PHF6-knockout cells. DNA was stained with 4′,6-diamidino-2-phenylindole (DAPI) (blue). Scale bar, 25 μM. (F) Quantification of the intensity of Rad51 foci per cell in control (EV, control sgRNA) and PHF6-knockout U2OS cells. Between 100 and 200 cells were analyzed per condition. Statistical analysis was conducted by using a nonparametric Mann-Whitney test. Data are representative of 2 independent experiments. (G) Representative alkaline comet images performed in untreated U2OS cells or after NCS treatment (100 ng/mL) and recovery for 1, 4, or 6 hours in cells infected with a control shRNA (shControl) or a PHF6-targeting shRNA (shPHF6). (H) Dot plot showing individual percentages of comet tail DNA. The median value of >70 nuclei per experimental condition is indicated. Statistical analysis was conducted by using the Mann-Whitney test. Data are representative of 2 independent experiments. (I) Western blot showing the presence of phosphorylated γ-H2AX after recovery from irradiation (1 Gy) for the indicated times in PHF6 control or knock-out primary T-ALL cells. Gapdh is shown as loading control. Tmx, tamoxifen. (J) Analysis of apoptosis upon irradiation at 8 Gy in U2OS infected with control single guide RNA (sgRNA) or sgRNA#1/sgRNA#2. Bar graphs represent mean ± standard deviation (SD). (K) Quantification of ChIP assay showing CHD4 recruitment to the vicinity of the I-SceI DSB site in U2OS-DR-GFP cells (region A) in the presence (PHF6 shRNA '-') or absence of PHF6 (PHF6 shRNA '#7'). Data are representative of 3 independent experiments. EV (empty-vector, not I-SceI-induced DSB control). Bar graphs represent mean ± SD. (L) Quantification of ChIP assay showing SMARCB1 recruitment to the vicinity of the I-SceI DSB site in U2OS-DR-GFP cells (region A) in the presence (PHF6 shRNA '-') or absence of PHF6 (PHF6 shRNA '#7'). Data are representative of 3 independent experiments. EV (empty-vector, not I-SceI-induced DSB control). Bar graphs represent mean ± SD. (M) Left, western blot confirming endogenous PHF6 interaction by immunoprecipitation with SNF2H before and after treatment with 100 ng/mL NCS. Right: quantification of Phf6 levels normalized to Phf6 input ± NCS. All P values in the graphics were assessed by using a 2-tailed, unpaired Student’s t test. IgG, immunoglobulin G; n.s., not significant.
Figure 2.
Figure 2.
PHF6 is recruited to the vicinity of DNA breaks for efficient DNA repair. (A) Representative confocal images showing PHF6 colocalization with γ-H2AX after UV micro-irradiation in U2OS cells. (B) Representative confocal images showing PHF6 colocalizing with γ-H2AX in a single double-strand break (DSB) induced by I-SceI expression in U2OS-DR GFP cells. (C) Upper panel, schematics of DSB induction after doxycycline and PHF6 recruitment to the vicinity of a DSB (region A) and to 2 different regions away from the DSB (regions B and C). Lower panel, quantification of ChIP assay showing PHF6 recruitment to the vicinity of the I-SceI DSB site in U2OS-DR-GFP cells in 3 different genomic regions (regions A-C) in 2 independent experiments. Bar graphs represent mean ± standard error of the mean. EV (empty-vector, not I-SceI-induced DSB control). (D) GFP percentage measured by flow cytometry in U2OS cells expressing 2 different short hairpin RNAs (shRNAs) targeting PHF6 or control shRNA containing integrated reporters to measure DNA repair efficiency through homologous recombination (U2OS-DR-GFP), single-strand annealing (SA-GFP), or non-homologous end-joining (EJ5-GFP). The percentage of GFP-positive cells is plotted as percent relative to the control cells. Data are representative of 4 independent experiments. Bar graphs represent mean ± standard error of the mean. (E) Representative images of Rad51 foci (red) obtained after 1- or 6-hour recovery from neocarzinostatin (NCS) treatment in control (EV, control sgRNA) and PHF6-knockout cells. DNA was stained with 4′,6-diamidino-2-phenylindole (DAPI) (blue). Scale bar, 25 μM. (F) Quantification of the intensity of Rad51 foci per cell in control (EV, control sgRNA) and PHF6-knockout U2OS cells. Between 100 and 200 cells were analyzed per condition. Statistical analysis was conducted by using a nonparametric Mann-Whitney test. Data are representative of 2 independent experiments. (G) Representative alkaline comet images performed in untreated U2OS cells or after NCS treatment (100 ng/mL) and recovery for 1, 4, or 6 hours in cells infected with a control shRNA (shControl) or a PHF6-targeting shRNA (shPHF6). (H) Dot plot showing individual percentages of comet tail DNA. The median value of >70 nuclei per experimental condition is indicated. Statistical analysis was conducted by using the Mann-Whitney test. Data are representative of 2 independent experiments. (I) Western blot showing the presence of phosphorylated γ-H2AX after recovery from irradiation (1 Gy) for the indicated times in PHF6 control or knock-out primary T-ALL cells. Gapdh is shown as loading control. Tmx, tamoxifen. (J) Analysis of apoptosis upon irradiation at 8 Gy in U2OS infected with control single guide RNA (sgRNA) or sgRNA#1/sgRNA#2. Bar graphs represent mean ± standard deviation (SD). (K) Quantification of ChIP assay showing CHD4 recruitment to the vicinity of the I-SceI DSB site in U2OS-DR-GFP cells (region A) in the presence (PHF6 shRNA '-') or absence of PHF6 (PHF6 shRNA '#7'). Data are representative of 3 independent experiments. EV (empty-vector, not I-SceI-induced DSB control). Bar graphs represent mean ± SD. (L) Quantification of ChIP assay showing SMARCB1 recruitment to the vicinity of the I-SceI DSB site in U2OS-DR-GFP cells (region A) in the presence (PHF6 shRNA '-') or absence of PHF6 (PHF6 shRNA '#7'). Data are representative of 3 independent experiments. EV (empty-vector, not I-SceI-induced DSB control). Bar graphs represent mean ± SD. (M) Left, western blot confirming endogenous PHF6 interaction by immunoprecipitation with SNF2H before and after treatment with 100 ng/mL NCS. Right: quantification of Phf6 levels normalized to Phf6 input ± NCS. All P values in the graphics were assessed by using a 2-tailed, unpaired Student’s t test. IgG, immunoglobulin G; n.s., not significant.
Figure 3.
Figure 3.
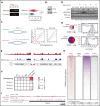
PHF6 protects from replication-associated DNA damage and binds to satellite DNA heterochromatin. (A) Schematic of chlorodeoxyuridine (CldU, red)/iododeoxyuridine (IdU, green) pulse labeling (upper left). Representative images of CldU and IdU replication tracks in Jurkat control (EV, control sgRNA) or PHF6 knockout (KO) cells (bottom left). Fork rate dot plot showing the IdU tract length of individual replication forks in untreated Jurkat cells (right). The median value of >350 tracts per experimental condition is indicated. Statistical analysis was conducted by using the Mann-Whitney test (P < .0001). Data are representative of 2 independent experiments. (B) Western blot showing PHF6 KO in Jurkat cells infected with a control sgRNA (EV) or a single guide RNA targeting the second PHD2 domain of PHF6 (KO). β-actin concentrations are shown as a loading control. (C) Left, scheme of the signals used for quantification of asymmetry analysis of forks moving from a single origin (outgoing forks). Right, scatter diagram of fork symmetry in Jurkat cells. Each dot corresponds to the ratio between the right and the left fork velocities of a pair of outgoing forks belonging to the same replication bubble. The areas outside of the dotted lines include all points whose ratios deviate from the expected theoretical value of 1 ± 0.3, corresponding to forks moving bidirectionally at nearly the same rate. EV control (control sgRNA), PHF6 KO (sgRNA targeting second PHD2 domain of PHF6). Statistical analysis was performed with the Mann-Whitney rank sum test (P < .001). (D) Western blot showing the presence of phosphorylated RPA (pRPA) after recovery from 30 minutes of 1 μM camptothecin treatment. The “–” sign indicates untreated conditions. Both RPA total amount and β-actin concentrations are shown as a loading control as used for the blot quantification shown below each band. EV control (control sgRNA), PHF6 KO (sgRNA targeting second PHD2 domain of PHF6). (E) Chromosome 19 distribution of normalized PHF6 (red track) or H3K9me3 (blue track) ChIP-Seq intensities in Jurkat. (F) Heat map indicating the log2FC enrichment in repetitive regions according to category compared with the average in 3 random subsets. (G) Overlap between PHF6 peaks and γ-H2AX genomic regions in untreated (upper panel) and after aphidicolin treatment (lower panel). The indicated P value and Z scores are the result of permutation testing (n = 1000 trials). PHF6 control obs, refers to observed regions. PHF6 control perm, refers to median expected permutated regions. (H) Normalized ChIP-Seq heat maps of Jurkat PHF6 control and KO and K562 γ-H2AX aphidicolin treated and untreated. PHF6-bound regions (n = 11 528) were scaled to the same length. (I) Differential PHF6 (control/KO cell lines) and γ-H2AX (treated/untreated) ChIP-Seq intensities within the fragile site FRA3H.
Figure 4.
Figure 4.
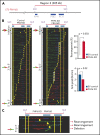
PHF6 prevents replication-associated damage and accumulation of genomic rearrangements at the FRA16D chromosome fragile site. (A) Locus map of CFS-FRA16D SbfI digested segment. The fluorescence in situ hybridization probes that identify the segment are labeled in blue. (B) Aligned photomicrograph images of labeled DNA molecules from Jurkat PHF6 infected with an empty vector control (EV, control sgRNA) or with an sgRNA targeting the second PHD2 domain of PHF6 (PHF6 PHF6 KO). The yellow arrows indicate the sites along the molecules where the iododeoxyuridine transitioned to chlorodeoxyuridine. White rectangles indicate representative sites of replication fork pausing. The molecules are arranged in the following order: molecules with initiation events, molecules with 3′ to 5′ progressing forks, molecules with 5′ to 3′ progressing forks, and molecules with termination events. The quantification in the upper right panel shows the percentage of molecules with rearrangements at CFS-FRA16D in Jurkat PHF6 EV (blue bar) and Jurkat KO (red bar). Error bars represent mean ± standard deviation from data collected from 2 independent experiments. The quantification in the lower right panel shows the replication fork speed at CFS-FRA16D in Jurkat PHF6 EV (blue bar) and Jurkat KO (red bar). Error bars represent mean ± standard deviation from data collected from 2 independent experiments. (C) Close-up of the 5′ to 3′ region of CFS-FRA16D showing aberrant probe patterns in individual DNA molecules.

Comment in

References

    1. Jahani-Asl A, Cheng C, Zhang C, Bonni A. Pathogenesis of Börjeson-Forssman-Lehmann syndrome: insights from PHF6 function. Neurobiol Dis. 2016;96: 227-235. - PMC - PubMed
    1. Todd MA, Ivanochko D, Picketts DJ. PHF6 degrees of separation: the multifaceted roles of a chromatin adaptor protein. Genes (Basel). 2015;6(2):325-352. - PMC - PubMed
    1. Van Vlierberghe P, Palomero T, Khiabanian H, et al. . PHF6 mutations in T-cell acute lymphoblastic leukemia. Nat Genet. 2010;42(4):338-342. - PMC - PubMed
    1. Van Vlierberghe P, Patel J, Abdel-Wahab O, et al. . PHF6 mutations in adult acute myeloid leukemia. Leukemia. 2011;25(1):130-134. - PMC - PubMed
    1. Alexander TB, Gu Z, Iacobucci I, et al. . The genetic basis and cell of origin of mixed phenotype acute leukaemia. Nature. 2018;562(7727):373-379. - PMC - PubMed