. 2022 May;52(5):784-799.
doi: 10.1002/eji.202149549. Epub 2022 Apr 9.

Platelets accumulate in lung lesions of tuberculosis patients and inhibit T-cell responses and Mycobacterium tuberculosis replication in macrophages

Affiliations

Platelets accumulate in lung lesions of tuberculosis patients and inhibit T-cell responses and Mycobacterium tuberculosis replication in macrophages

Marco P La Manna et al. Eur J Immunol. 2022 May.

Abstract

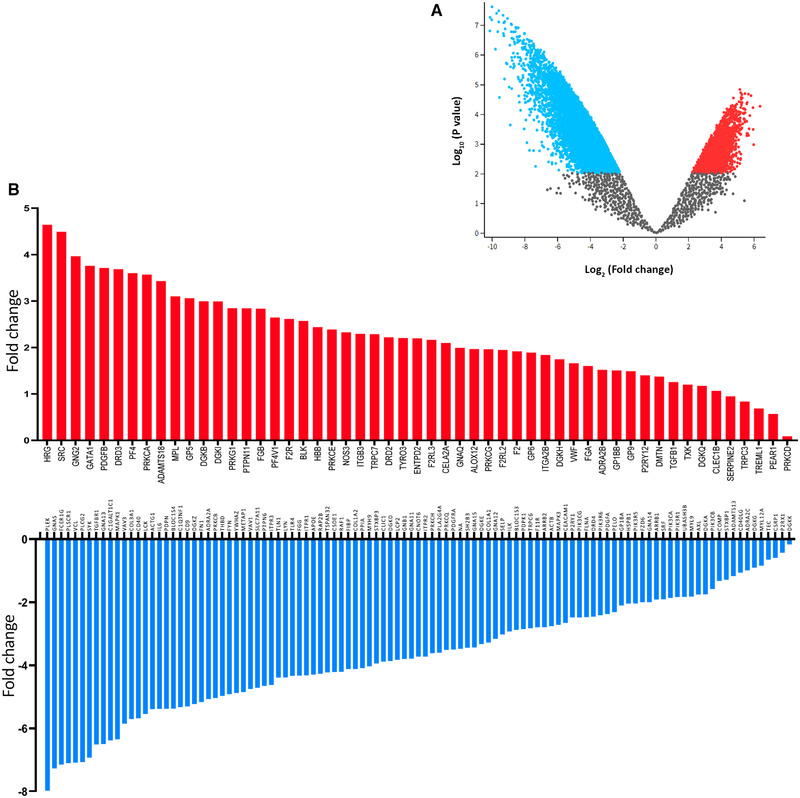
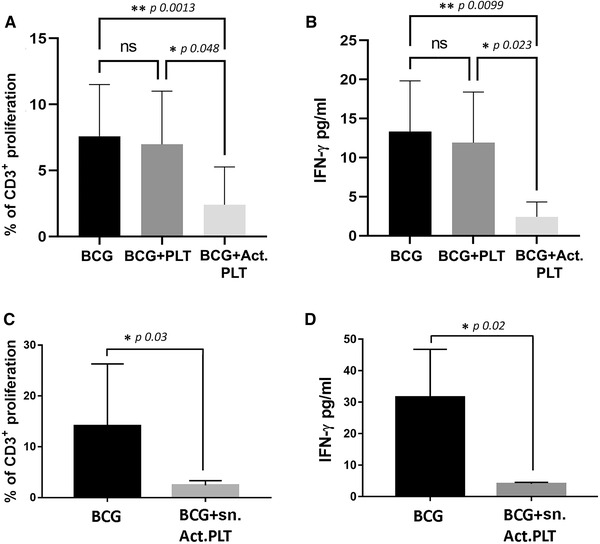
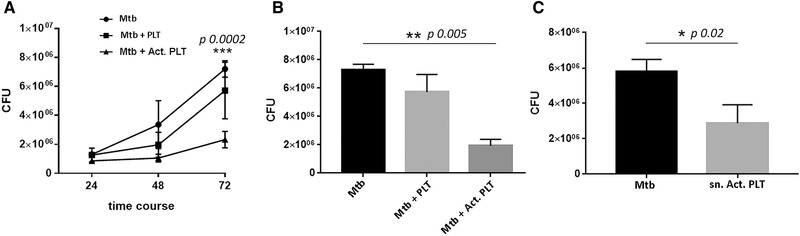
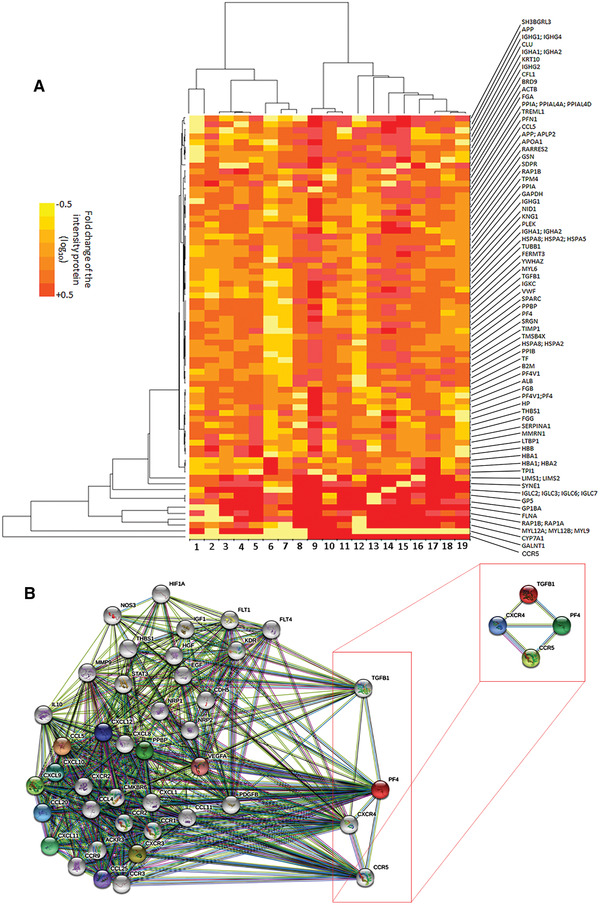
Platelets regulate human inflammatory responses that lead to disease. However, the role of platelets in tuberculosis (TB) pathogenesis is still unclear. Here, we show that patients with active TB have a high number of platelets in peripheral blood and a low number of lymphocytes leading to a high platelets to lymphocytes ratio (PL ratio). Moreover, the serum concentration of different mediators promoting platelet differentiation or associated with platelet activation is increased in active TB. Immunohistochemistry analysis shows that platelets localise around the lung granuloma lesions in close contact with T lymphocytes and macrophages. Transcriptomic analysis of caseous tissue of human pulmonary TB granulomas, followed by Gene Ontology analysis, shows that 53 platelet activation-associated genes are highly expressed compared to the normal lung tissue. In vitro activated platelets (or their supernatants) inhibit BCG-induced T- lymphocyte proliferation and IFN-γ production. Likewise, platelets inhibit the growth of intracellular macrophages of Mycobacterium (M.) tuberculosis. Soluble factors released by activated platelets mediate both immunological and M. tuberculosis replication activities. Furthermore, proteomic and neutralisation studies (by mAbs) identify TGF-β and PF4 as the factors responsible for inhibiting T-cell response and enhancing the mycobactericidal activity of macrophages, respectively. Altogether these results highlight the importance of platelets in TB pathogenesis.

Keywords: Cytokines; Lymphocytes; Macrophages; Mycobacterium tuberculosis; Platelets.


Conflict of interest statement

The authors declare that the research was conducted in the absence of any commercial or financial relationships that could be construed as a potential conflict of interest.

Figures

Figure 1
Figure 1
PL ratio, platelet, and lymphocyte absolute count of the different cohort groups. Absolute platelet and lymphocyte numbers were evaluated in whole blood by a hematology analyzer for diagnostic use. PL ratio (A), platelet absolute count (B), and lymphocyte absolute count (C) of HD, LTBI subjects, patients with active TB disease and cured TB patients. Correlation between the PL ratio and absolute platelet (D) and lymphocyte count (E). Each dot represents one individual subject out of 30 HD, 52 LTBI, 66 active TB, and 36 cured TB patients. Each horizontal bar represents the median of each group. Correlation between the PL ratio and absolute lymphocyte count was analyzed by Spearman rank correlation test. Significance of differences between groups was compared using Kruskal–Wallis test, **p < 0.01, ***p < 0.001, ****p < 0.0001.
Figure 2
Figure 2
Phenotype of platelets and overlays between HD and active TB of CD61 and CD42a marker expression and cytokine levels in sera of HD and active TB. Box and whiskers plot (A) and the representative overlay (B) of comparison of CD61 MFI between HD and active TB platelets. Box and whiskers plot (C) and the representative overlay (D) of comparison of CD42a MFI between HD and active TB platelets. The box and whiskers plots represent the pooled data (median, interquartile ranges, and 10‐90 percentiles) from nine experiments with a total of nine subjects for the two groups. The significant differences between groups were analyzed using Mann–Whitney test, **p < 0.01, ***p < 0.001. Box and whiskers plot of comparison of IL‐1β (E), MIP‐1α (F), VEGF (G), IL‐6 (H), and GM‐CSF (I) between HD and active TB. The box and whiskers plots represent the pooled data (median, interquartile ranges, and 10‐90 percentiles) from one experiment with 25 active TB and 40 HD subjects for the two groups. The significant differences between groups were analyzed using Mann–Whitney test, **p < 0.01, ****p < 0.0001.
Figure 3
Figure 3
IHC of LN and lung tissue autopsy samples of one patient with lymph‐nodal TB and one patient with pulmonary TB. Representative IHC immunostainings on LN and lung parenchyma of two TB patients, performed in two different experiments, highlighting the presence of CD61+ (brown signal) platelet clusters intermingling with CD3+ (purple signal) T‐cell infiltrates within peripheral areas of granulomatous foci. Scale bars, 100 μm. Platelets clusters surrounding the area of granulomatous lesion in lymph nodal TB (A, B) and pulmonary TB (C, D); platelets were localized close to macrophages in LNs (E, F) in lymph nodal TB and in lungs (G,H) in pulmonary TB. Platelet at the periphery of the granulomatous lesions, intermingling with lymphocytes in both LN (I, J) and pulmonary tissues (K, L) of TB‐infected individuals. No platelet infiltration was observed in control LNs of patients with nonspecific reactive follicular hyperplasia (M,N,O,P).
Figure 4
Figure 4
Gene expression analysis of caseous human pulmonary TB granulomas from TB patients. (A) Volcano plot of gene expression profiles of five caseous TB lung tissues and two normal lung tissues from one experiment, where blue represents significantly downregulated and red represents upregulated genes. (B) Expression profiles of platelet activation‐associated genes, where the positive values indicate that genes are highly expressed in caseous respect to normal lung tissue and negative values indicate that genes are highly expressed in normal respect to caseous lung tissue.
Figure 5
Figure 5
Thrombin‐activated platelets and supernatant of activated platelet downregulates IFN‐γ production from PBMC of active TB. (A) CD3+ T cells proliferation from PBMC stimulated with BCG or with BCG plus platelets or thrombin‐activated platelets or BCG. (B) IFN‐γ production from PBMC stimulated overnight with BCG or with BCG plus platelets or thrombin‐activated platelets. The graphs A and B represent the pooled data (median and IQR) from seven active TB. (C) CD3+ T cells proliferation from PBMC stimulated with BCG in RPMI medium or with BCG in RPMI medium conditioned with supernatant of thrombin‐activated platelets. (D) IFN‐γ production from PBMC stimulated overnight with BCG in RPMI medium or with BCG in RPMI medium conditioned with supernatant of thrombin‐activated platelets. The graphs C and D represent pooled data (median and IQR) from three active TB patients. The significant differences between groups were analyzed using Friedman's test and Mann– Whitney test (one tail), *p ≤ 0.05, **p ≤ 0.01.
Figure 6
Figure 6
Thrombin‐activated platelets enhance the clearance of intracellular M. tuberculosis in THP1‐derived macrophages. (A) Time course of bacterial burden measurement at 24, 48, and 72 h in THP1‐derived macrophages cultured in RPMI medium without antibiotics and with platelets or activated platelets from one experiment with platelets of four active TB. The significant differences between groups were analyzed using Kruskal‐Wallis test ***p < 0.001. (B) Bacterial burden counted at 72 h in THP1‐derived macrophages cultured in RPMI medium without antibiotics and with platelets or activated platelets of one experiment with six active TB; the significant differences between groups were analyzed using Kruskal–Wallis test **< 0.01. (C) Bacterial burden counted at 72 h in THP1‐derived macrophages cultured in RPMI medium without antibiotics added with 20% of supernatant of activated platelets of one experiment with six active TB. The significant differences between groups were analyzed using Mann–Whitney test, *p < 0.05. Data in (A), (B), and (C) are shown as mean + SEM.
Figure 7
Figure 7
Direct (physical) and indirect (functional) associations of molecules released by platelets from primary databases elaborated by computational prediction. (A) PF4 network proteins/interacting partners. The protein network was built using String 11.0., inputting PF4 and setting to visualize only the “evidence” interactions with a maximum 10 interactors for the first shell and 20 for the second shell, we found 41 nodes based of the following setting: “meaning of network edges: confidence”; “active interaction source: experiments (pink line), databases (light blue line), coexpression (black line), text mining (green line)”; “protein homology (violet line).” Among the cluster generated, the direct interaction between platelets and macrophages was the most statistically significant (< 0.001) (Figure 7B, right panel). (B) Heat maps of the most abundant proteins in platelets released (intensity value in log10); yellow indicates the lowest intensity, while red indicates the highest intensity (72 proteins analyzed).
Figure 8
Figure 8
Thrombin‐activated platelets and supernatant of activated platelet proliferation and IFN‐γ production from PBMC of active TB patients. (A) CD3+ T‐cells proliferation from PBMC stimulated with BCG, with BCG in RPMI medium conditioned with supernatant of thrombin‐activated platelets or with BCG in RPMI medium conditioned with supernatant of thrombin‐activated platelets depleted of TGF‐β. The graph represents the pooled data (median and IQR) from seven different experiments performed with samples of seven active TB. (B) IFN‐γ production from PBMC stimulated with BCG in RPMI medium conditioned with supernatant of thrombin‐activated platelets depleted of TGF‐β. The graph represents the pooled data (median and IQR) from nine different experiments performed with samples of nine active TB. (C) Bacterial burden counted at 72 h in THP1‐derived macrophages infected with chemiluminescent. M. tuberculosis and cultured in RPMI medium without antibiotics, RPMI medium added with 10% of supernatant of activated platelets from active patients or RPMI medium added with 10% of the same supernatant of activated platelets depleted of PF4. The graph represents the pooled data (median and IQR) from one experiment with eight active TB. The significant differences between groups were analyzed using Kruskal–Wallis test, *< 0.05, **< 0.01, and ***< 0.001.

Similar articles

Cited by

References

    1. World Health Organization . Global tuberculosis report 2020. Geneva: World Health Organization; 2020.
    1. Matteelli, A. , Sulis, G. , Capone, S. , D'Ambrosio, L. , Migliori, G. B. and Getahun, H. , Tuberculosis elimination and the challenge of latent tuberculosis. La Presse Médicale 2017. 46( Part 2): e13–e21. - PubMed
    1. Harries, A. D. , Kumar, A. M. V. , Challenges and progress with diagnosing pulmonary tuberculosis in low‐ and middle‐income countries. Diagnostics 2018. 8:78. - PMC - PubMed
    1. Scolarici, M. , Dekitani, K. , Chen, L. , Sokol‐Anderson, M. , Hoft, D. F. and Chatterjee, S. , A scoring strategy for progression risk and rates of treatment completion in subjects with latent tuberculosis. PLoS One 2018. 13: e0207582. - PMC - PubMed
    1. Winter, J. R. , Adamu, A. L. , Gupta, R. K. , Stagg, H. R. , Delpech, V. and Abubakar, I. , Tuberculosis infection and disease in people living with HIV in countries with low tuberculosis incidence. Int. J. Tuberc. Lung Dis. 2018. 22: 713–722. - PubMed

Publication types