. 2022 Jul 1:254:119138.
doi: 10.1016/j.neuroimage.2022.119138. Epub 2022 Mar 23.

Accuracy and reliability of diffusion imaging models

Affiliations

Accuracy and reliability of diffusion imaging models

Nicole A Seider et al. Neuroimage. .

Abstract

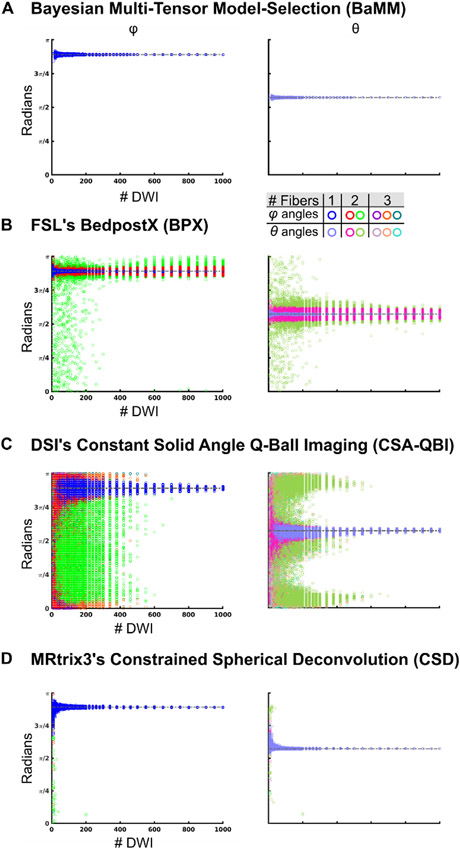
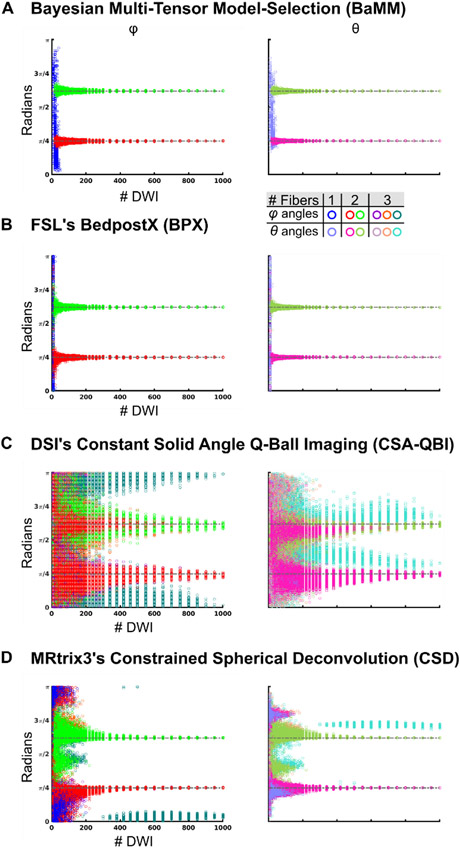
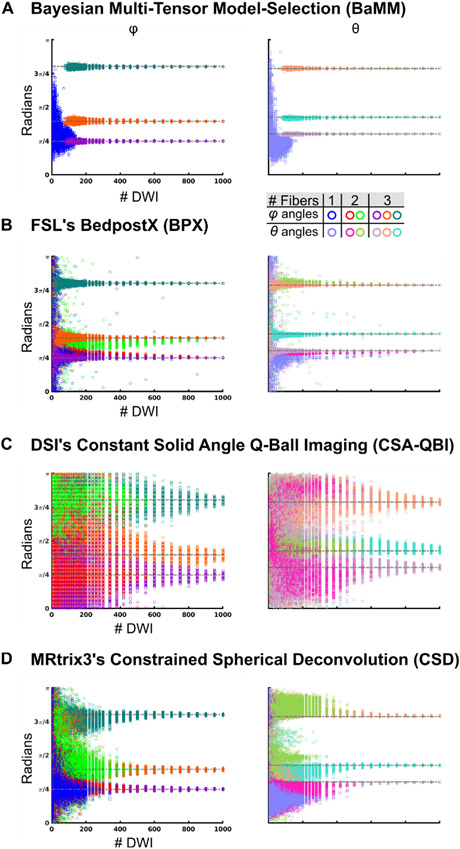
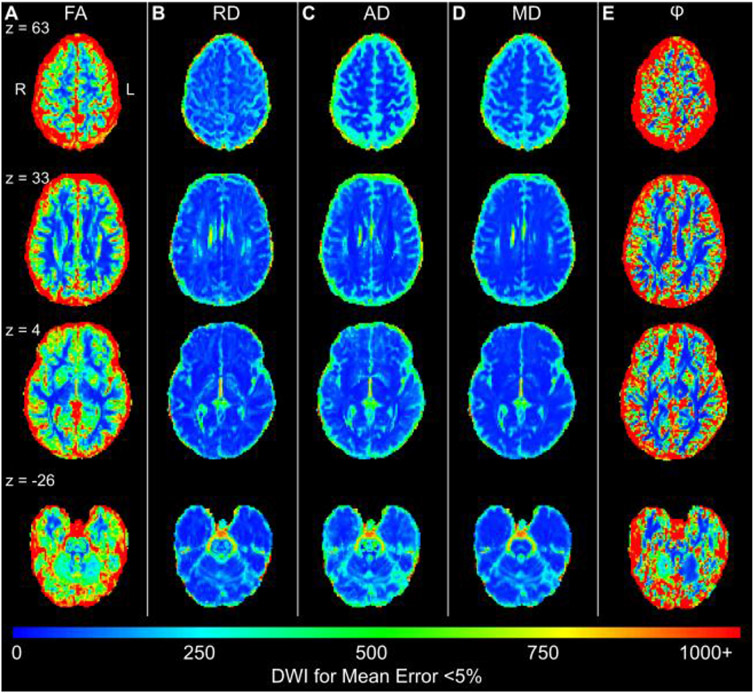
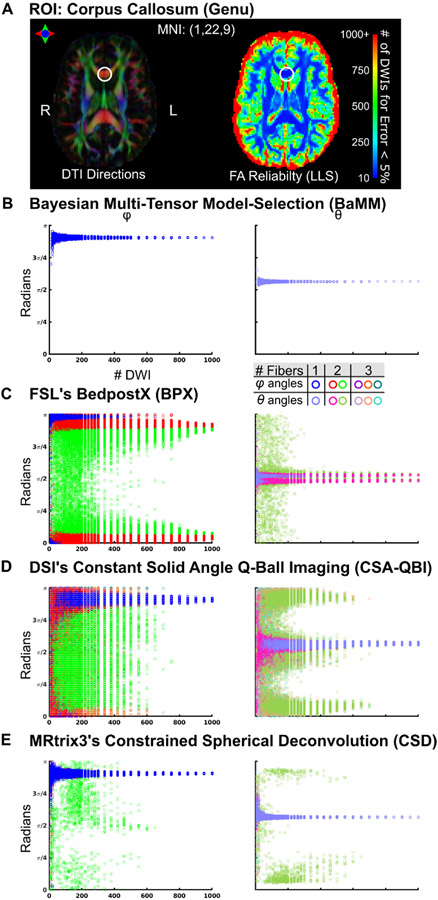
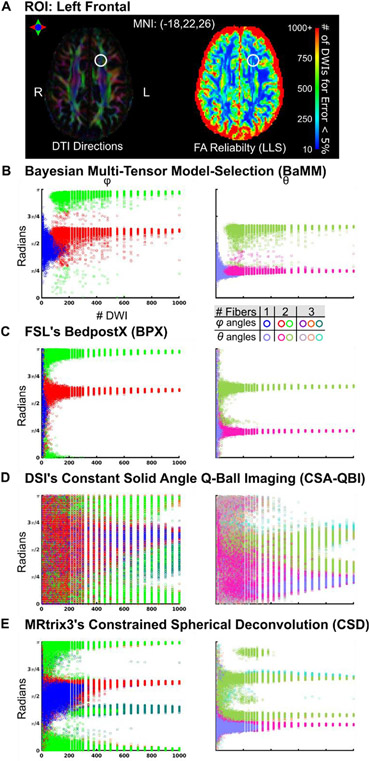
Diffusion imaging aims to non-invasively characterize the anatomy and integrity of the brain's white matter fibers. We evaluated the accuracy and reliability of commonly used diffusion imaging methods as a function of data quantity and analysis method, using both simulations and highly sampled individual-specific data (927-1442 diffusion weighted images [DWIs] per individual). Diffusion imaging methods that allow for crossing fibers (FSL's BedpostX [BPX], DSI Studio's Constant Solid Angle Q-Ball Imaging [CSA-QBI], MRtrix3's Constrained Spherical Deconvolution [CSD]) estimated excess fibers when insufficient data were present and/or when the data did not match the model priors. To reduce such overfitting, we developed a novel Bayesian Multi-tensor Model-selection (BaMM) method and applied it to the popular ball-and-stick model used in BedpostX within the FSL software package. BaMM was robust to overfitting and showed high reliability and the relatively best crossing-fiber accuracy with increasing amounts of diffusion data. Thus, sufficient data and an overfitting resistant analysis method enhance precision diffusion imaging. For potential clinical applications of diffusion imaging, such as neurosurgical planning and deep brain stimulation (DBS), the quantities of data required to achieve diffusion imaging reliability are lower than those needed for functional MRI.


Conflict of interest statement

Declaration of Competing Interest The authors declare that they have no known competing financial interests or personal relationships that could have appeared to influence the work reported in this paper.

Figures

Fig. 1.
Fig. 1.. Estimated Tensor and Angles
(A) Constant Solid Angle Q-Ball Imaging (QBI) reports fifteen spherical harmonic values, from which a 3D surface is estimated. The surface is colored by the orientation distribution function (ODF). The surface/ODF peaks are extracted (black line) and angles φ and θ estimated to match in B. (B) For Linear Least Squares (LLS) and Single Tensor Bayesian (STB), the tensor describing Brownian diffusion of water was calculated. Three eigenvalues are used to describe the tensor shape. From the largest eigenvector, two angles are estimated to describe the tensor orientation in 3D space. For Bayesian Multi-Tensor Model-Selection (BaMM) and FSL’s BedpostX (BPX), a stick corresponding to eigenvector-1 is estimated and its angles reported.
Fig. 2.
Fig. 2.. B-Vector selection
Subjects were scanned every day for two weeks, with 96 unique B-vector directions acquired each scan. A) All 1152 B-Vectors from the daily scans plotted on a single sphere. B) B-Vectors were subdivided by their position on the sphere into 16 groups of equal surface area, 4 of which are shown. Encodings were pseudo-randomly selected from the 16 groups to obtain approximately uniform angular sampling over the sphere.
Fig. 3.
Fig. 3.. Accuracy of Diffusion Measures: Simulated Single Tensor
(A) φ/θ angle estimations by Bayesian Multi-tensor Model-selection (BaMM). Open circles represent the results obtained by repeated permutation sampling. Same color legend for all data panels. Permutations that resulted in a single fiber direction are plotted in blue/sky blue (φ/θ). Permutations that resulted in two fibers are plotted in red/pink (φ/θ) and green/olive (φ/θ). Permutations that resulted in three fibers are plotted in purple/lilac (φ/θ), orange/salmon (φ/θ), and teal/cyan (φ/θ). (B) FSL’s BedpostX (BPX). (C) Constant Solid Angle Q-Ball Imaging (CSA-QBI). (D) Constrained Spherical Deconvolution (CSD).
Fig. 4.
Fig. 4.. Accuracy of diffusion measures: simulated two crossing tensors
The tensors were oriented such that they were perpendicular to each other. The first tensor had larger weighting equal to 60% of the signal. Rician noise was added for an SNR = 50. (A) φ/θ angle estimations by Bayesian Multi-tensor Model-selection (BaMM). Open circles represent the results obtained by repeated permutation sampling. Same color legend for all data panels. Permutations that resulted in a single fiber direction are plotted in blue/sky blue (φ/θ). Permutations that resulted in two fibers are plotted in red/pink (φ/θ) and green/olive (φ/θ). Permutations that resulted in three fibers are plotted in purple/lilac (φ/θ), orange/salmon (φ/θ), and teal/cyan (φ/θ). (B) FSL’s BedpostX (BPX). (C) Constant Solid Angle Q-Ball Imaging (CSA-QBI). (D) Constrained Spherical Deconvolution (CSD).
Fig. 5.
Fig. 5.. Accuracy of diffusion measures in simulated three crossing tensor data
The tensors were oriented such that they were perpendicular to each other. The tensors had weighting equal to 40%, 34%, and 26% of the signal. Rician noise was added for an SNR = 50. (A) φ/θ angle estimations by Bayesian Multi-tensor Model-selection (BaMM). Open circles represent the results obtained by repeated permutation sampling. Same color legend for all data panels. Permutations that resulted in a single fiber direction are plotted in blue/sky blue (φ/θ). Permutations that resulted in two fibers are plotted in red/pink (φ/θ) and green/olive (φ/θ). Permutations that resulted in three fibers are plotted in purple/lilac (φ/θ), orange/salmon (φ/θ), and teal/cyan (φ/θ). (B) FSL’s BedpostX (BPX). (C) Constant Solid Angle Q-Ball Imaging (CSA-QBI). (D) Constrained Spherical Deconvolution (CSD).
Fig. 6.
Fig. 6.. Whole-brain DTI reliability map (linear least squares) for mean error < 5% (Subject 2)
(A) The color scale shows the number of DWI measurements needed to achieve a voxel-wise error less than 5% in FA. Error is calculated relative to the mean FA found using the entire sample. Results for (B) RD, (C) AD, (D) MD, and (E) angle φ are shown. Subjects 1 and 3 are shown in Figure S15, all subjects shown in S16.
Fig. 7.
Fig. 7.. Reliability of diffusion measures in the genu of the corpus callosum (subject 2)
(A) The locus of the analyzed voxel (MNI: 1, 22, 9) is marked with a circle. Linear Least Squares (LLS) FA reliability map as in Fig. 6A. (B) φ/θ angle estimations by Bayesian Multi-tensor Model-selection (BaMM). (C) FSL’s BedpostX (BPX). (D) Constant Solid Angle Q-Ball Imaging (CSA-QBI). (E) Constrained Spherical Deconvolution (CSD). Subject 1 and 3 in Figures S18-19, respectively.
Fig. 8.
Fig. 8.. Reliability of diffusion measures in left frontal region (Subject 2)
(A) The locus of the analyzed voxel (MNI: 18, 22, 26) is marked with a circle. Linear Least Squares (LLS) FA reliability map as in Fig. 6A (B) φ/θ angle estimations by Bayesian Multi-tensor Model-selection (BaMM). (C) FSL’s BedpostX (BPX). (D) Constant Solid Angle Q-Ball Imaging (CSA-QBI). (E) Constrained Spherical Deconvolution (CSD). Subject 1 and 3 in Figures S22-23, respectively.

References

    1. Aganj I, Lenglet C, Sapiro G, Yacoub E, Ugurbil K, Harel N, 2010. Reconstruction of the orientation distribution function in single- and multiple-shell q-ball imaging within constant solid angle. Magn. Reson. Med 64, 554–566. - PMC - PubMed
    1. Alexander AL, Hasan KM, Lazar M, Tsuruda JS, Parker DL, 2001. Analysis of partial volume effects in diffusion-tensor MRI. Magn. Reson. Med 45, 770–780. - PubMed
    1. Alexander DC, Dyrby TB, Nilsson M, Zhang H, 2019. Imaging brain microstructure with diffusion MRI: practicality and applications. NMR Biomed. 32, e3841. - PubMed
    1. Andersson JLR, Sotiropoulos SN, 2016. An integrated approach to correction for of-f-resonance effects and subject movement in diffusion MR imaging. Neuroimage 125, 1063–1078. - PMC - PubMed
    1. Basser PJ, Mattiello J, LeBihan D, 1994a. Estimation of the effective self-diffusion tensor from the NMR spin echo. J. Magn. Reson. B 103, 247–254. - PubMed

Publication types