. 2022 Nov;76(5):1302-1317.
doi: 10.1002/hep.32483. Epub 2022 Apr 24.

Cellular heterogeneity and transcriptomic profiles during intrahepatic cholangiocarcinoma initiation and progression

Affiliations

Cellular heterogeneity and transcriptomic profiles during intrahepatic cholangiocarcinoma initiation and progression

Tingjie Wang et al. Hepatology. 2022 Nov.

Abstract

Background and aims: Intrahepatic cholangiocarcinoma (ICC) is not fully investigated, and how stromal cells contribute to ICC formation is poorly understood. We aimed to uncover ICC origin, cellular heterogeneity, and critical modulators during ICC initiation/progression, and to decipher how fibroblast and endothelial cells in the stromal compartment favor ICC progression.

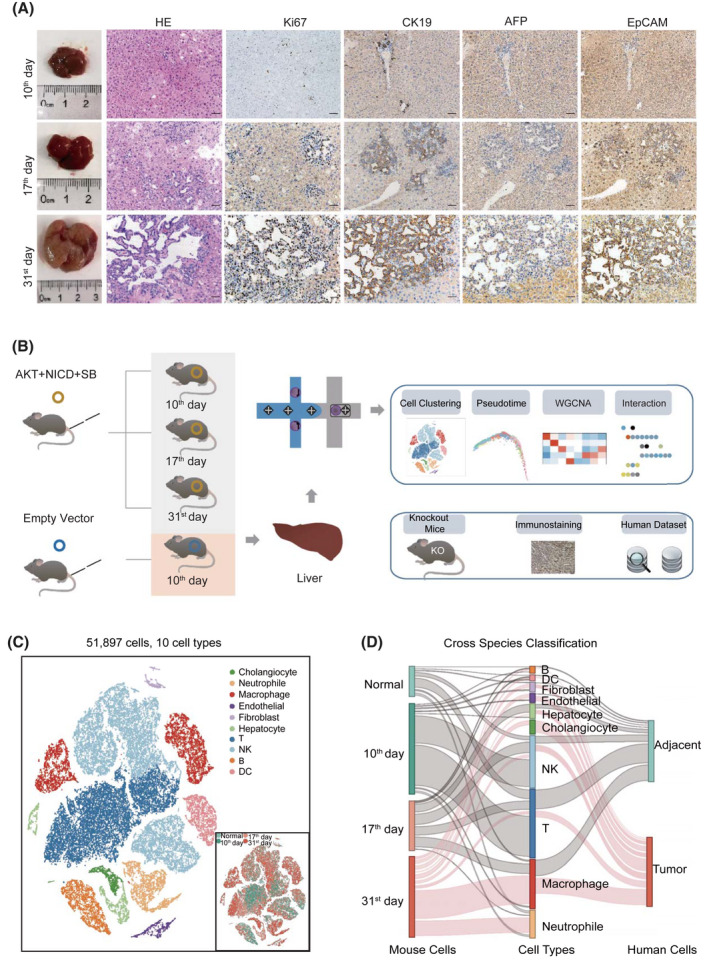
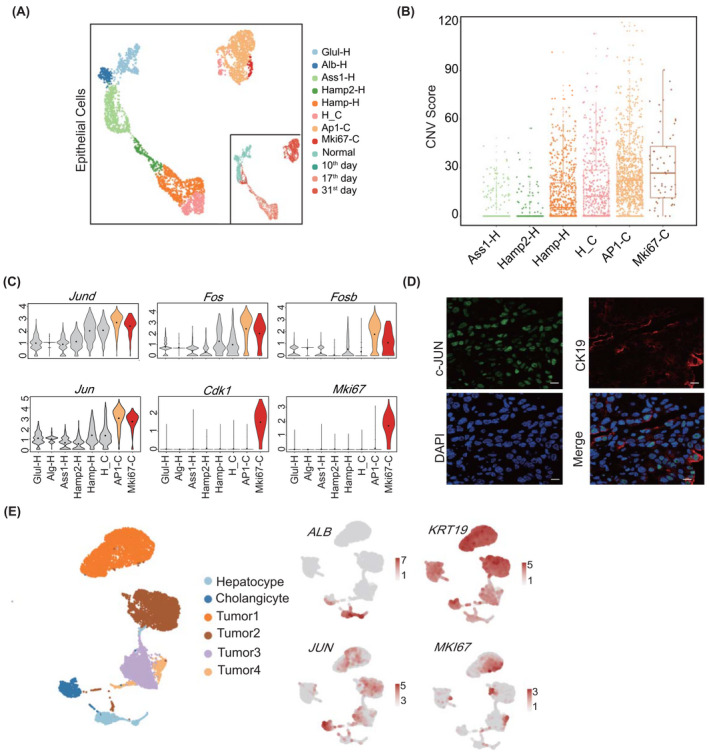
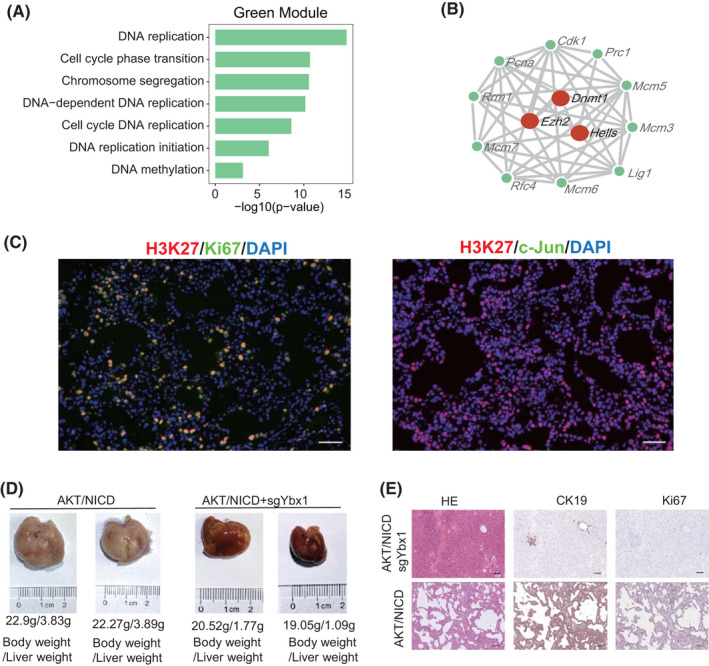
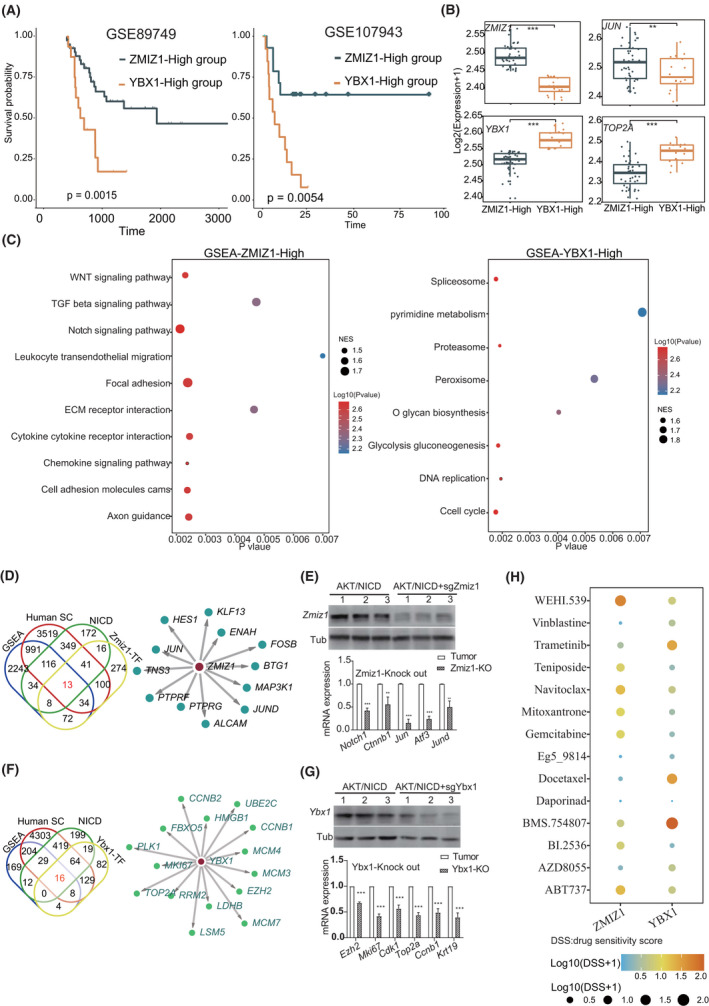
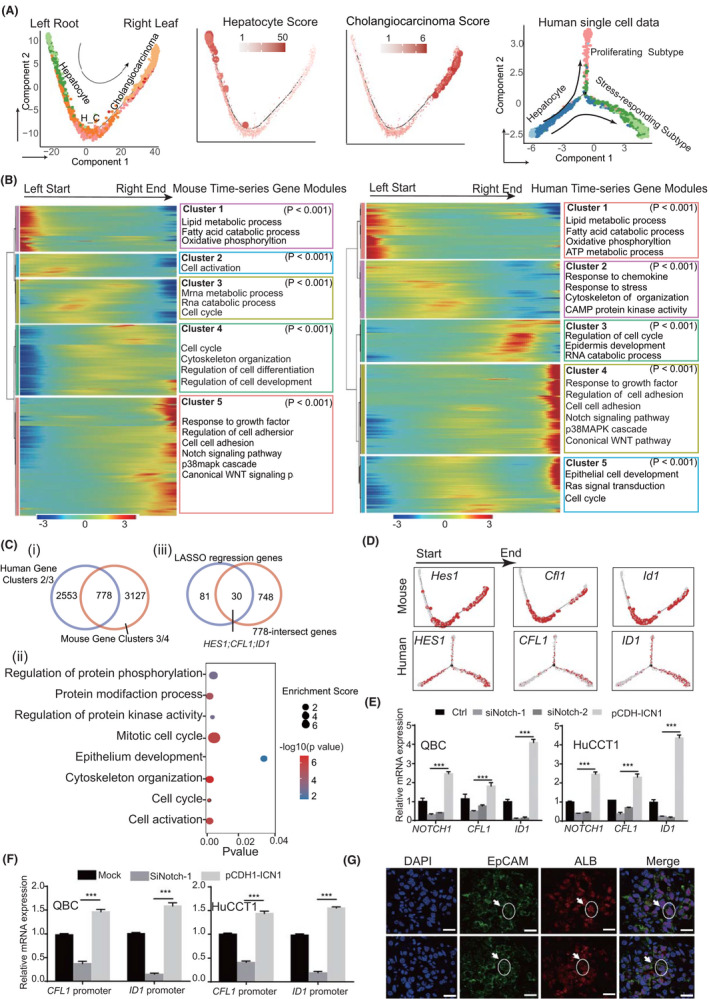
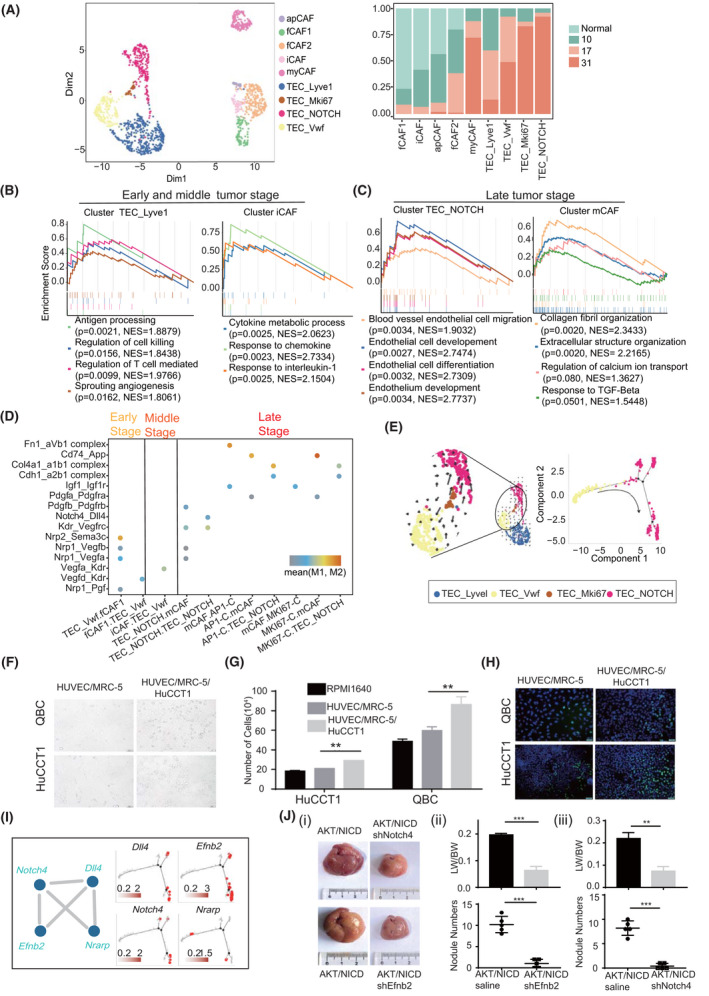
Approach and results: We performed single-cell RNA sequencing (scRNA-seq) using AKT/Notch intracellular domain-induced mouse ICC tissues at early, middle, and late stages. We analyzed the transcriptomic landscape, cellular classification and evolution, and intercellular communication during ICC initiation/progression. We confirmed the findings using quantitative real-time PCR, western blotting, immunohistochemistry or immunofluorescence, and gene knockout/knockdown analysis. We identified stress-responding and proliferating subpopulations in late-stage mouse ICC tissues and validated them using human scRNA-seq data sets. By integrating weighted correlation network analysis and protein-protein interaction through least absolute shrinkage and selection operator regression, we identified zinc finger, MIZ-type containing 1 (Zmiz1) and Y box protein 1 (Ybx1) as core transcription factors required by stress-responding and proliferating ICC cells, respectively. Knockout of either one led to the blockade of ICC initiation/progression. Using two other ICC mouse models (YAP/AKT, KRAS/p19) and human ICC scRNA-seq data sets, we confirmed the orchestrating roles of Zmiz1 and Ybx1 in ICC occurrence and development. In addition, hes family bHLH transcription factor 1, cofilin 1, and inhibitor of DNA binding 1 were identified as driver genes for ICC. Moreover, periportal liver sinusoidal endothelial cells could differentiate into tip endothelial cells to promote ICC development, and this was Dll4-Notch4-Efnb2 signaling-dependent.

Conclusions: Stress-responding and ICC proliferating subtypes were identified, and Zmiz1 and Ybx1 were revealed as core transcription factors in these subtypes. Fibroblast-endothelial cell interaction promotes ICC development.


Conflict of interest statement

Nothing to report.

Figures

FIGURE 1
FIGURE 1
Transcriptomic profiling of AKT/Notch intracellular domain (NICD)–induced intrahepatic cholangiocarcinoma (ICC) in mice. (A) Hematoxylin and eosin (HE) staining and immunohistochemistry of mouse liver tissues collected on days 10, 17, and 31 after AKT/NICD plasmid injection. Scale bars represent 50 μm. (B) Overview of the study design. (C) The t‐distributed stochastic neighbor embedding (t‐SNE) visualization of 51,897 cells from nine mouse ICC samples. Clusters and sample origins are distinguished by colors. (D) Comparison of cellular profiles between human and mouse ICC data (Sankey diagram). The height of each linkage line reflects the number of cells. The red line between cell types and two data sets represents the ICC cells from mice collected on day 31 and those from human samples. AFP, alpha‐fetoprotein; EpCAM, epithelial cell adhesion molecule; KO, knockout; SB, sleeping beauty transposase; WGCNA, weighted correlation network analysis
FIGURE 2
FIGURE 2
Cellular heterogeneity of ICC tissues at different stages. (A) Eight subtypes in liver epithelial cells illustrated using uniform manifold approximation and projection (UAMP) plots and indicated with different colors. Sample origins are distinguished by colors as shown on the right bottom. (B) Copy number variation (CNV) box plots for distinct epithelial cell subtypes, indicating the malignant subtypes AP1‐C and Mki67‐C. For the boxplot, the centerline represents the median; box limits represent upper and lower quartiles; and whiskers represent the data range. (C) Violin plots showing the expression of marker genes in distinct malignant subtypes. (D) Immunofluorescence of c‐Jun (jun proto‐oncogene, Jun) in mice cells collected on day 31. The scale bars represent 10 µm. (E) Validating the two ICC subtypes in human ICC epithelial cells, the color from gray to red represents the expression level from low to high. ALB, albumin; Alb‐H, Alb positive hepatocyte; AP1‐C, AP1 positive cholangiocyte; Ass1‐H, Ass1 positive hepatocyte; Cdk1, cyclin‐dependent kinase 1; CK19, keratin 19 (Krt19); DAPI, 4′,6‐diamidino‐2‐phenylindole; Fos, FBJ osteosarcoma oncogene; Fosb, FBJ osteosarcoma oncogene B; Glul‐H, Glul positive hepatocyte; Hamp‐H, Hamp positive hepatocyte; H_C, cells with hepatocyte and cholangiocyte markers; Hamp2‐H, Hamp2 positive hepatocyte; Jund, jun D proto‐oncogene; Mki67, antigen identified by monoclonal antibody Ki67; Mki67‐C, Mki67 positive cholangiocyte
FIGURE 3
FIGURE 3
Transcription factors (TFs) involved in the stress‐responding subtype. (A) Workflow of the TF screening method. (B) WGCNA results showing the gene modules in distinct epithelial cell subtypes. Columns represent cell types. The color from blue to red indicates a low to a high correlation between gene module and cell subtypes (Pearson correlation test). (C) Enrichment analysis using the hub genes in stress‐responding subtype using clusterProfiler. (D) Hub gene network of the stress‐responding subtype, in which red nodes indicate the methylation and AP1‐related genes. (E) Immunofluorescence of H3K4, Ki67, and c‐Jun in AKT/NICD mouse ICC tissues. Scale bar = 50 μm. (F) Gross images of AKT/NICD mice with or without sgZmiz1 injection. (G) Immunohistochemistry of AKT/NICD mouse livers injected with sgZmiz1. Scale bar = 50 μm; magnification = ×200. Actb, actin, beta; Ash1l, ASH1 like histone lysine methyltransferase; Arid4b, AT‐rich interaction domain 4B; Atf3, activating transcription factor 3; Atrx, ATRX chromatin remodeler; Brd2, bromodomain containing 2; Cbx6, chromobox 6; c‐Jun, Jun; Ets2, E26 avian leukemia oncogene 2, 3' domain; Hsp90b1, heat shock protein 90 beta family member 1; H3f3b, H3.3 histone B; Jmjd1c, jumonji domain containing 1C; Ki67, Mki67; Kdm6b, lysine demethylase 6B; Kmt2e, lysine (K)‐specific methyltransferase 2E; MAPK, mitogen‐activated protein kinase; Nfe2l2, nuclear factor, erythroid derived 2, like 2; Ncor1, nuclear receptor co‐repressor 1; Nsd1, nuclear receptor‐binding SET‐domain protein 1; Pbrm1, polybromo 1; PPI, protein–protein interaction; Sptan1, spectrin alpha, non‐erythrocytic 1; Smarca2/4/5, Rela, v‐rel reticuloendotheliosis viral oncogene homolog A (avian); SWI/SNF related, matrix associated, actin dependent regulator of chromatin, subfamily a, member 2/4/5; Sox9, SRY‐box transcription factor 9; Stat3, signal transducer and activator of transcription 3; Tnrc6a, trinucleotide repeat containing 6a
FIGURE 4
FIGURE 4
Distinct function of TFs involved in the proliferating subtype. (A) Enrichment analysis of the proliferating subtype hub genes using clusterProfiler. (B) Hub gene network of the proliferating subtype, in which red nodes indicate the methylated genes. (C) Immunofluorescence of H3K27 methylation, c‐Jun (Jun), and Ki67 (Mki67) in AKT/NICD mouse ICC tissues. Scale bar = 50μm. (D) Gross images of AKT/NICD mice with or without sgYbx1 injection. (E) Immunohistochemistry of AKT/NICD mouse livers with sgYbx1 injection. Scale bar = 50 μm; Magnification = ×200. Cdk1, yclin‐dependent kinase 1; CK19, Krt19; Dnmt1, DNA methyltransferase (cytosine‐5) 1; Ezh2, enhancer of zeste 2 polycomb repressive complex 2 subunit; Hells, helicase, lymphoid specific; Lig1, ligase I, DNA, ATP‐dependent; Mcm3/5/6/7, minichromosome maintenance complex component 3/5/6/7; Pcna, proliferating cell nuclear antigen; Prc1, protein regulator of cytokinesis 1; Rfc4, replication factor C (activator 1) 4; Rrm1, ribonucleotide reductase M1
FIGURE 5
FIGURE 5
Distinct function of ZMIZ1 and YBX1 in ICC. (A) Prognosis of ZMIZ1‐high and YBX1‐high patients in two bulk RNA data sets (GSE89749 and GSE107943). Statistical significance was calculated using the log‐rank test. (B) Expression levels of AP1 and proliferating genes in the ZMIZ1‐high and YBX1‐high group (***p < 0.001; **p < 0.01; Wilcoxon rank‐sum test). (C) Dot plot showing the gene‐set enrichment analysis (GSEA) result in the ZMIZ1‐high and YBX1‐high groups. Dot size indicates the normalized enrichment score (NES) values, and colors indicate p values. (D) Venn plot showing targets of ZMIZ1 (left) and the TF network showing the ZMIZ1 regulon. (E) Western blots showing Zmiz1 expression in AKT/NICD and AKT/NICD+sgZmiz1 mice (upper). Expression of Zmiz1 target genes in tumor tissues and Zmiz1‐knockout mice (***p < 0.001, **p < 0.01; Student’s t test). (F) Venn plot showing target genes of YBX1 (left) and the TF network showing the YBX1 regulon. (G) Western blots showing Ybx1 expression in the AKT/NICD and AKT/NICD+sgYbx1 mice (upper). Expression of Ybx1 target genes in tumor tissues and Zmiz1‐knockout mice (***p < 0.001, **p < 0.01; Student’s t test). (H) Dot plot showing the mean drug sensitivity scores (DSSs) using the ZMIZ1 and YBX1 regulon through oncoPredict. Colors from blue to red indicate the Log10 (DSSs + 1) low to high (***p < 0.001, **p < 0.01; Wilcoxon rank‐sum test). Human SC, human single‐cell data
FIGURE 6
FIGURE 6
Genes related to ICC initiation in mouse and human. (A) Pseudo‐time analysis of epithelial cells using mouse and human ICC single‐cell data. Hepatocyte and cholangiocarcinoma scores were determined according to the average expression of their marker genes. Colors from gray to red and dot size indicate the value from low to high. (B) Differentially expressed genes (rows) along the pseudo‐time (columns) were clustered hierarchically into five groups in mice and human data. Pathway enrichment scores were calculated using clusterProfiler. (C) (i) Veen plots showing 778 genes from intermediated gene modules along the pseudo‐time axis both in mouse and human data. (ii) Dot plot showing the enriched pathways of 778 genes; dot size indicates enrichment score (GeneRatio/BgRatio in clusterProfiler), and color indicates the p values. Pathway enrichment scores were calculated using clusterProfiler. (iii) 30 genes obtained by overlapping the LASSO genes with the 778 genes. (D) Gene‐expression level of the three genes along the pseudo‐time axis. Colors from gray to red represent their expression level low to high. (E) mRNA expression of CFL1 and ID1 in ICC cell lines QBC and HuCCT1 cells after NOTCH1 silencing or overexpression (***p < 0.001; Student’s t test). (F) Relative luciferase activity detected in QBC and HuCCT1 cells 48 h after transfection. ICC cells were transfected with luciferase reporter plasmid, then with NOTCH1 shRNA or infected with the pCDH‐ICN1 lentivirus (***p < 0.001; Student’s t test). (G) Immunofluorescence of double‐positive (Alb+Epcam+) cells in liver tissues of mice collected on day 17. The dotted circle outlines the cells. The scale bars represent 20 μm. CAMP, cyclic adenosine monophosphate; LASSO, least absolute shrinkage and selection operator
FIGURE 7
FIGURE 7
Endothelial cells and fibroblasts promote ICC development. (A) Uniform manifold approximation and projection (UMAP) of endothelial cells and fibroblasts. Sample origins are distinguished via colors as shown on the right. GSEA plot showing gene functions in endothelial cell and fibroblast subtypes at early and middle stages (B) and late stage (C) of ICC. NES and p values were calculated using GSEA. (D) Dot plot showing the L–R pairs between endothelial cells, fibroblasts, and ICC cells at different tumor stages. Rows represent the L–R pairs, and columns represent cell subset–cell subset pairs. The color gradient from black/blue to red indicates mean values of the L–R pairs from low to high, and the circle size indicates the significance of the pairs. p values were calculated via a permutation test using CellPhoneDB. (E) RNA velocities visualized on the UMAP projection showing the differentiation trajectory from TEC_Vwf to TEC_NOTCH. (F) QBC and HuCCT1 cells were co‐cultured with HUVECs and human embryonic lung fibroblast MRC‐5 cells at a ratio of 1:1:1 for 24 h to establish a conditioned medium. Scale bar = 50 μm; magnification = ×200. (G) QBC and HuCCT1 cells were cultured in the conditioned medium and Roswell Park Memorial Institute 1640 medium (1:1) for 24 h, and cell numbers were determined (**p < 0.01; Student’s t test). (H) 5‐Ethynyl‐2’‐deoxyuridine (EDU) staining to detect the proliferation of QBC and HuCCT1 cells cultured in the conditioned medium for 24 h. (I) Genes in the WGCNA‐PPI subnetwork in TEC‐NOTCH and their pseudo‐time profile. (J) (i) Gross images of AKT/NICD mice injected with shNotch4 or shEfnb2 AAV1. Transparent and convex nodules with yellow liquid are ICC lesions. (ii) Quantification of ICC nodule numbers and the ratio of liver weight (LW) to body weight (BW) in two groups of mice with or without shEfnb2 (ii)/shNotch4 (iii) (n = 5, ***p < 0.001; Student’s t test)

Comment in

References

    1. Banales JM, Marin JJG, Lamarca A, Rodrigues PM, Khan SA, Roberts LR, et al. Cholangiocarcinoma 2020: the next horizon in mechanisms and management. Nat Rev Gastroenterol Hepatol. 2020;17:557–88. - PMC - PubMed
    1. Fan B, Malato Y, Calvisi DF, Naqvi S, Razumilava N, Ribback S, et al. Cholangiocarcinomas can originate from hepatocytes in mice. J Clin Invest. 2012;122:2911–5. - PMC - PubMed
    1. Wang J, Dong M, Xu Z, Song X, Zhang S, Qiao YU, et al. Notch2 controls hepatocyte‐derived cholangiocarcinoma formation in mice. Oncogene. 2018;37:3229–42. - PMC - PubMed
    1. Song X, Xu H, Wang P, Wang J, Affo S, Wang H, et al. Focal adhesion kinase (FAK) promotes cholangiocarcinoma development and progression via YAP activation. J Hepatol. 2021;75:888–99. - PMC - PubMed
    1. Xiang X, Liu Z, Zhang C, Li Z, Gao J, Zhang C, et al. IDH mutation subgroup status associates with intratumor heterogeneity and the tumor microenvironment in intrahepatic cholangiocarcinoma. Adv Sci. 2021;8:e2101230. - PMC - PubMed

Publication types