. 2021;116(535):1181-1192.
doi: 10.1080/01621459.2021.1945458. Epub 2021 Apr 22.

A Gibbs sampler for a class of random convex polytopes

Affiliations

A Gibbs sampler for a class of random convex polytopes

Pierre E Jacob et al. J Am Stat Assoc. 2021.

Abstract

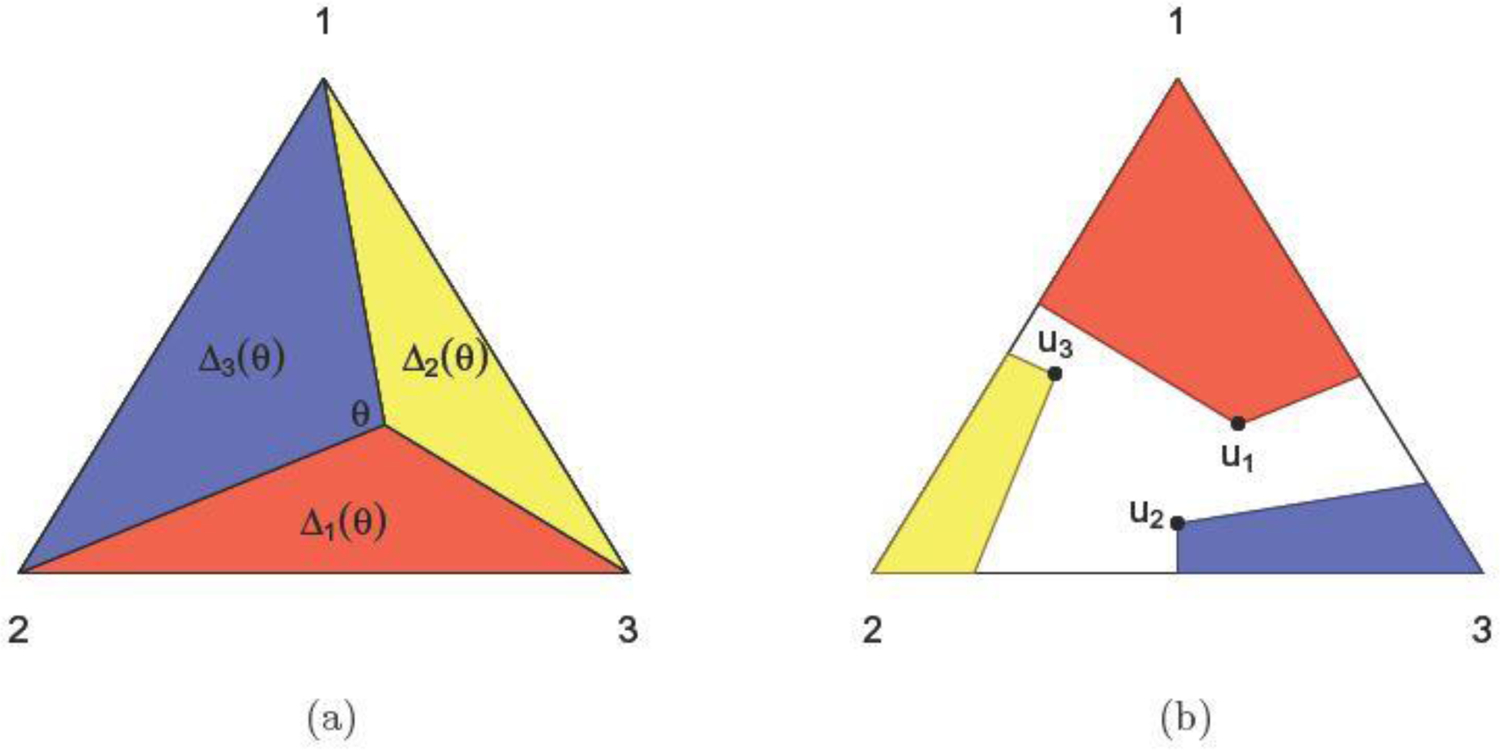
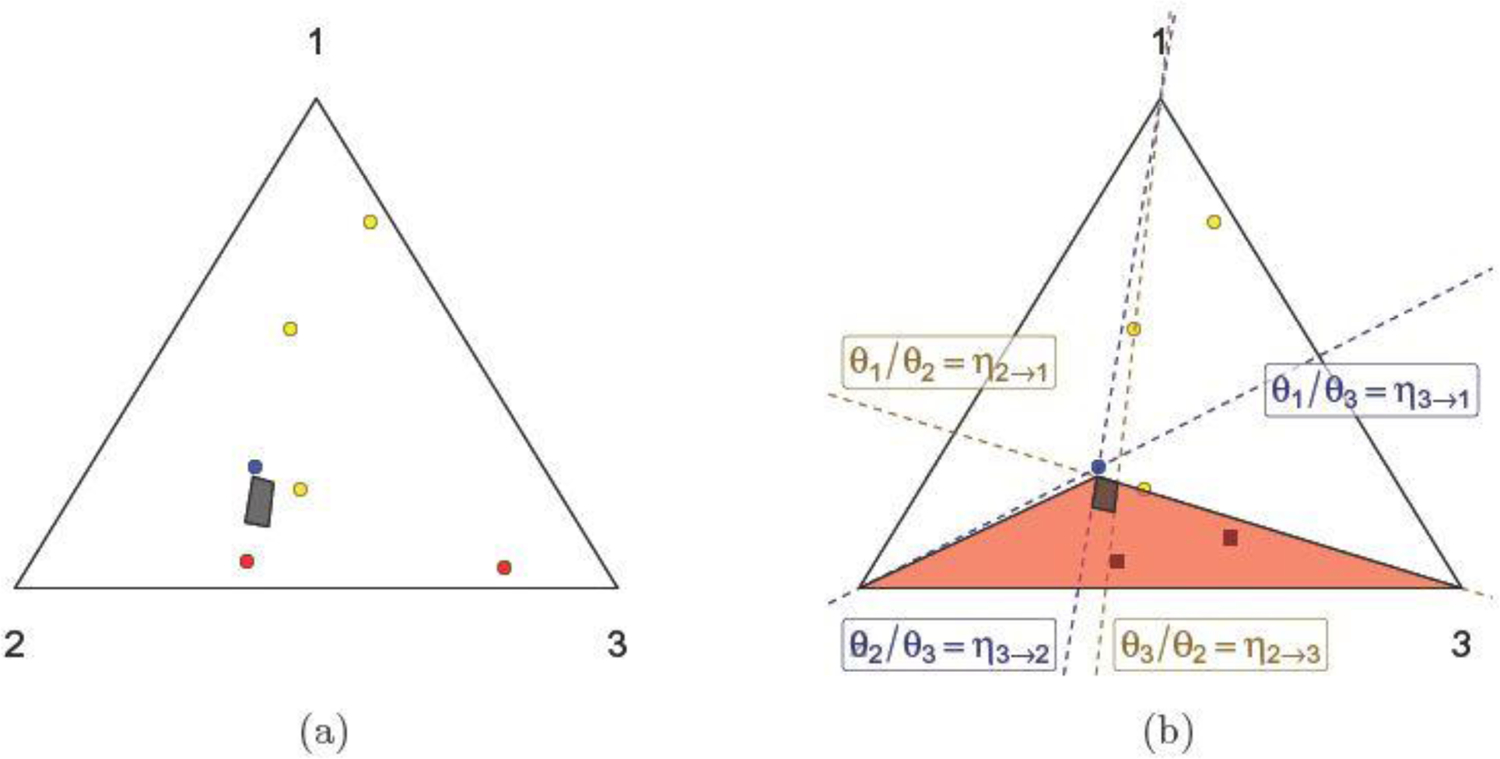
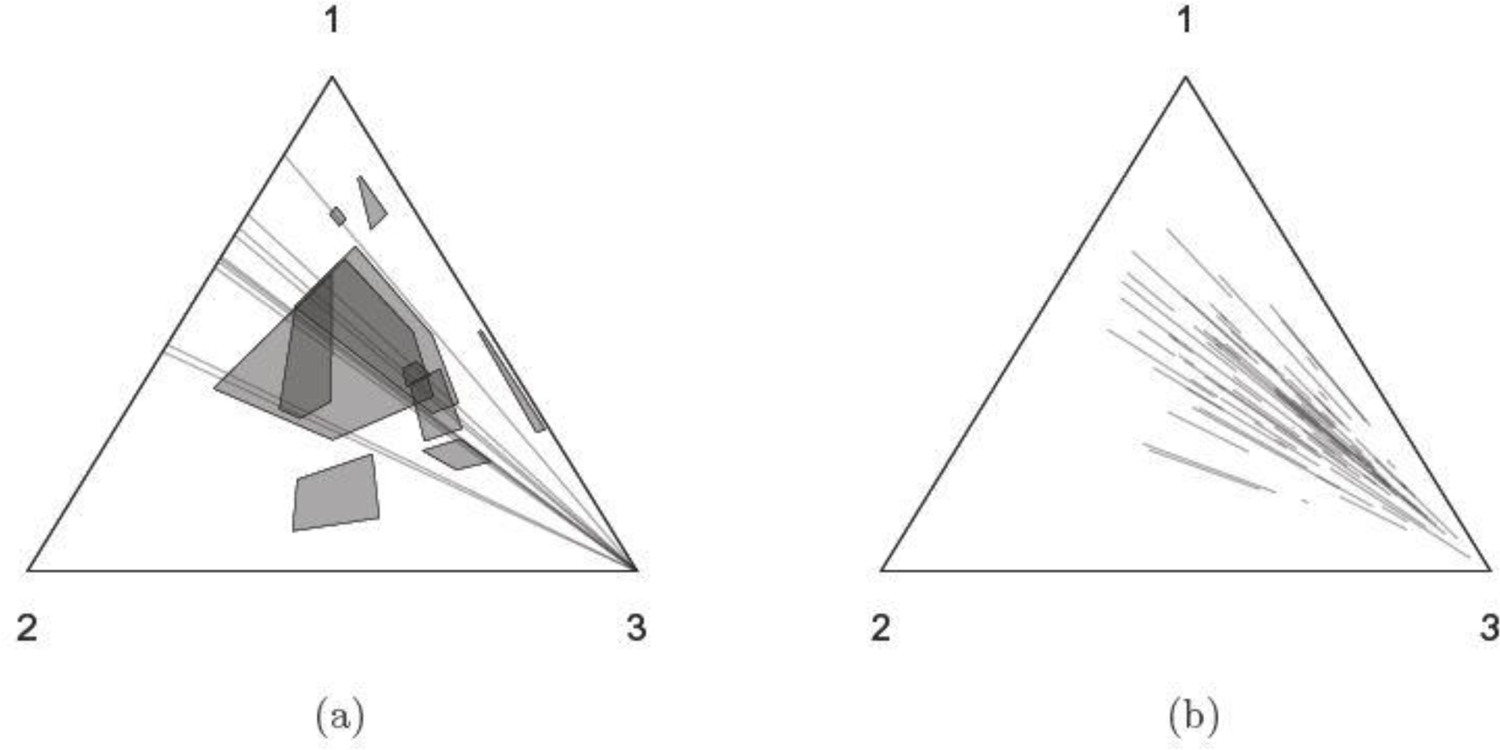
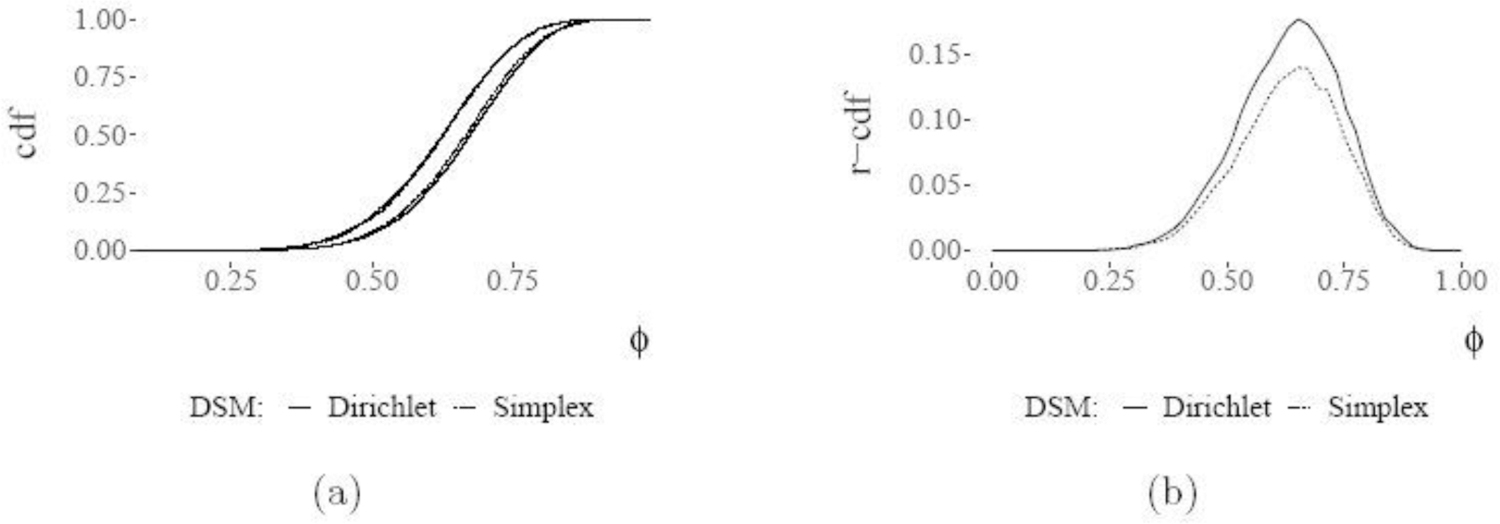
We present a Gibbs sampler for the Dempster-Shafer (DS) approach to statistical inference for Categorical distributions. The DS framework extends the Bayesian approach, allows in particular the use of partial prior information, and yields three-valued uncertainty assessments representing probabilities "for", "against", and "don't know" about formal assertions of interest. The proposed algorithm targets the distribution of a class of random convex polytopes which encapsulate the DS inference. The sampler relies on an equivalence between the iterative constraints of the vertex configuration and the non-negativity of cycles in a fully connected directed graph. Illustrations include the testing of independence in 2 × 2 contingency tables and parameter estimation of the linkage model.

Keywords: Algorithms; Bayesian methods; Categorical data analysis; Simulation.


Figures

Fig. 1
Fig. 1
Partition of Δ into (Δk (θ))k∈[K] in 1(a), with K = 3. Each point un ∈Δ defines, for a fixed xn ∈[K], a set of θ ∈Δ such that unΔxnθ; three such sets are colored in 1(b), for x1 = 1, x2 = 3, x3 = 2. Here, no θ ∈Δ is such that unΔxnθ for n = 1, 2, 3.
Fig. 2
Fig. 2
Given uRx (shown in 2(a)), drop components uIk for some k ∈[K] (the red dots in 2(a)) and draw new components uIk (the red squares in 2(b)) from their conditional distribution identified in Proposition 3.2 with support represented by the shaded triangle.
Fig. 3
Fig. 3
Two views on the constraints in (3.2). In 3(a) the values ηk define linear constraints θ/θk=ηk. In 3(b) the log values are weights on the edges of a complete directed graph.
Fig. 4
Fig. 4
Elapsed time in seconds for 100 iterations of the sampler. In 4(a), elapsed time as a function of N, for different K. In 4(b), elapsed time as a function of K, for different N.
Fig. 5
Fig. 5
Upper bounds on the TV distance between u(t) and νx against t. Figure 5(a) shows varying K with 10 counts in each category. Figure 5(b) shows varying N with K = 5 and N / K counts in each category.
Fig. 6
Fig. 6
Inference on θ1 (6(a)) and on log(θ1 / θ2) (6(b)) using counts (4, 3) (K = 2) and (4, 3, 0) (K = 3). Including an empty third category modifies the inference on θ1 but not on θ1 / θ2.
Fig. 7
Fig. 7
Up-projection of posterior samples (θ1, θ2), obtained from (N1 = 8, N2 = 4) and a Dirichlet(2,2) prior (segments in 7(a)), and feasible sets obtained independently for counts (2, 1, 3) (polygons in 7(a)). The rule of combination retains non-empty intersections of these sets (7(b)).
Fig. 8
Fig. 8
Two surfaces in the 4-simplex. 8(a) shows the independence surface θ1θ4 = θ2θ3 (Fienberg and Gilbert, 1970). 8(b) shows the linkage constraint of (5.1) for ϕ ∈(0,1) as a dashed segment.
Fig. 9
Fig. 9
Support for the hypothesis of positive association H+ : θ1θ4θ2θ3 as observations in {1,2,3,4} are incorporated one by one. The dark ribbon delineates the probability p for H+, and one minus the support against it, respectively as its lower and upper rims. The width of the ribbon represents the amount of “don’t know” about the hypothesis.
Fig. 10
Fig. 10
“Dirichlet-DSM” approach of Lawrence et al. (2009) and the original approach of Dempster (1966), for the linkage model with data (25,3,4,7), the latter implemented with the proposed Gibbs sampler. Here 10(a) shows the lower and upper probabilities for assertions of the form {ϕ < c} for increasing c ∈[0,1], while 10(b) depicts the difference between these upper and lower probabilites, or equivalently the r values.

References

    1. Albert JH and Gupta AK (1983), ‘Bayesian estimation methods for 2× 2 contingency tables using mixtures of Dirichlet distributions’, Journal of the American Statistical Association 78(383), 708–717.
    1. Avis D and Fukuda K (1992), ‘A pivoting algorithm for convex hulls and vertex enumeration of arrangements and polyhedra’, Discrete & Computational Geometry 8(3), 295–313.
    1. Bang-Jensen J and Gutin GZ (2008), Digraphs: theory, algorithms and applications, Springer Science & Business Media.
    1. Basir O and Yuan X (2007), ‘Engine fault diagnosis based on multi-sensor information fusion using Dempster–Shafer evidence theory’, Information fusion 8(4), 379–386.
    1. Bauer M (1997), ‘Approximation algorithms and decision making in the Dempster–Shafer theory of evidence - an empirical study’, International Journal of Approximate Reasoning 17(2–3), 217–237.

LinkOut - more resources