. 2022 Mar 1:9:818552.
doi: 10.3389/fmolb.2022.818552. eCollection 2022.

Proteomic Identification of a Gastric Tumor ECM Signature Associated With Cancer Progression

Affiliations

Proteomic Identification of a Gastric Tumor ECM Signature Associated With Cancer Progression

Ana M Moreira et al. Front Mol Biosci. .

Abstract

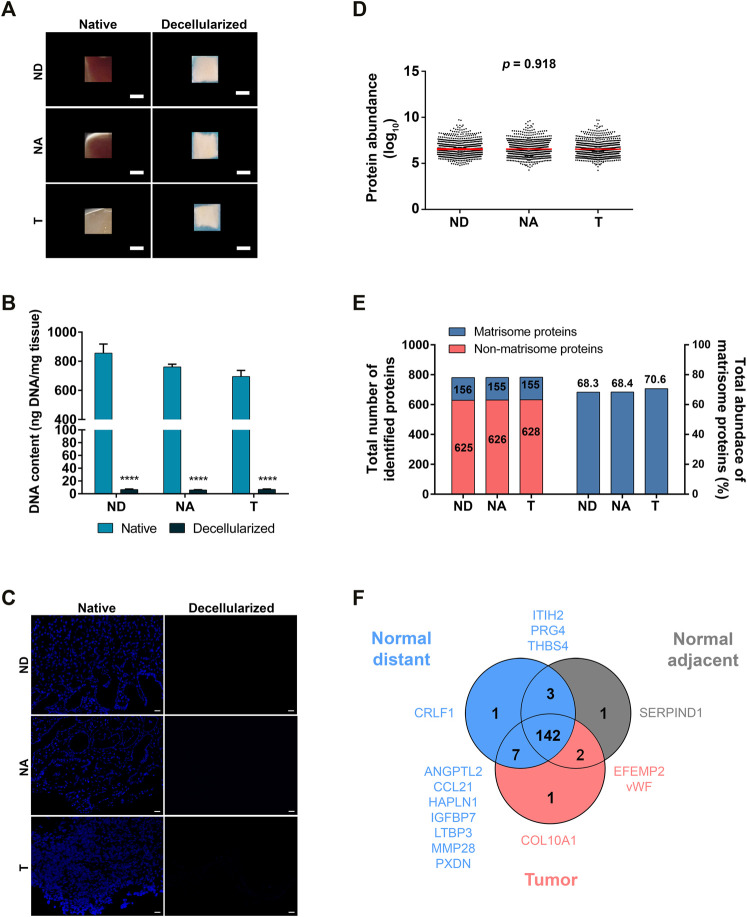
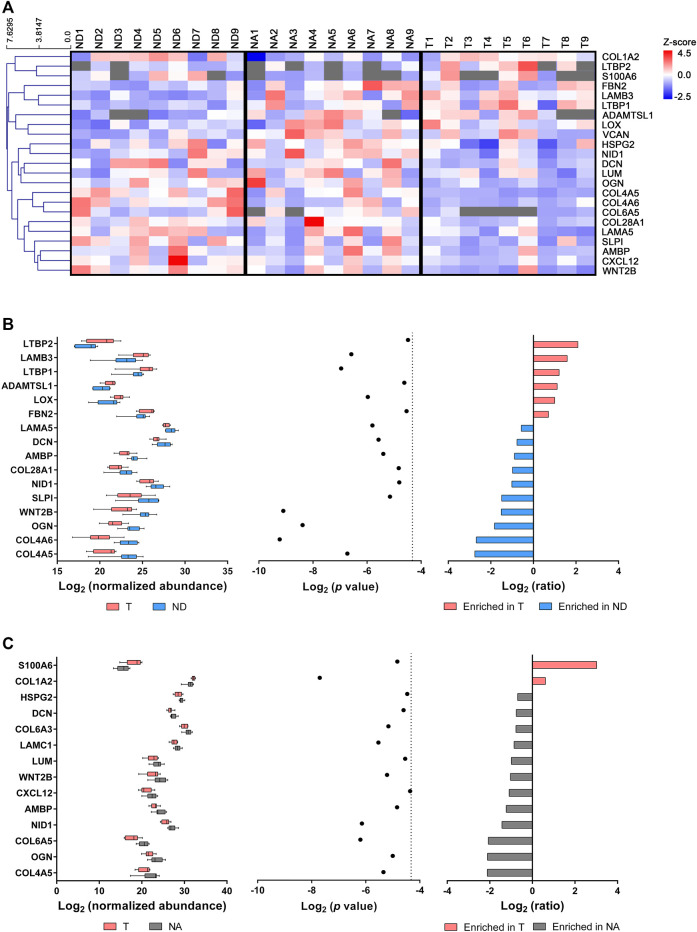
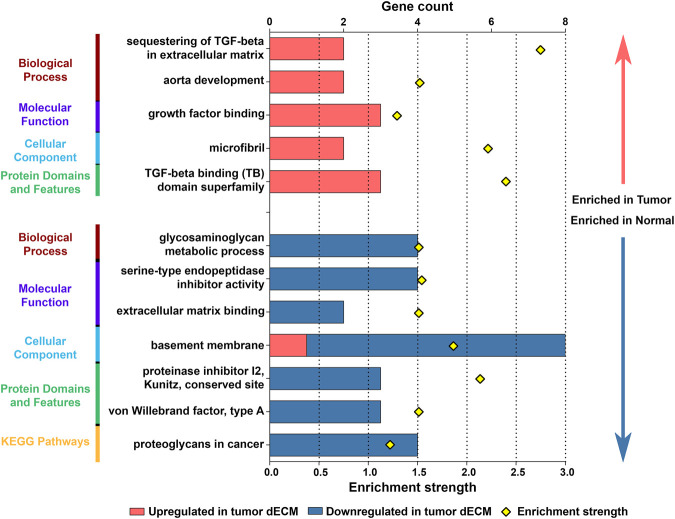
The extracellular matrix (ECM) plays an undisputable role in tissue homeostasis and its deregulation leads to altered mechanical and biochemical cues that impact cancer development and progression. Herein, we undertook a novel approach to address the role of gastric ECM in tumorigenesis, which remained largely unexplored. By combining decellularization techniques with a high-throughput quantitative proteomics approach, we have performed an extensive characterization of human gastric mucosa, uncovering its composition and distribution among tumor, normal adjacent and normal distant mucosa. Our results revealed a common ECM signature composed of 142 proteins and indicated that gastric carcinogenesis encompasses ECM remodeling through alterations in the abundance of 24 components, mainly basement membrane proteins. Indeed, we could only identify one de novo tumor-specific protein, the collagen alpha-1(X) chain (COL10A1). Functional analysis of the data demonstrated that gastric ECM remodeling favors tumor progression by activating ECM receptors and cellular processes involved in angiogenesis and cell-extrinsic metabolic regulation. By analyzing mRNA expression in an independent GC cohort available at the TGCA, we validated the expression profile of 12 differentially expressed ECM proteins. Importantly, the expression of COL1A2, LOX and LTBP2 significantly correlated with high tumor stage, with LOX and LTBP2 further impacting patient overall survival. These findings contribute for a better understanding of GC biology and highlight the role of core ECM components in gastric carcinogenesis and their clinical relevance as biomarkers of disease prognosis.

Keywords: biomarker; extracellular matrix (ECM); gastric cancer; matrisome; proteomics.


Conflict of interest statement

The authors declare that the research was conducted in the absence of any commercial or financial relationships that could be construed as a potential conflict of interest.

Figures

FIGURE 1
FIGURE 1
Characterization and proteomic analysis of decellularized gastric ECM. (A) Representative macroscopic images of normal distant (ND), normal adjacent (NA) and tumor (T) samples from human gastric mucosa before and after decellularization; scale bar = 1 mm. (B) DNA quantification of native and decellularized ECM samples (n = 3). Data are shown as mean ± SD, ****p < 0.0001. (C) Representative images of DAPI staining of native and decellularized samples; scale bar = 20 µm. (D) Log10 of normalized abundance distribution for all identified proteins in decellularized samples. (E) Total number of matrisome and non-matrisome proteins identified in decellularized ECM, with the corresponding abundance (%) of each set of matrisome proteins. (F) Venn diagram with the number of matrisome proteins identified in each tissue in at least 1/3 of the samples (n = 9). We have identified a gastric matrisome signature composed of 153 proteins (in blue) and a tumor-specific ECM signature with three proteins (in red). Proteins present in only one or two ECM sets are specified.
FIGURE 2
FIGURE 2
Differentially expressed proteins in gastric ECM. (A) Heatmap representation of hierarchical clustering (average linkage and Euclidean metric) of protein expression profiles indicated as log2 (normalized abundance). Grey rectangles represent expression below detection limit. Tumor (T) ECM (n = 9) yielded six upregulated and 10 downregulated proteins in comparison with normal distant (ND) mucosa (B), while two were upregulated and 12 were downregulated when compared with normal adjacent (NA) mucosa (C). Normalized abundance values were compared using a two-tailed, unpaired Student’s t-test corrected for multiple comparisons with the Benjamini-Hochberg method. Dotted line represents statistical significance threshold (p < 0.05).
FIGURE 3
FIGURE 3
Functional and pathway enrichment analysis of differentially expressed proteins in tumor ECM. For GO term analysis, proteins were assigned to three main categories: Biological Process, Molecular Function and Cellular Component. The main Protein Domains and Features and KEGG Pathways were also identified. Graph depicts the most relevant results for each category enriched in tumor and normal ECM (additional data in Supplementary Table S2). Bars represent gene count and dots depict enrichment strength.
FIGURE 4
FIGURE 4
Gene expression violin plots of matrisome components differentially expressed in tumor ECM. Gastric cancer RNA-Seq expression from TCGA-STAD database comparing paired tumor (T) and normal adjacent (NA) tissue (n = 27). ECM genes significantly upregulated (A) or downregulated (B) in tumor samples. Plots were generated in the TNMplot platform [https://tnmplot.com/analysis/; (Bartha and Győrffy, 2021)]. Gene expression levels were normalized through DESeq2 (median-of-ratios method). Groups were compared using the Wilcoxon test and a p value below 0.05 was considered statistically significant.
FIGURE 5
FIGURE 5
Association of differentially expressed ECM components with GC pathological features and overall survival. Increased expression of COL1A2, LOX and LTBP2 is significantly associated with diffuse type GC (A) and with high TNM stage (B). Gene expression levels were normalized through DESeq2 (median-of-ratios method). Expression values were compared using student’s t test or one-way ANOVA followed by Tukey’s HSD test. *p < 0.05, **p < 0.01 and ****p < 0.0001. (C) Gastric cancer patients with increased tumor expression of LOX and LTBP2 have worse overall survival when compared with those exhibiting low expression. Survival between groups was compared using the Mantel-Cox test and log rank p value below 0.05 was considered statistically significant. Median survival refers to overall survival probability S(t) = 0.5. Vertical lines on Kaplan-Meier curves represent censored subjects.

Similar articles

Cited by

References

    1. Acerbi I., Cassereau L., Dean I., Shi Q., Au A., Park C., et al. (2015). Human Breast Cancer Invasion and Aggression Correlates with ECM Stiffening and Immune Cell Infiltration. Integr. Biol. (Camb) 7 (10), 1120–1134. 10.1039/c5ib00040h - DOI - PMC - PubMed
    1. Arnold M., Park J. Y., Camargo M. C., Lunet N., Forman D., Soerjomataram I. (2020). Is Gastric Cancer Becoming a Rare Disease? A Global Assessment of Predicted Incidence Trends to 2035. Gut 69 (5), 823–829. 10.1136/gutjnl-2019-320234 - DOI - PMC - PubMed
    1. Ashburner M., Ball C. A., Blake J. A., Botstein D., Butler H., Cherry J. M., et al. (2000). Gene Ontology: Tool for the Unification of Biology. Nat. Genet. 25 (1), 25–29. 10.1038/75556 - DOI - PMC - PubMed
    1. Baba Y., Iyama K.-i., Ikeda K., Ishikawa S., Hayashi N., Miyanari N., et al. (2007). Differential Expression of Basement Membrane Type IV Collagen α Chains in Gastric Intramucosal Neoplastic Lesions. J. Gastroenterol. 42 (11), 874–880. 10.1007/s00535-007-2112-2 - DOI - PubMed
    1. Bartha Á., Győrffy B. (2021). TNMplot.com: A Web Tool for the Comparison of Gene Expression in Normal, Tumor and Metastatic Tissues. Ijms 22 (5), 2622. 10.3390/ijms22052622 - DOI - PMC - PubMed