. 2022 Jan 19;13(9):2744-2752.
doi: 10.1039/d1sc06426f. eCollection 2022 Mar 2.

Cooperativity as quantification and optimization paradigm for nuclear receptor modulators

Affiliations

Cooperativity as quantification and optimization paradigm for nuclear receptor modulators

Pim J de Vink et al. Chem Sci. .

Abstract

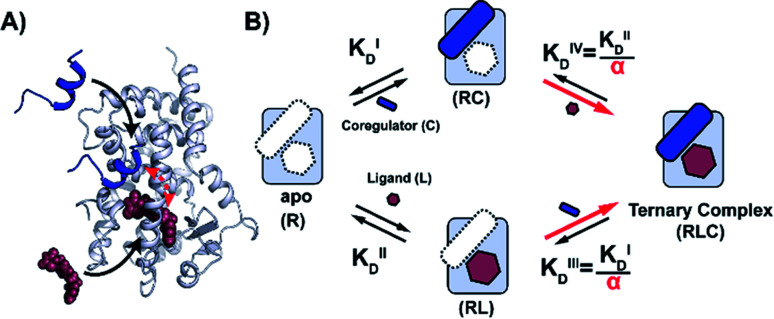
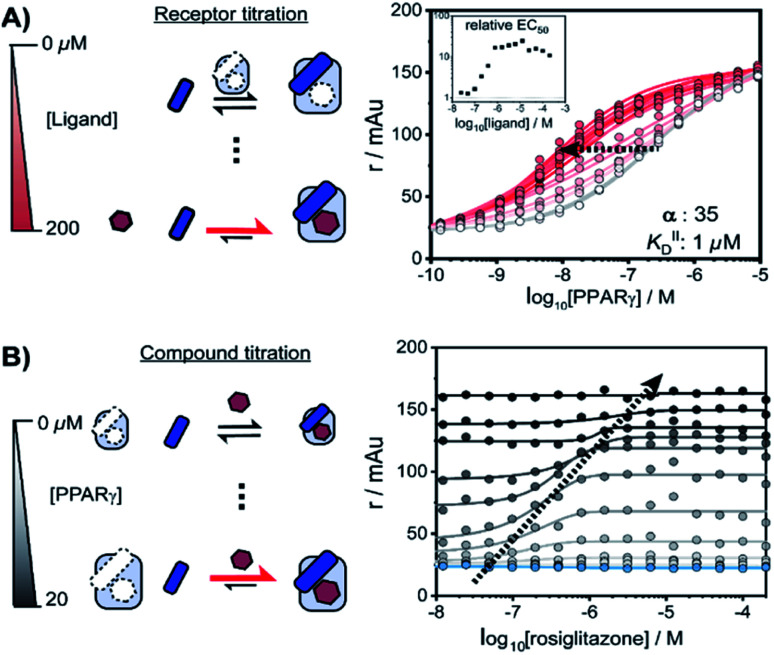
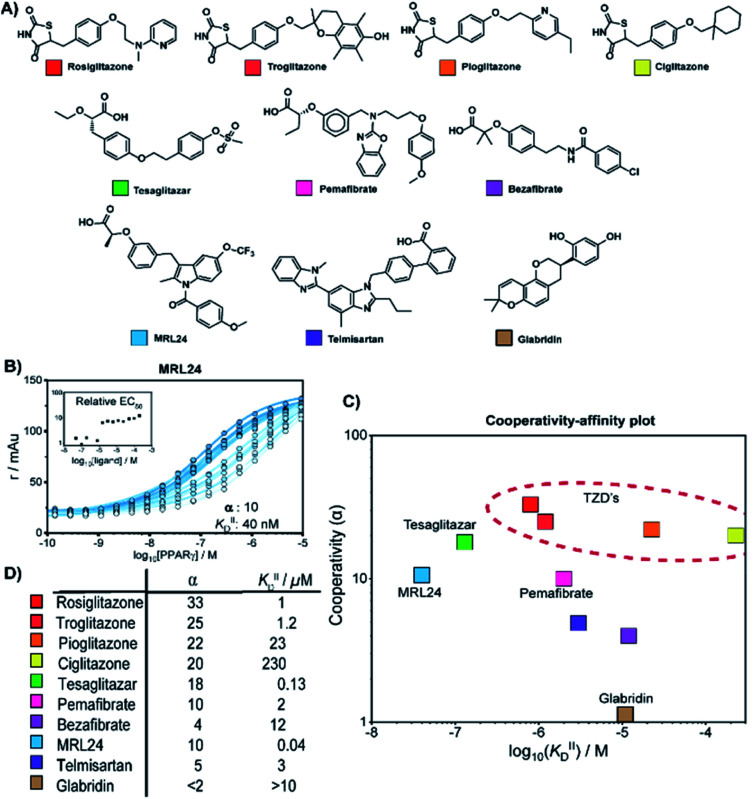
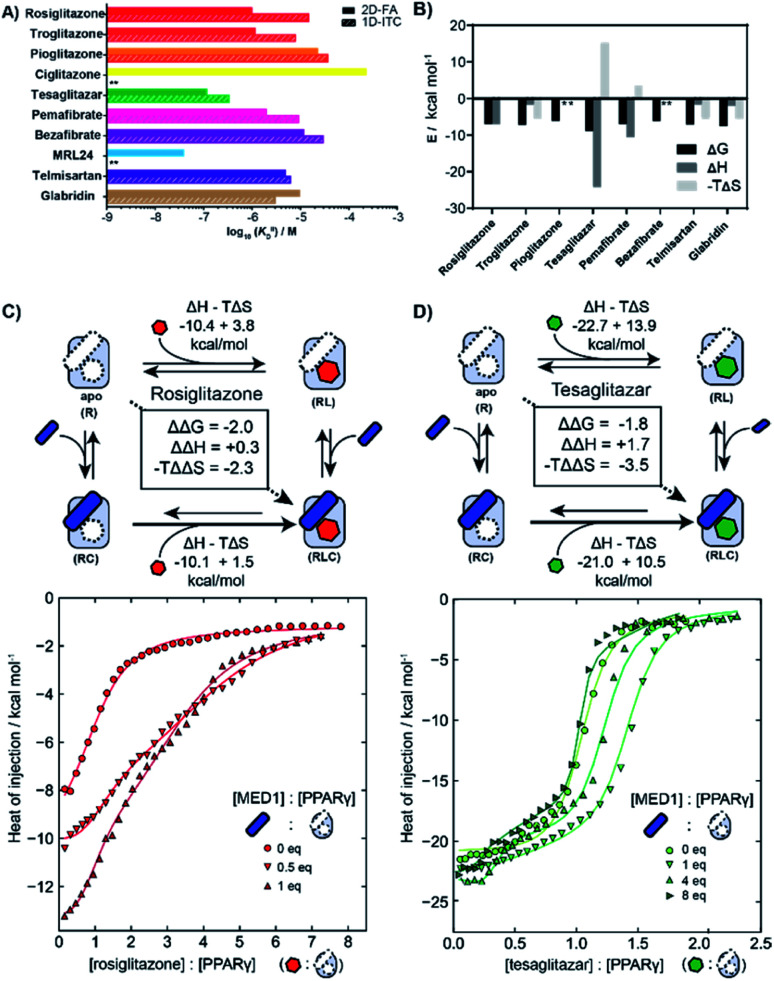
Nuclear Receptors (NRs) are highly relevant drug targets, for which small molecule modulation goes beyond a simple ligand/receptor interaction. NR-ligands modulate Protein-Protein Interactions (PPIs) with coregulator proteins. Here we bring forward a cooperativity mechanism for small molecule modulation of NR PPIs, using the Peroxisome Proliferator Activated Receptor γ (PPARγ), which describes NR-ligands as allosteric molecular glues. The cooperativity framework uses a thermodynamic model based on three-body binding events, to dissect and quantify reciprocal effects of NR-coregulator binding (K I D) and NR-ligand binding (K II D), jointly recapitulated in the cooperativity factor (α) for each specific ternary ligand·NR·coregulator complex formation. These fundamental thermodynamic parameters allow for a conceptually new way of thinking about structure-activity-relationships for NR-ligands and can steer NR modulator discovery and optimization via a completely novel approach.


Conflict of interest statement

There are no conflicts to declare.

Figures

Fig. 1
Fig. 1. Cooperativity analysis square depicting the multiple binding events in NR–ligand mediated coregulator recruitment. (A) Structural depiction of an exemplary NR·ligand·coregulator complex composed of PPARy, rosiglitazone, shown as spheres, and MED1, shown as blue cartoon (PDB ID 5YCP and 6ONJ). (B) Cooperativity scheme for ligand coregulator interplay involving sequential binding events of receptor (R), ligand (L) and coregulator (C). The coregulator binds to the target protein with KID and in the presence of a ligand this affinity is altered to KID/α. Similarly, the ligand binds with an intrinsic affinity KIID and an enhanced affinity KIID/α when the coregulator binding partner is already bound to the target protein.
Fig. 2
Fig. 2. Interplay of rosiglitazone and MED1 binding to PPARγ–LBD measured by 2D fluorescence anisotropy. (A) 2D-FA protein-titration of PPARγ to 10 nM labeled MED1 at various rosiglitazone concentrations (0–200 μM). (B) 2D-FA compound titration of rosiglitazone to 10 nM labeled MED1 with various concentrations of PPARγ (0–20 μM; blue to black).
Fig. 3
Fig. 3. Cooperativity analyses of PPAR ligands on the interaction with the MED1 coregulator. (A) Molecular structure of PPARγ agonists. (B) Representative 2D titration. PPARγ–LBD is titrated to labelled MED1, at several constant concentrations of agonist (0–200 μM). Insets show the relative EC50 as function of the concentration ligand used (see ESI Fig. S2 for total overview). (C) Cooperativities and intrinsic affinities parameters. The cooperativity factor α, defined as the ratio between ligand bound affinity and the non-stabilized affinity of the cofactor for the receptor, and KIIID are obtained through data-fitting according to the model depicted in Fig. 1. (D) Overview of the distribution between cooperativity (α) and intrinsic affinity (KIID) parameters of the tested PPAR ligands.
Fig. 4
Fig. 4. Isothermal titration calorimetry measurements (ITC) of PPAR ligands and synergy with the coregulator MED1. (A) Comparison of intrinsic affinities (KIID) of the various PPARy ligands as measured by 1D-ITC and 2D-FA (** = not determined). (B) Thermodynamic characteristics of binary interaction of ligand for PPARγ (* = not determined; see additional ITC data & ESI Table S1 for total overview). (C) 2D-ITC of rosiglitazone to PPARγ in the presence of various concentrations of MED1 added in cell and syringe. (D) 2D-ITC of tesaglitazar to PPARγ in the presence of various concentrations of MED1 added in cell and syringe.
Fig. 5
Fig. 5. Increasing rigidity of PPARγ upon ligand and coregulator binding. (A) 3D representation of the model used for the analysis. Left: overall view of the structure with rosiglitazone shown as spheres within the ligand binding site and the MED1 coregulator shown as blue cartoon and highlighted. The coregulator binding groove (AF2-pocket) is indicated. Right: zoom of the structural portions interacting with the ligand and the coregulator (omitted for clarity). (B) RMSF of the four states of the cooperativity square. The secondary structure of the protein is show at the bottom of the graph. The regions involved in the interaction with both the ligand and the coregulator, namely the areas within H3, H4 and H5 and H10–H12 are zoomed. (C) 3D structures of the four states are represented as putty cartoons and inserted within the cooperativity scheme. The flexibility is shown with a gradient scale going from blue (low flexibility) to red (high flexibility). The thickness of the tube is also proportional to the magnitude of the flexibility. Flexibility values of loop areas and terminal residues are omitted (colored in dark grey in the cartoon). On the top right, a cartoon representation of the receptor with the most flexible portions highlighted and labelled is reported.
Fig. 6
Fig. 6. Synergistic interplay of ligand and coregulator binding to PPARγ. (A) Hydrogen bonds between rosiglitazone and PPARγ. On the left, the comparison of the occupancy (%) of the hydrogen bonds in the presence () and in the absence () of the coregulator. On the right, the representation of the interactions. Hydrogen bonds are shown as lines colored according to their occupancy over the simulation, as shown in the legend. Residues and helices are labelled. (B) Essential motions of MED1 in the two simulations. The amplitude of the cartoon is proportional to the magnitude of the motion and the gradient of colour indicates the direction of the motion (from black to white). (C) Hydrogen bonds occupancy between MED1 and PPARγ in the absence () and in the presence () of the ligand. The coregulator is colored in white and the interacting residues and helices are labelled. Hydrogen bonds are shown as lines colored according to their occupancy over the simulation, as shown in the legend. (D) Superposition of the average structures of PPARγ·MED1() and PPARγ·Ros·MED1(). The different positioning of H12 and MED1 is highlighted.

References

    1. Andrei S. A. Sijbesma E. Hann M. Davis J. O'Mahony G. Perry M. W. D. Karawajczyk A. Eickhoff J. Brunsveld L. Doveston R. G. Milroy L.-G. Ottmann C. Expert Opin. Drug Discovery. 2017;12:925–940. doi: 10.1080/17460441.2017.1346608. - DOI - PubMed
    1. Schreiber S. L. Cell. 2021;184:3–9. doi: 10.1016/j.cell.2020.12.020. - DOI - PubMed
    1. de Vink P. J. Andrei S. A. Higuchi Y. Ottmann C. Milroy L.-G. Brunsveld L. Chem. Sci. 2019;10:2869–2874. doi: 10.1039/C8SC05242E. - DOI - PMC - PubMed
    1. Gadd M. S. Testa A. Lucas X. Chan K.-H. Chen W. Lamont D. J. Zengerle M. Ciulli A. Nat. Chem. Biol. 2017;13:514–521. doi: 10.1038/nchembio.2329. - DOI - PMC - PubMed
    1. Whitty A. Nat. Chem. Biol. 2008;4:435–439. doi: 10.1038/nchembio0808-435. - DOI - PubMed