. 2022 Apr 15;17(4):840-853.
doi: 10.1021/acschembio.1c00893. Epub 2022 Mar 26.

Detection of SARS-CoV-2 RNA Using a DNA Aptamer Mimic of Green Fluorescent Protein

Affiliations

Detection of SARS-CoV-2 RNA Using a DNA Aptamer Mimic of Green Fluorescent Protein

Bria S VarnBuhler et al. ACS Chem Biol. .

Abstract

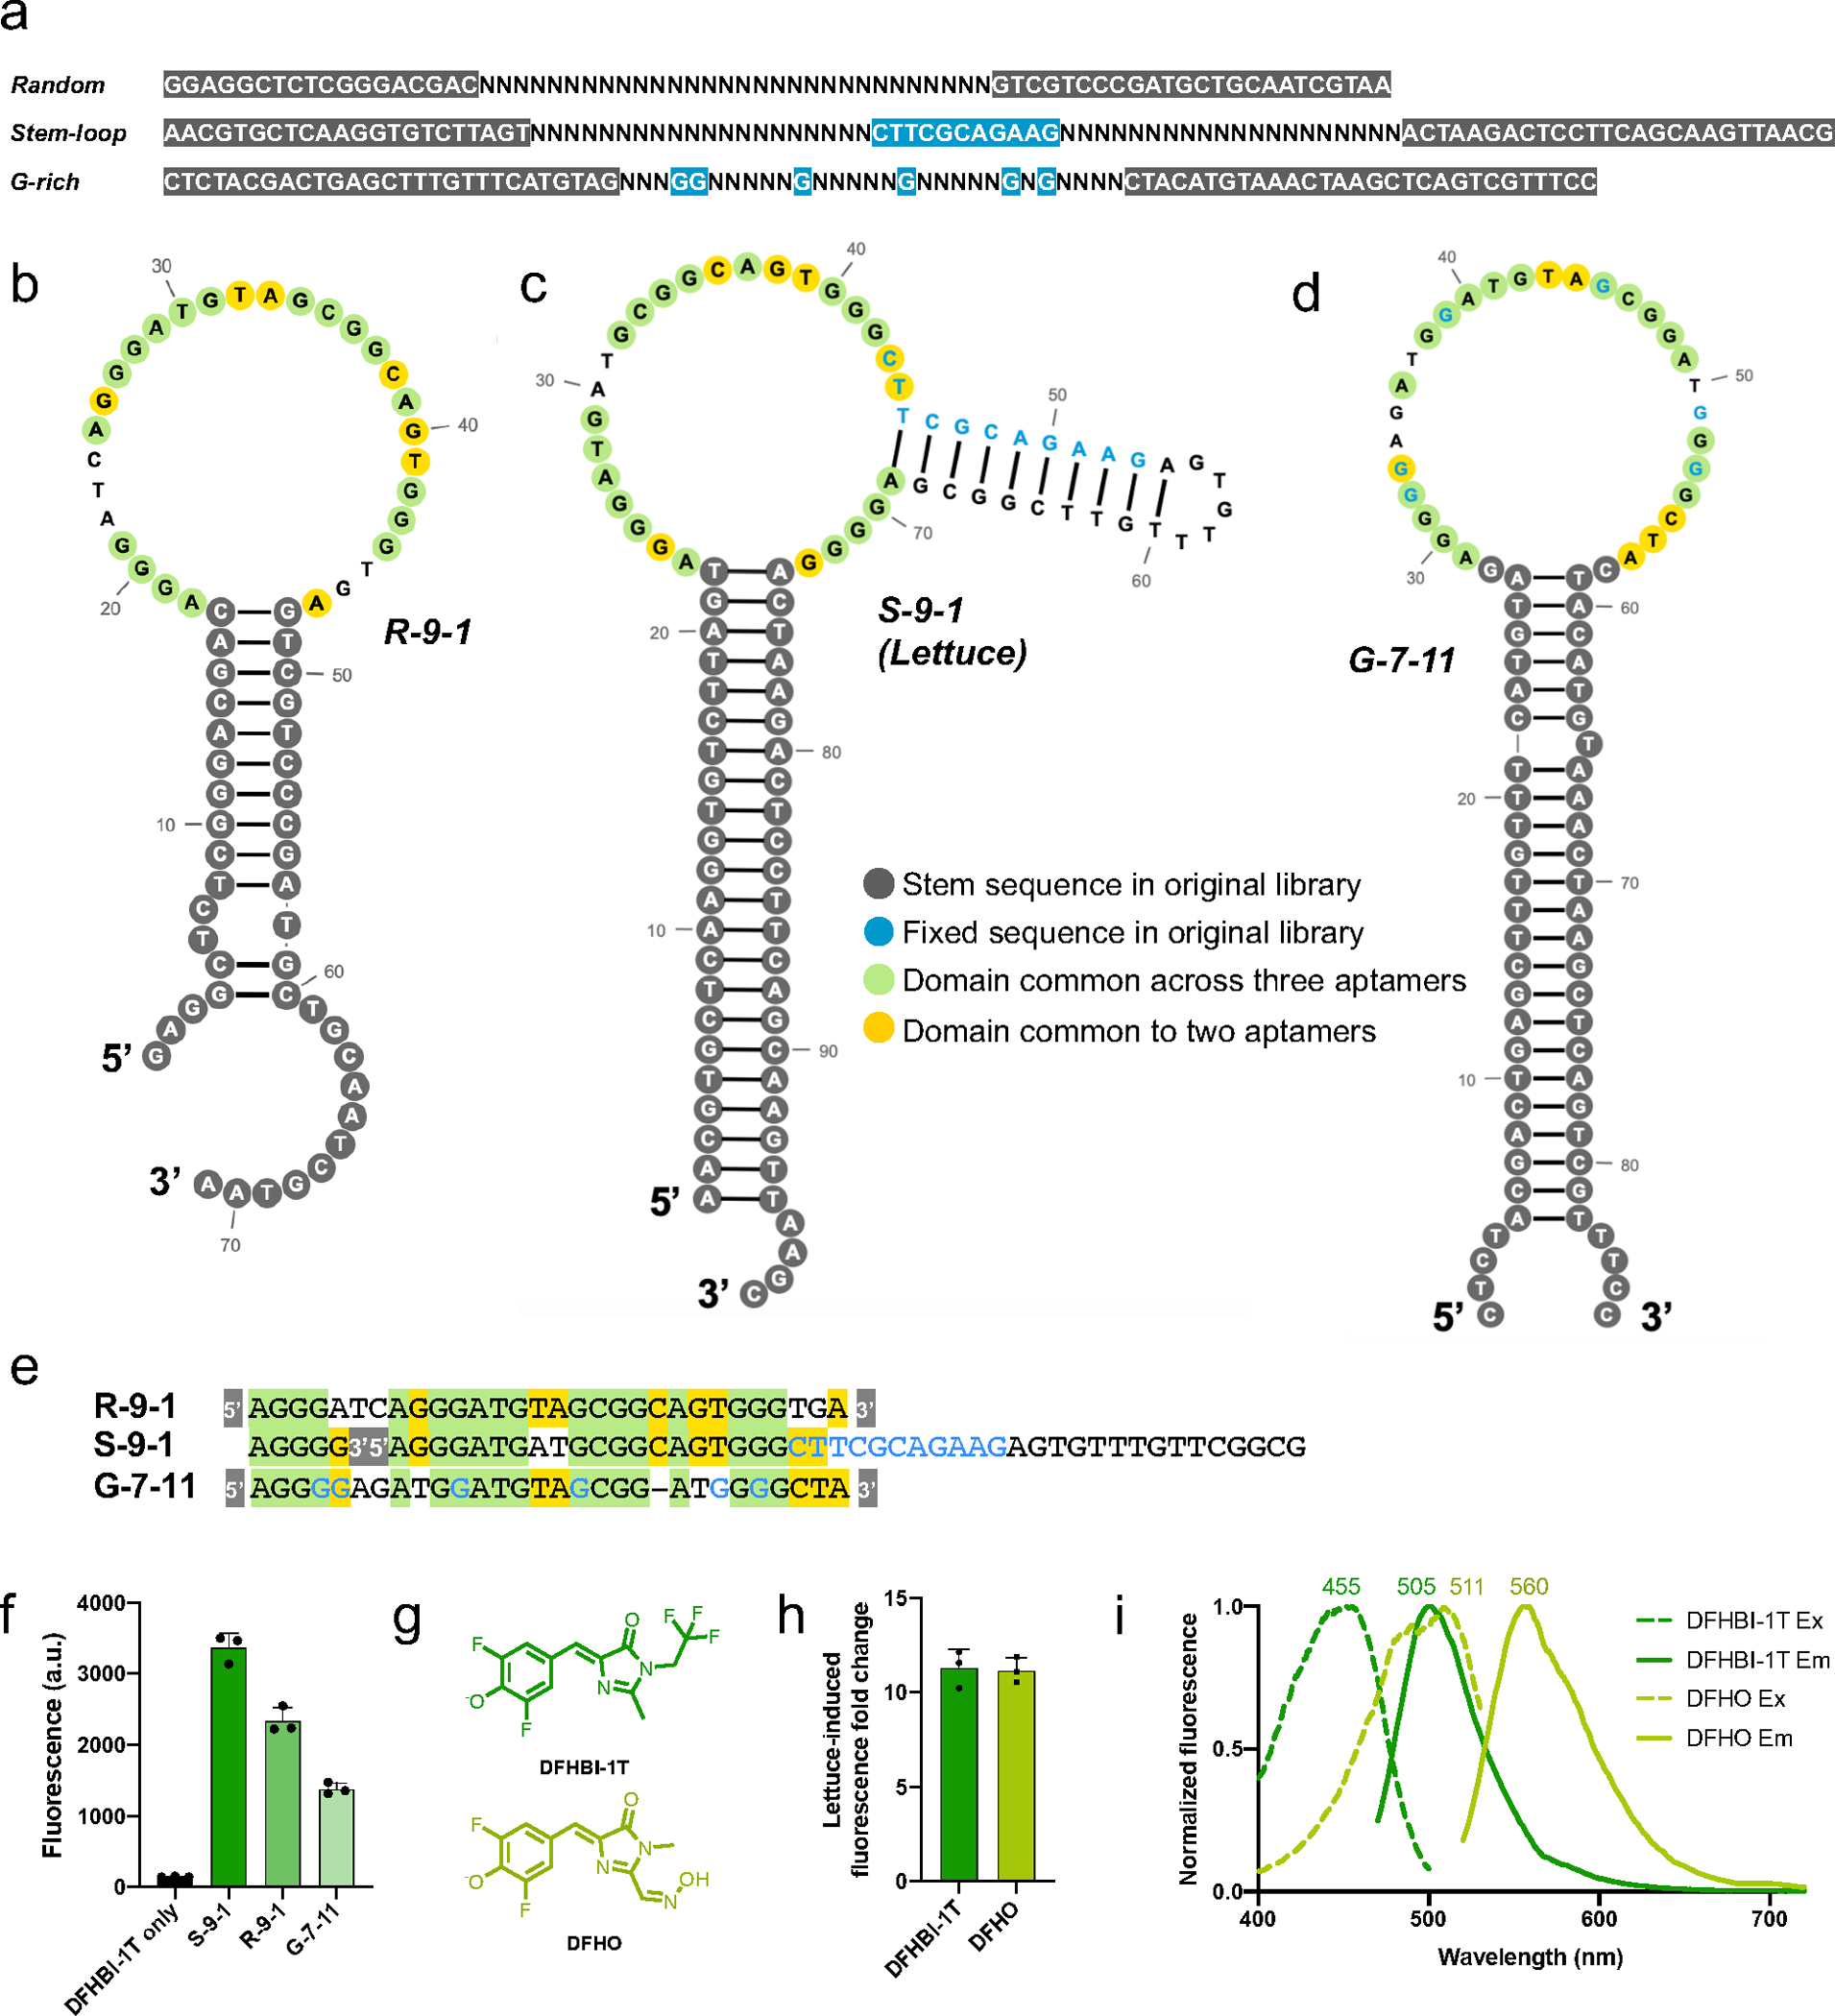
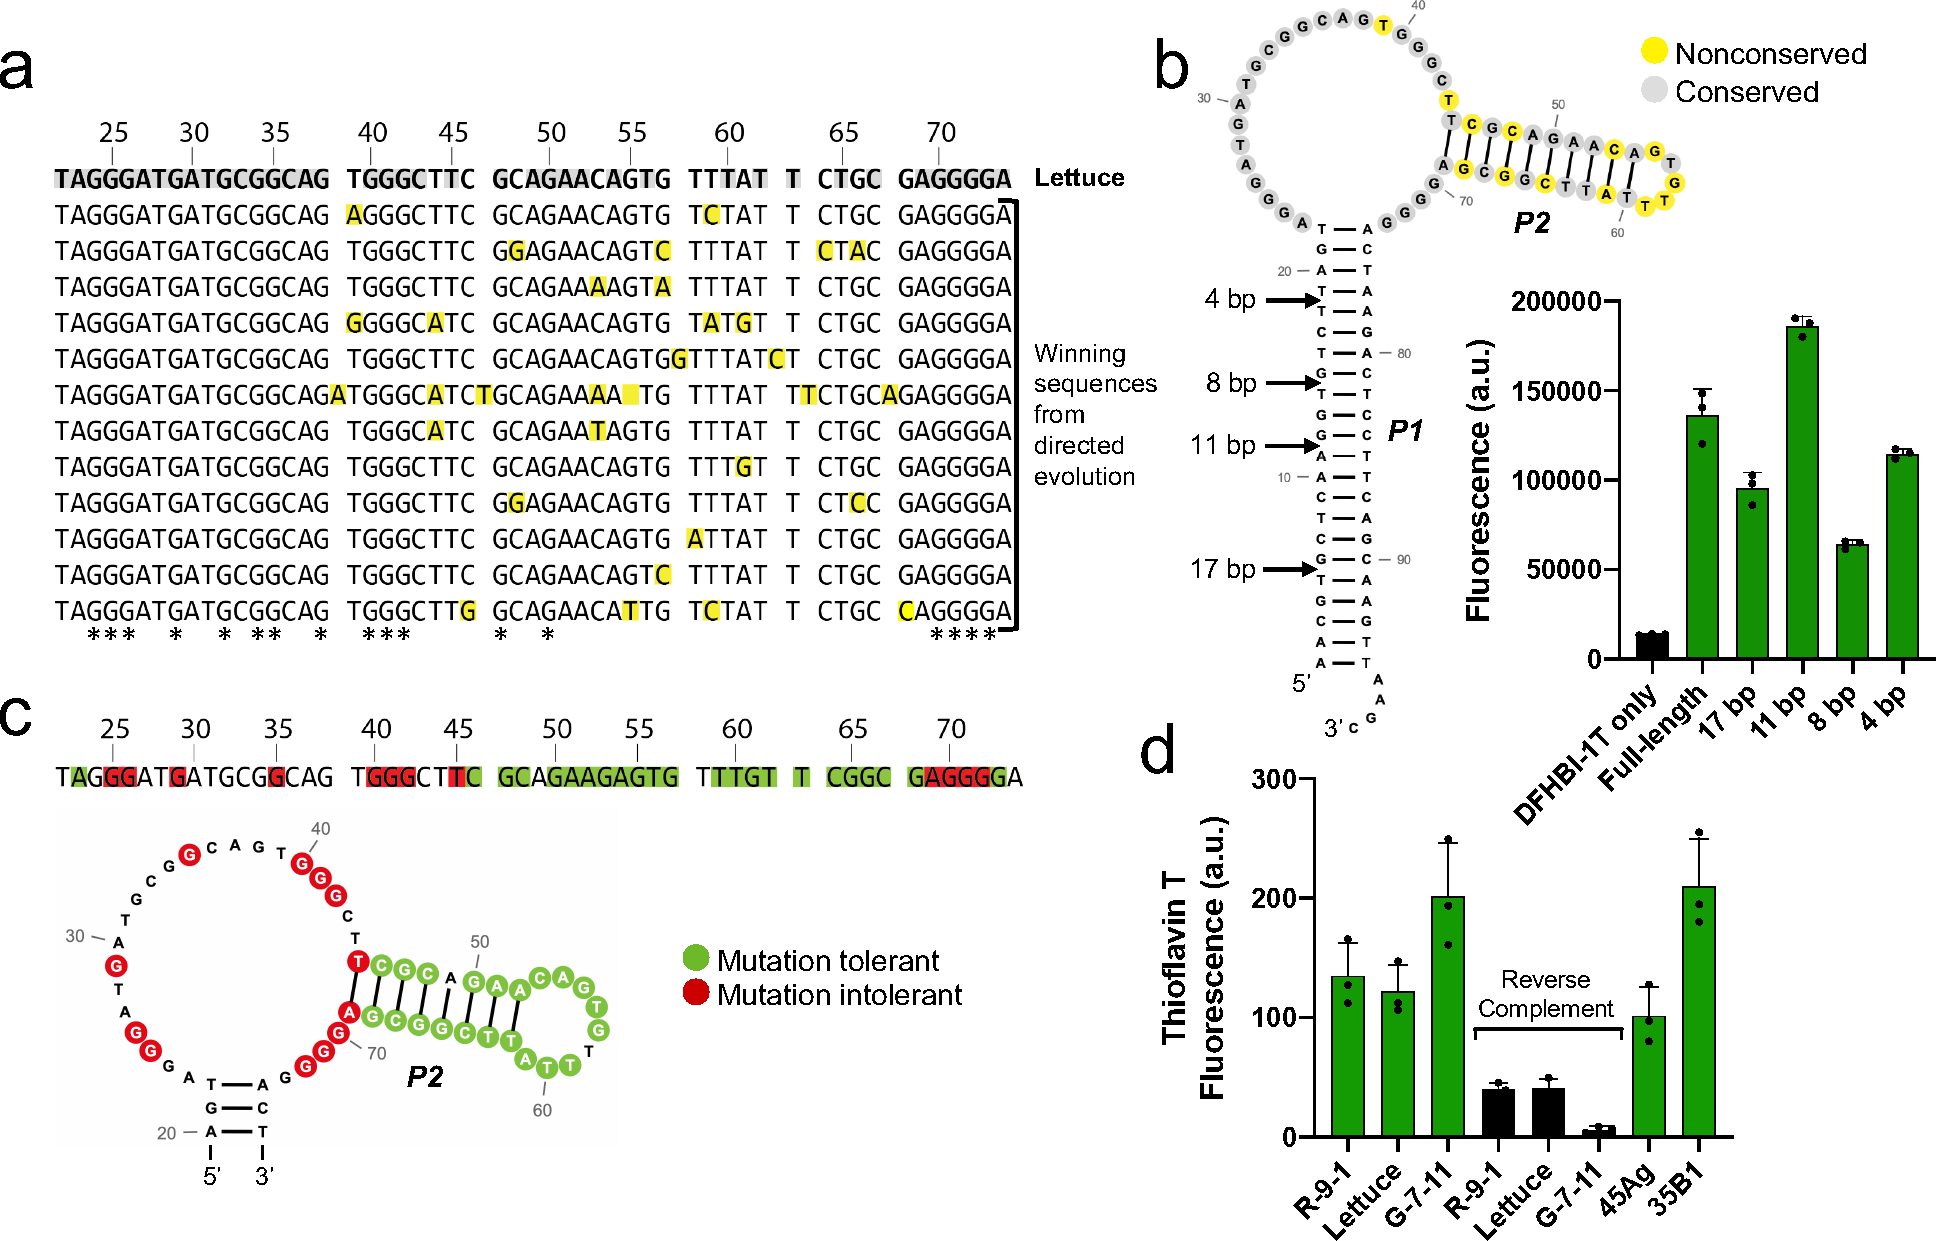
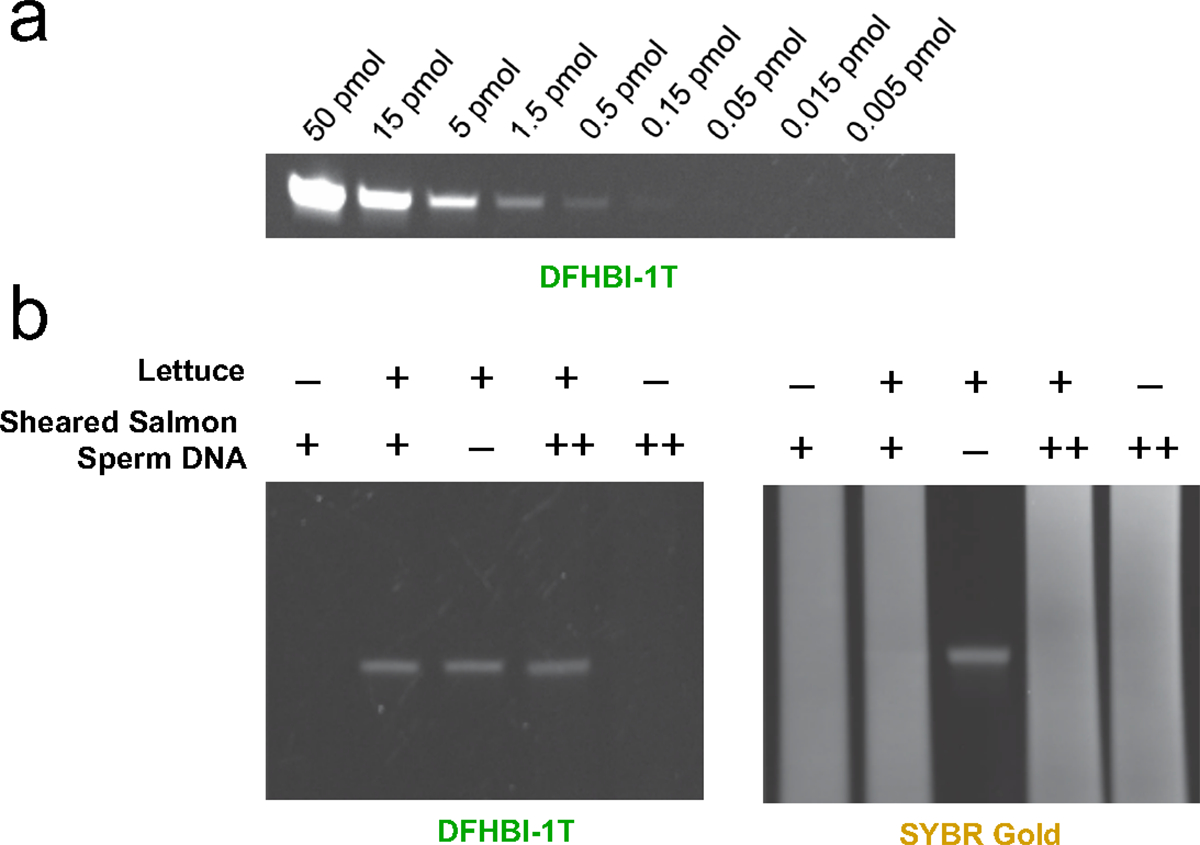
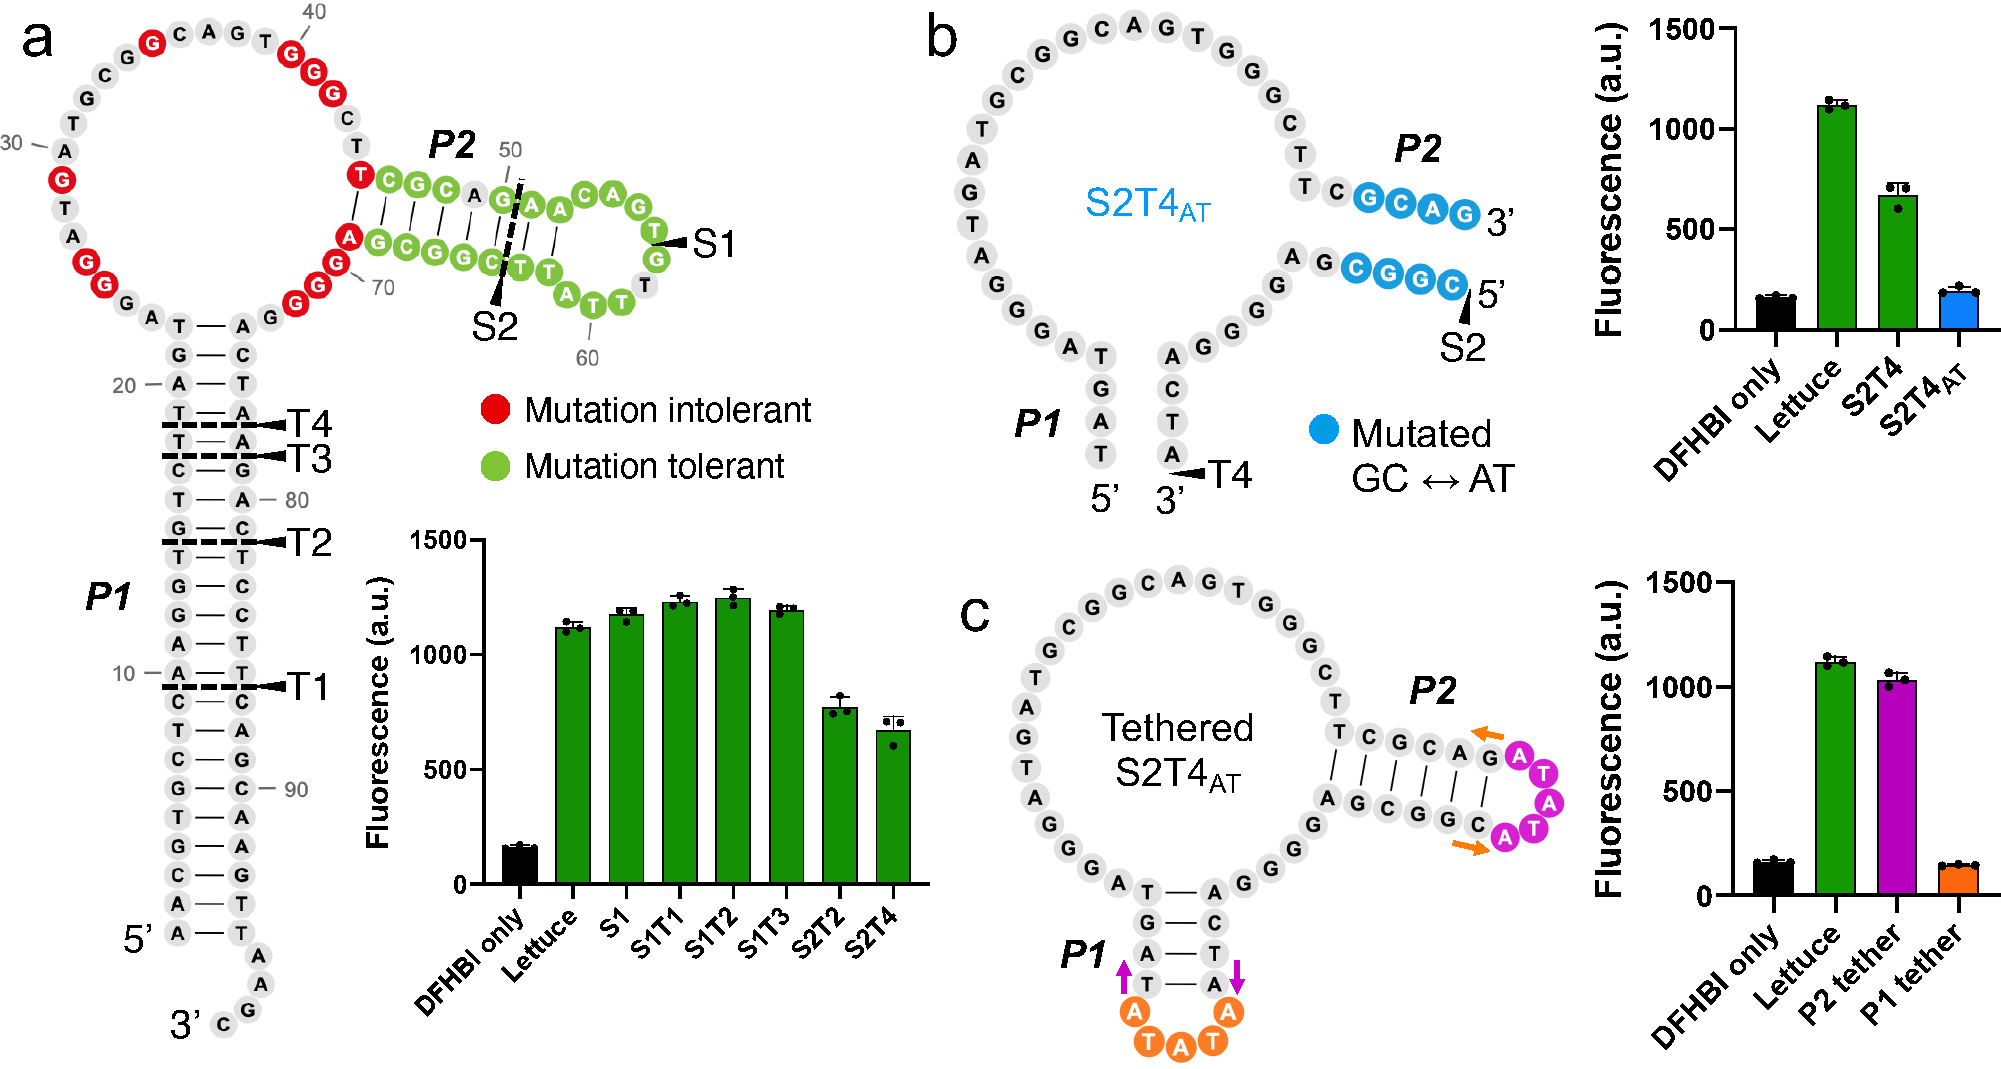
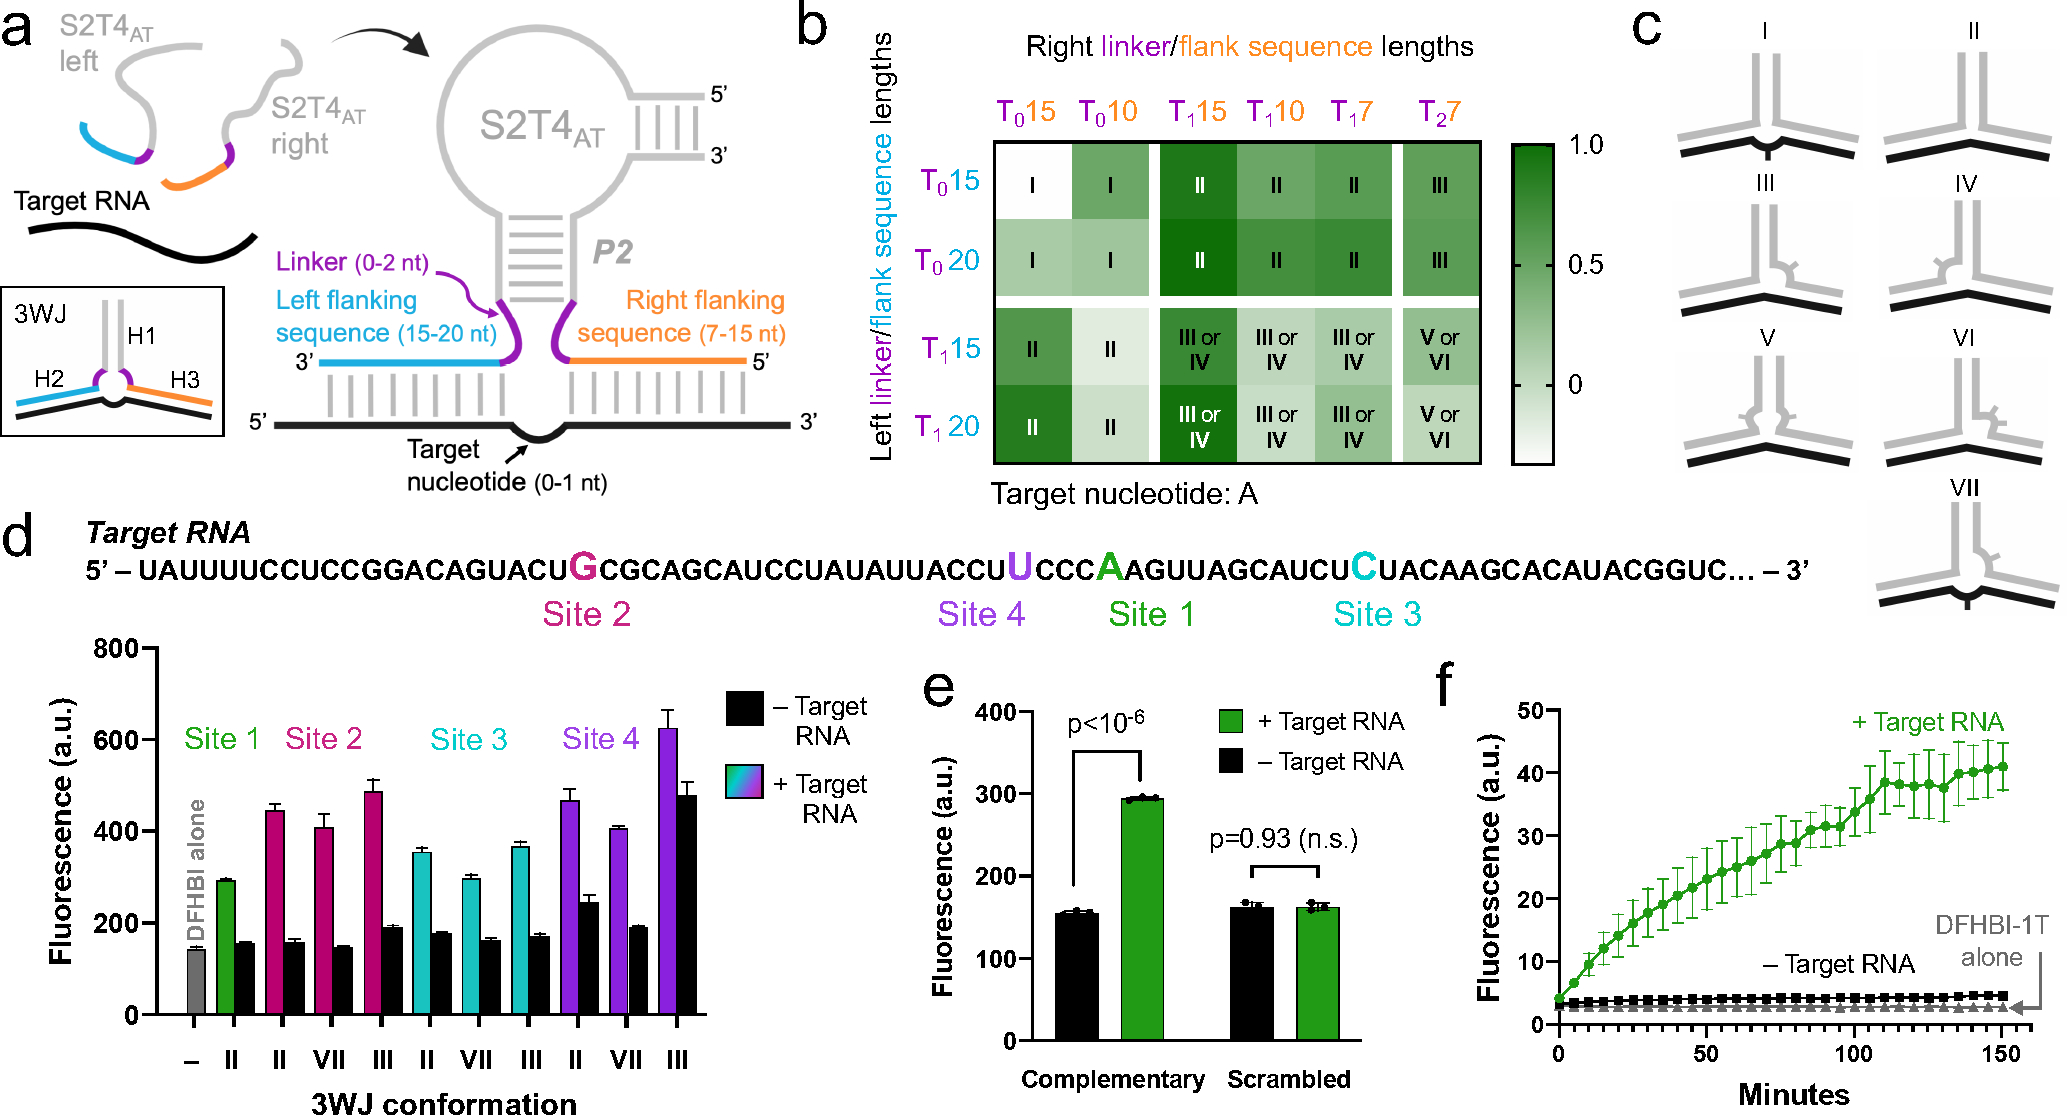
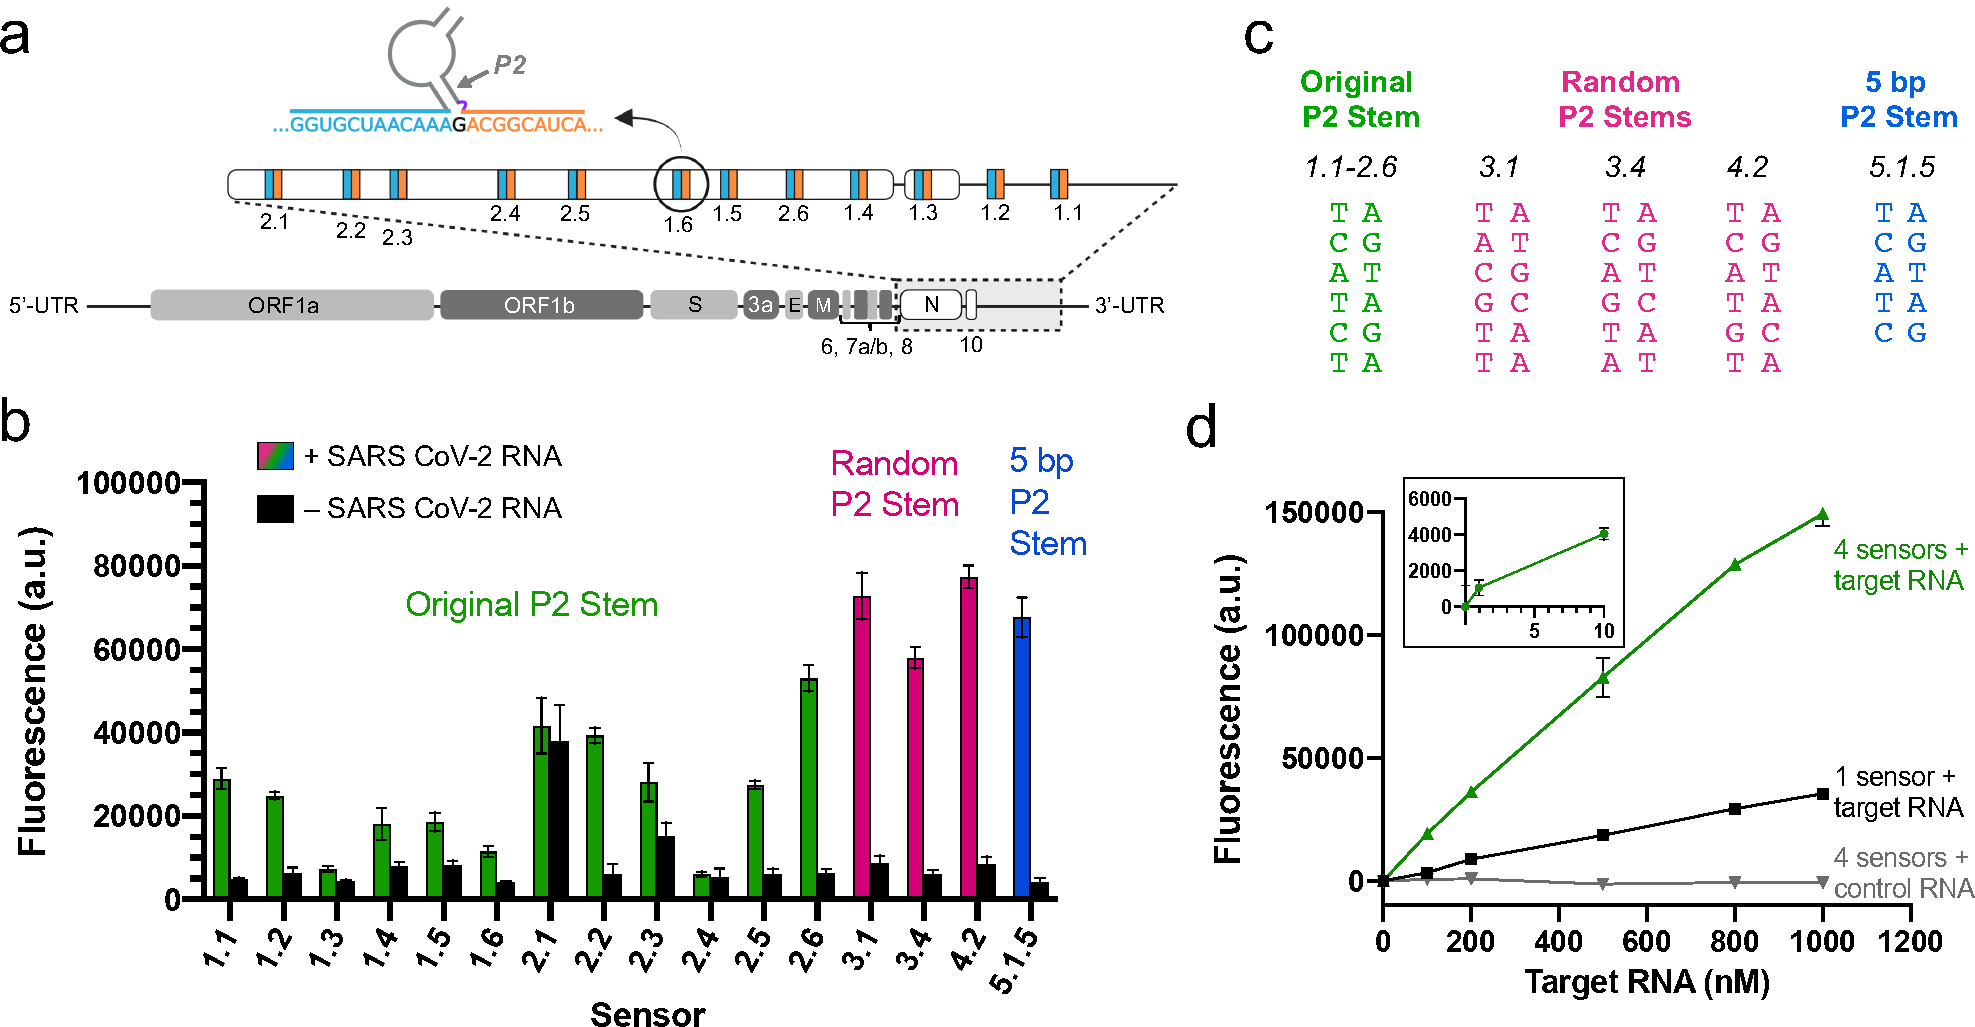
RNA detection is important in diverse diagnostic and analytical applications. RNAs can be rapidly detected using molecular beacons, which fluoresce upon hybridizing to a target RNA but require oligonucleotides with complex fluorescent dye and quencher conjugations. Here, we describe a simplified method for rapid fluorescence detection of a target RNA using simple unmodified DNA oligonucleotides. To detect RNA, we developed Lettuce, a fluorogenic DNA aptamer that binds and activates the fluorescence of DFHBI-1T, an otherwise nonfluorescent molecule that resembles the chromophore found in green fluorescent protein. Lettuce was selected from a randomized DNA library based on binding to DFHBI-agarose. We further show that Lettuce can be split into two separate oligonucleotide components, which are nonfluorescent on their own but become fluorescent when their proximity is induced by a target RNA. We designed several pairs of split Lettuce fragments that contain an additional 15-20 nucleotides that are complementary to adjacent regions of the SARS-CoV-2 RNA, resulting in Lettuce fluorescence only in the presence of the viral RNA. Overall, these studies describe a simplified RNA detection approach using fully unmodified DNA oligonucleotides that reconstitute the Lettuce aptamer templated by RNA.


Conflict of interest statement

Declaration of Competing Interests

The authors declare the following competing financial interest(s): S.R.J. is the cofounder of Lucerna Technologies and Chimerna Therapeutics and has equity in these companies. Lucerna has licensed technology related to Spinach and other RNA-fluorophore complexes.

Figures

Figure 1.
Figure 1.. Characterization of DNA aptamers that bind DFHBI-1T
a) SELEX libraries used to discover DFHBMT-1T-binding DNA aptamers. The “random” library contains 5’ and 3’ flanking sequences (grey) that are complementary to each other and provide a fixed sequence to facilitate amplification between SELEX rounds. In between these fixed regions is a 40-nt random region. “N” represents a nucleotide added from a phosphoramidite mixture containing an equal proportion of A’s, G’s, C’s, and U’s. The “stem-loop” library contains eleven nucleotides (shown in blue) in the middle of the randomized region which form a 4-bp stem with a 3-nt loop. The “G-rich” library contains six fixed guanine nucleotides (blue) interspersed throughout the variable region. b–d) Secondary structure prediction of b) R-9-1, c) S-9-1 and d) G-7-11. Green and yellow shaded nucleotides represent conserved positions across all three and two of the three aptamers, respectively, when their sequences are aligned as shown in Figure 1e. Dark grey shaded nucleotides represent nucleotides that were part of the stem-forming flanking regions in the original library (Figure 1a). Fixed nucleotides are shown in blue. e) Sequence alignment for aptamers R-9-1, S-9-1, and G-7-11. The grey-shaded 5’ and 3’ represent the constant 5’ and 3’ sequences of each aptamer. Fixed nucleotides are shown in blue. f) DFHBI-1T fluorescence enhancement by aptamers discovered from each library. S-9-1, R-9-1, and G-7-11 originated from the stem-loop, random, and G-rich libraries, respectively. Fluorescence was measured using 20 μM DNA and 2 μM DFHBI-1T on a Horiba fluorometer (excitation 460 nm, emission 505 nm). The S-9-1 aptamer exhibits the highest fluorescence enhancement of DFHBI-1T and was thus chosen for further study using the name “Lettuce”. The mean and SEM values are shown (n=3). g) Chemical structures of DFHBI-1T and DFHO fluorophores. h) Lettuce activates the fluorescence of DFHBI-1T and DFHO to a similar extent. Each fluorophore (2 μM) was incubated with and without Lettuce (20 μM). Shown is the fold increase between the fluorescence of the fluorophore alone and the signal of the fluorophore when activated by Lettuce. The mean and SEM values are shown (n=3). i) Lettuce-DFHO displays red-shifted fluorescence excitation and emission spectra compared to Lettuce-DFHBI-1T. Excitation and emission maximal wavelengths are indicated. Spectra were measured using 20 μM DNA and 2 μM of the indicated compound.
Figure 2.
Figure 2.. Lettuce likely contains a G-quadruplex in its DFHBI-1T-binding region.
a) Sequence alignment of aptamers that retained the ability to induce DFHBI-1T fluorescence after directed evolution of Lettuce. All aptamers exhibited similar fluorescence signal to that of Lettuce. The top sequence is Lettuce, and all sequences below are sequences of functionally active aptamers discovered from directed evolution of Lettuce. Yellow-shaded nucleotides differ from the sequence of Lettuce. Grey-shaded nucleotides in the Lettuce sequence were conserved across all functionally active aptamers from the direct evolution experiment. G residues that are conserved across all functionally active aptamers are indicated in the bottom row with an asterisk. Fluorescence emission was measured at (excitation 460 nm, emission 480–560 nm) for all mutants using 10 μM DNA and 20 μM DFHBI-1T. b) Lettuce’s long stem is nonessential for fluorescence activation of DFHBI-1T. Arrows indicate the lengths to which the stem was truncated. Fluorescence was measured (excitation 460 nm, emission 505 nm) of each truncated construct using 1 μM DNA and 5 μM DFHBI-1T. The secondary structure prediction of Lettuce is color coded as in Figure 2a, where yellow represents nonconserved positions and grey represents conserved positions, c) Summary of mutational analysis. To identify essential and nonessential residues for fluorescence, Lettuce was mutated at single positions and the fluorescence of each mutant was assessed, where mutants that retained fluorescence within 10% of Lettuce were considered tolerant, and mutants with fluorescence values below 30% of Lettuce were considered to be intolerant. Green and red shaded nucleotides indicate positions at which a mutation was tolerated or not tolerated, respectively. Unshaded positions were not tested. Fluorescence emission was measured (excitation 460 nm, emission 480–560 nm) for 35 mutants of Lettuce using 10 μM DNA and 20 μM DFHBI-1T. d) Fluorescence activation of thioflavin T by DNA aptamers. R-9-1, Lettuce, and G-7-11 were incubated with thioflavin T, a compound known to bind G-quadruplexes. Reverse complement sequences which are not expected to form G-quadruplexes were tested, along with two sequences known to form G-quadruplexes (45Ag and 35B1). Fluorescence (excitation 430 nm, emission 485 nm) was measured using 1 μM DNA and 1 μM thioflavin T.
Figure 3.
Figure 3.. Gel staining using Lettuce.
a) Titration of Lettuce on a gel. To test the amount required to visualize Lettuce on a gel, we prepared samples containing known amounts of Lettuce. The amount of Lettuce specified was loaded into each lane of a 10% TBE-urea polyacrylamide gel. After polyacrylamide gel electrophoresis, the gel was washed to remove urea, and then stained with DFHBI-1T (20μM) in a solution containing 140 mM KCl and 1 mM MgCl2. Fluorescence was measured using the FITC protocol in a Bio-Rad gel doc imager. b) Lettuce can be observed on a gel in a mix of other DNA with DFHBI-1T staining. The gel was also stained with SYBR-Gold (right) to observe total DNA. Samples were prepared with Lettuce (2 pmol) and sheared salmon sperm DNA (“+” corresponds to 8 μg, “++” corresponds to 40 μg). Samples were loaded into a 10% TBE-urea polyacrylamide gel. After polyacrylamide gel electrophoresis, the gel was stained with DFHBI-1T (20 μM) or SYBR Gold in a solution containing 140 mM KCl and 1 mM MgCl2. Fluorescence was measured using the FITC imaging channel in a Bio-Rad gel doc imager.
Figure 4.
Figure 4.. Development of conditionally fluorescent split Lettuce
a) Map of Lettuce split and truncation sites and their resulting fluorescence activation. The two helices (P1 and P2) that were modified are shown. Split sites (S) indicate positions where Lettuce was broken into two strands. Truncation sites (T) mark the length to which the P1 stem was truncated. Constructs that were both split at site X and truncated at site Y are designated SXTY. Residues that are tolerant (green) or intolerant (red) to mutation are shown. Fluorescence activation of each pair of Lettuce strands was measured (excitation 460 nm, emission 505 nm) using 10 μM DNA and 5 μM DFHBI on a Gen5 fluorescence plate reader. Error bars indicate s.d. (n=3). b) Decreasing the G/C content of the P2 stem inactivates Lettuce fluorescence. The four terminal base pairs in the P2 stem of S2T4 (Figure 4A) were mutated from G/C to A/T or vice versa, forming a new, inactive version with an AT-rich stem, S2T4AT. Fluorescence activation was measured as described in Figure 4a. Error bars indicate s.d. (n=3). c) Forced proximity of the two S2T4AT strands reactivates fluorescence. A five-nucleotide tether loop was placed on either the P1 (orange) or P2 (pink) stem to test if the two strands could activate fluorescence when brought together. The P2 tether was successful at restoring fluorescence activity. The 5’ and 3’ ends of the strand are indicated by colored arrows that correspond to each tethered construct. Error bars indicate s.d. (n=3).
Figure 5.
Figure 5.. Optimization of split Lettuce for detection of target RNA.
a) Diagram of the split Lettuce RNA sensor and regions to be optimized. Each half of S2T4at can assemble on a target RNA sequence via flanking sequences (orange and blue) that are complementary to the target RNA (black), forming a three-way junction (3WJ) between the two Lettuce oligonucleotides and the target RNA. The three helices (H1-H3) of the 3WJ are indicated. The left and right strands we tested had 7, 10, 15, or 20-nt flanking sequences and 0, 1, or 2 linker residues (purple). We tested RNA target sites with either one or zero unpaired target nucleotides, b) Sensor pairs have various 3WJ conformations and activate a range of fluorescence signal. Left and right strands with the indicated lengths of thymine linkers (purple) and flanking sequences (blue and orange) were designed to target a single site on a target RNA. Fluorescence of each pair was measured with and without target RNA. Heat map values were obtained by subtracting the fluorescence of samples without target RNA from samples with target RNA, and values over 0.5 were considered successful. Roman numerals refer to each pair’s 3WJ structure, which are shown in Figure 5c. The 3WJ assignments take into account that the target nucleotide, adenine, can base pair with thymines in the linkers. Type II and III 3WJs were the most successful on this particular target site (Figure 5d, Site 1). c) Diagrams of a selection of the 3WJs that can form between target RNA (black) and the two Lettuce sensor strands (grey). The location of unpaired nucleotides is indicated by curves, where one and two tick marks correspond to one and two unpaired nucleotides, d) Sensor designs that were successful on one target RNA site also work on three other target RNA sites. Sensor pairs of type II, type III and type VII 3WJs were designed to target three other RNA sites (Site 2, Site 3, and Site 4) which each have a different target nucleotide (G, C, and U, respectively). For comparison, the highest-performing sensor from Figure 1b, which targets Site 1, is included. The majority of the sensors exhibited signal-to-background ratios as high or higher than the original Site 1 sensor, showing that these sensor designs can be generalized to detect other RNA targets of interest. Fluorescence was measured (excitation 460 nm, emission 505 nm) using 10 μM DNA, 5 μM DFHBI, and 5 μM RNA on a Gen5 fluorescence plate reader. Error bars indicate s.d. (n=3). e) Split Lettuce RNA detection is sequence-dependent. To confirm the specific base pairing between flanking sequences and the target RNA sequence, we randomly scrambled the flanking sequences of the Site 1 sensor shown in Figure 5d. No increase in fluorescence is observed when target RNA is present. With fully complementary flanking sequences, the sensor exhibits an increase in fluorescence when target RNA is present. Fluorescence was measured as described in Figure 5d. Error bars indicate s.d. (n=3). f) Time dependence of split Lettuce sensor fluorescence. Split Lettuce halves and DFHBI-1T were incubated with or without target RNA and fluorescence was measured as described in Figure 5d at different time points for a total of 150 minutes. Error bars indicate s.d. (n=3).
Figure 6.
Figure 6.. Detection of SARS-CoV-2 RNA using split Lettuce sensors.
a) SARS-CoV-2 RNA target sites of split Lettuce sensors. An outline of the SARS-CoV-2 viral genome is shown. The N gene, ORF10, and 3’-UTR were amplified, and sites were chosen as targets for left (blue) and right (orange) sensor flanking sequences. Sites for sensors 1.1–2.6 are shown. Diagram is not to scale. b) Fluorescence of SARS-CoV-2 sensors. Sensors were designed with the original Lettuce P2 stem sequence (green), a randomized P2 stem sequence (pink) and a 5 bp stem sequence (blue). Buffer-only background fluorescence was subtracted from all samples. Sensor 5.1.5 targets the same site as sensor 1.5, but has one deleted base pair in its P2 stem. All other sensors target unique RNA sites. Specific P2 stem sequences for these sensors are shown in Figure 6c. Fluorescence was measured (excitation 460 nm, emission 505 nm) with a SpectraMax M-series fluorescence plate reader using 1.5 μM DNA, 0.5 μM RNA, and 2 μM DFHBI-1T. Error bars indicate s.d. (n=3). c) Sequences of the P2 stem in each sensor. P2 stems are spatially oriented as shown in Figure 6a such that the bottom of the stem connects to the flanking sequences of the sensor and the top connects to the rest of the Lettuce sequence. The 5-bp P2 stem is the same as the original P2 stem, with the bottom A/T base pair deleted. d) Increasing the number of split Lettuce sensors results in higher sensitivity of SARS-CoV-2 RNA detection. The fluorescence activation of four split Lettuce sensors compared to one split Lettuce sensor was measured at a range of SARS-CoV-2 RNA concentrations. The background signal (DNA and DFHBI-1T only) was subtracted from each data point. Beta-actin RNA was used as a control to test for off-target fluorescence activation. Fluorescence was measured as described in Figure 6b. Error bars indicate s.d. (n=3).

References

    1. Tyagi S; Kramer FR Molecular Beacons: Probes That Fluoresce upon Hybridization. Nature Biotechnology 1996, 14 (3). 10.1038/nbt0396-303. - DOI - PubMed
    1. You M; Jaffrey SR Structure and Mechanism of RNA Mimics of Green Fluorescent Protein. Annual Review of Biophysics 2015, 44 (1), 187–206. 10.1146/annurev-biophys-060414-033954. - DOI - PubMed
    1. Paige JS; Wu KY; Jaffrey SR RNA Mimics of Green Fluorescent Protein. Science 2011, 333 (6042). 10.1126/science.1207339. - DOI - PMC - PubMed
    1. Filonov GS; Moon JD; Svensen N; Jaffrey SR Broccoli: Rapid Selection of an RNA Mimic of Green Fluorescent Protein by Fluorescence-Based Selection and Directed Evolution. Journal of the American Chemical Society 2014, 136 (46). 10.1021/ja508478x. - DOI - PMC - PubMed
    1. Kikuchi N; Kolpashchikov DM Split Spinach Aptamer for Highly Selective Recognition of DNA and RNA at Ambient Temperatures. ChemBioChem 2016, 1589–1592. 10.1002/cbic.201600323. - DOI - PMC - PubMed

Publication types